


Figures
- Figure 1–
a) HUES-3 cells on a murine embryonic fibroblast feeder layer. b) Embryoid bodies (EBs) treated with activin A (10 ng·mL−1) after 6 days of cell culture. c) EBs in adhesion after 10 days. d) EBs treated with small airway growth medium for 8 days. Scale bars: a–c) 200 μm; d) 100 μm.
- Figure 2–
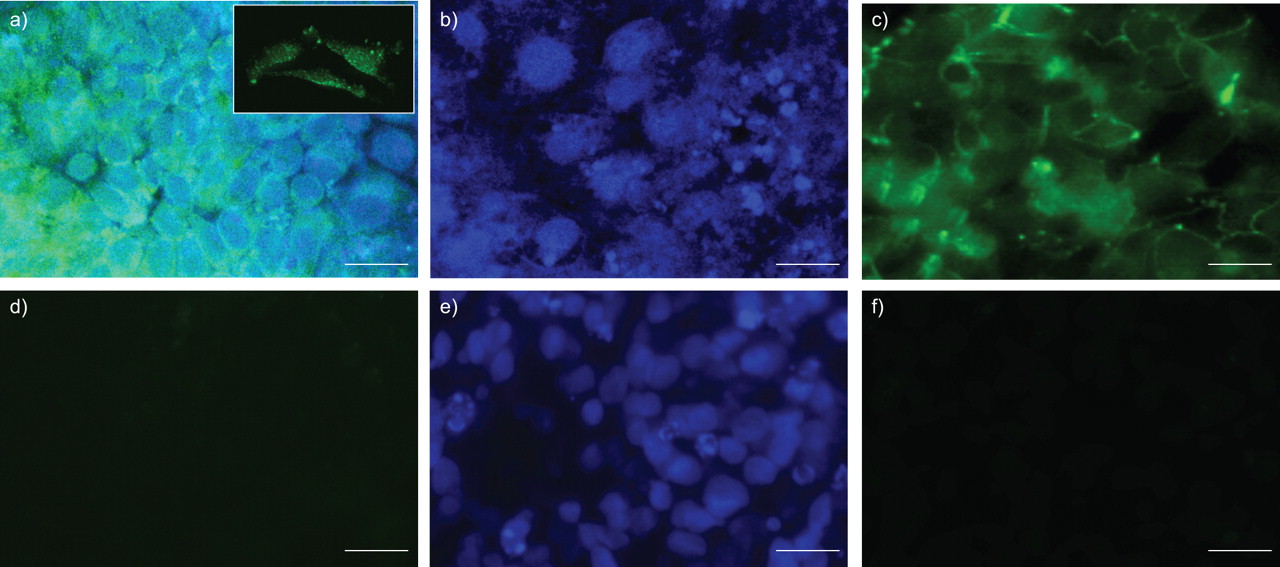
a) Confocal analysis of human surfactant protein (SP)-C antibody (green) localised on membranes of HUES-3 alveolar type II (ATII) cells after 8 days of small airway growth medium (SAGM) treatment. Inset shows a three-dimensional view; cells were cropped from a confocal z-stack acquisition. b) Cells not treated with SAGM did not show staining for SP-C. c) HUES-3-ATII cells, grown for 8 days in SAGM, showed an immunoreactivity for the tight junction marker zonula occludens (ZO)-1 (green). d) Cells not treated with SAGM did not show staining for ZO-1. e) HUES-3-ATII cells grown for 8 days in SAGM and f) cells not treated with SAGM did not show any signal for aquaporin (AQP)5 protein. Nuclei stained with TO PRO 3 (blue). Scale bars: 20 μm.
- Figure 3–
a) Quantification of octamer-binding transcription factor (OCT)-4, isoforms A and B, and NANOG transcripts in control cells (no small airway growth medium (SAGM)) and in HUES-3 alveolar type II (ATII) cells after 3, 5 and 8 days of SAGM. The fold increase of each transcript is calculated compared with control cells: p≤0.05 after 3 days, p≤0.02 after 5 days and p≤0.04 after 8 days for OCT-4; p≤0.01 after 3 days, p≤0.02 after 5 days and p≤0.03 after 8 days for NANOG. All values obtained are the mean of at least three independent experiments performed in triplicate. b) Fluorescence-activated cell sorting (FACS) analysis using fluorescein isothiocyanate (FITC)-conjugated stage-specific embryonic antigen (SSEA)-4 stem cell marker on HUES-3-ATII cells after 3, 5 and 8 days of SAGM. The control is the isotype control. c–e) FACS analysis of HUES-3-ATII cells using FITC-conjugated c) monoclonal CD105 antibody (a mesenchymal stem cell marker), d) CD34 antibody (an endothelial marker) and e) thyroid transcription factor (TTF)1 rabbit monoclonal antibody (for type II epithelial cells), after 3 days of SAGM. The data indicated a mean±sem of c) 2.6±0.01%, d) 2.3±0.01% and e) 94.8±0.02% of cells positive within the differentiated cell population. f) Surfactant protein (SP)-B and SP-C (117 and 134 isoforms) expression in HUES-3-ATII cells after 3, 5 and 8 days of SAGM. The fold increase of each transcript is calculated compared with control cells (no SAGM): p≤0.02 after 3 days, p≤0.03 after 5 days and p≤0.05 after 8 days for SP-B; p≤0.01 after 3 days, p≤0.03 after 5 days and p≤0.04 after 8 days for SP-C-117, p≤0.05 after 3 days, p≤0.02 after 5 days and p≤0.04 after 8 days for SP-C-134. g) Quantitative analysis of CXC chemokine receptor (CXCR)4 expression from embryoid bodies (EBs), from formation to their adhesion and until 3 days of SAGM treatment. The fold increase of each transcript is calculated compared with control cells (no SAGM): p≤0.01 for cells after 3 days with SAGM.
- Figure 4–
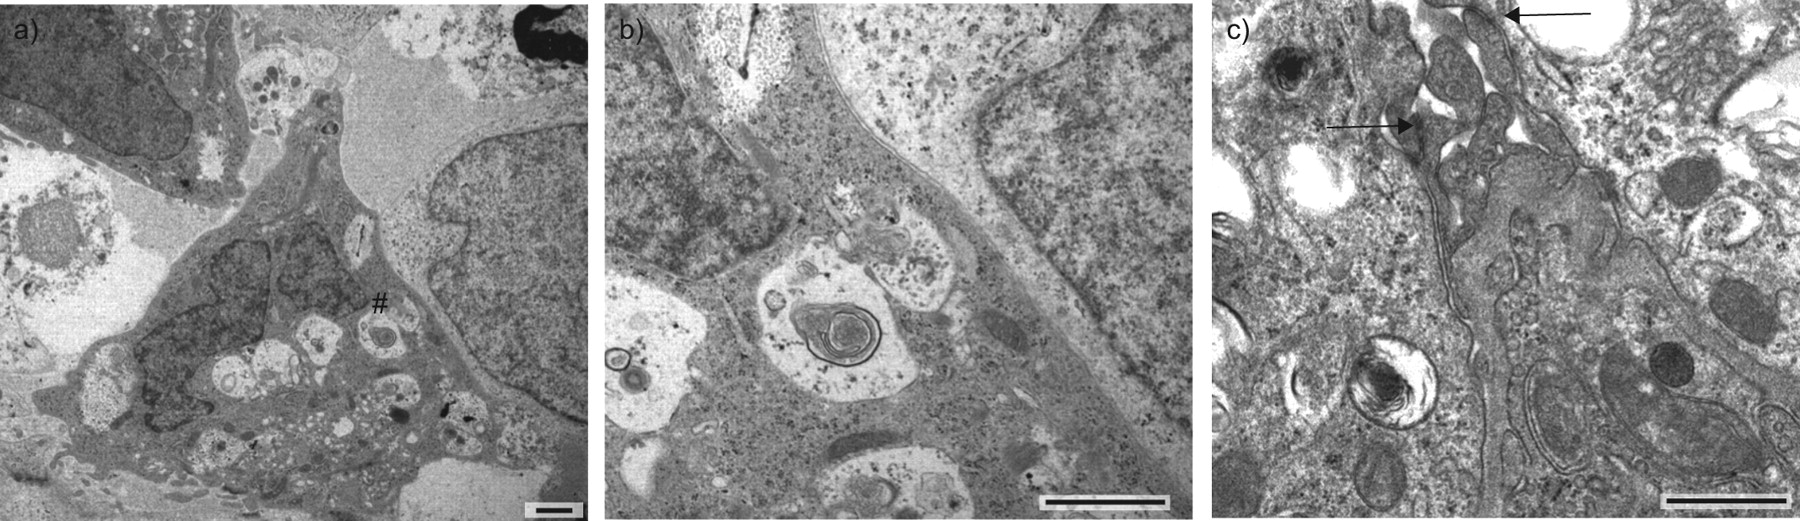
a) Transmission electron microscopy of HUES-3 alveolar type II (ATII) cells after 5 days of small airway growth medium in vitro. The bubble-like appearance and the presence of intracytoplasmic lamellar body organelles (#) indicate typical ultrastructural features of ATII cells. b) At higher magnification, details of an intracytoplasmic lamellar body. c) Higher magnification showing the presence of well-defined epithelial cell contacts including tight junctions (arrows) Scale bars: 2 μm.
- Figure 5–
a–d) Confocal immunofluorescence microscopy was performed in (a and c) HUES-3 alveolar type II (ATII) cells after 5 days treatment with small airway growth medium (SAGM) and in (b and d) untreated cells. Unpermeabilised cells were immunolabelled with a primary mouse monoclonal antibody (CF3) raised against the first loop of cystic fibrosis transmembrane conductance regulator (CFTR; green). a and b) The horizontal sections (xy) were taken at the apical region. c and d) The vertical sections (xz) were randomly acquired. ap: location of apical region; bl: location of basal region. e) Three-dimensional view of a single cell cropped from a confocal z-stack acquisition, showing the distribution of CFTR (green) in a differentiated HUES-3 cell. f) Typical recordings showing changes in intracellular chloride-dependent MQAE fluorescence in both SAGM-treated HUES-3-ATII cells and in untreated monolayers (control) in the absence or presence of the specific CFTR inhibitor, CFTRinh-172 (5 μM). CFTR-dependent chloride secretion is calculated as the difference in the rate of change of forskolin (FSK) plus 3-isobutyl-1-methylxanthine (IBMX) stimulated fluorescence with or without CFTRinh-172. NO3: nitrate. g) Summary of the data collected from different experiments performed as in f) after 3 and 5 days of treatment. Statistical comparison was made using unpaired t-test with respect to the values obtained in control cells (Ctrl; no SAGM). Scale bars: 10 μm.
- Figure 7–
a) Immunostaining for human nuclear antigen (HuNu) was performed using the streptavidin-polyADP ribose polymerase (PARP) diaminobenzidine (DAB) peroxidase system on representative sections of silica-treated lung from HUES-3 alveolar type II (ATII) cell-injected mice. Arrows show positive cells. b) Subsequent section in which the same cells (arrows) were shown to be positive for human surfactant protein (SP)-C antibody (red) at higher magnification. c) Human SP-C hybridisation analysed by confocal microscopy on silica-treated lungs 10 weeks after cell transplantation. d) Detection of human DNA in silica-treated lungs from HUES-3-ATII cell-injected mice by the Quantifiler Human kit assay (Applied Biosystems, Carlsbad, CA, USA). A negative control performed on damaged mice in which no HUES-3-ATII cells were injected did not reveal any presence of human DNA (data not shown). ΔRn: change in normalised reporter signal. Red line: threshold of 0.2. Scale bars: a) 100 μm; b) 30 μm; c) 60 μm.
- Figure 8–
Western blot analysis for a) transforming growth factor (TGF)-β and b) collagen type 1 α1 (Col1α1) in lung tissue from control (Ctrl; undamaged mice), mice damaged after 5, 10 and 20 days of silica treatment and from mice 20 days after HUES-3 alveolar type II (ATII) cell (Sil+cells 20d) and fibroblast cell (Sil+fib 20d) injection. For both, densitometric analysis revealed a reduction in expression after HUES-3-ATII cell administration in damaged mice (sil+cells 20d). All values obtained are the mean of at least three independent experiments. Note that monomeric collagen type 1 consists of α1 (110 kDa) and α2 (135 kDa) chains. c) Blood arterial oxygen saturation levels were recorded on day 15 after silica damage (n=5) and showed a significant decrease when compared with control mice injected with saline solution (Ctrl; n=5). After HUES-3-ATII cell injection (silica+cells; n=5), a complete recovery of normal arterial oxygen saturation levels was recorded (p<0.02). d) Real-time RT-PCR analysis for inflammatory cytokines on silica- treated lungs. An evident reduction of cytokine expression was found after HUES-3-ATII cell injection (silica+cells groups) with respect to damaged mice (silica groups). After 5 days: tumour necrosis factor (TNF)-α p<0.05; monocyte inflammatory protein (MIP)-2 p<0.02; interleukin (IL)-6 p≤0.03; Col1α1 p≤0.01. After 10 days: TNF-α p<0.03; MIP-2 p≤0.01; IL-6 p≤0.05; Col1α1 p≤0.04. After 15 days: TNF-α p<0.05; MIP-2 p<0.01; IL-6 p≤0.02; Col1α1 p≤0.03. No reductions were recorded in mice injected with fibroblast cells (silica+fib). The fold increase of each transcript is calculated compared with control mice injected with an equivalent volume of saline solution (Ctrl). All values obtained are the mean of at least three independent experiments performed in triplicate. e) Daily body weight measurement from the first day of silica treatment in damaged mice (silica), damaged and HUES-3-ATII cell-injected mice (silica+cells), damaged mice injected with fibroblast cells (silica+fib) and in control mice injected with saline solution (Ctrl). An evident body weight recovery was shown in silica+cells mice (p<0.05; n=10). Silica-damaged mice receiving fibroblasts or not receiving cells progressively died.


Tables
- Table 1– Oligonucleotides used in real-time PCR assays
Forward Reverse hCXCR4 CTGTGAGCAGAGGGTCCAG ATGAATGTCCACCTCGCTTT hSP-C117 AGTGGAGCCGATGGAGAAG GCAAAGAGGTCCTGATGG hSP-C134 AGCCAGAAACACACGGAGAT AGTGGAGCCGATGGAGAAG hSP-B ATGGTGAAACCCCATTTCTA CAATTGATCAGTTAGGGTGG hOCT-4A CTCCTGGAGGGCCAGGAATC CCACATCGGCCTGTGTATAT hOCT-4B ATGCATGAGTCAGTGAACAG CCACATCGGCCTGTGTATAT hNANOG CAAAGGCAAACAACCCACTT TCTGCTGGAGGCTGAGGTAT hGAPDH CAAATTCCATGGCACCGTCAA CGCTCCTGGAAGATGGTGATG mTNF-α TCTCAAAATTCGAGTGACAAGC ACTCCAGCTGCTCCTCCAC mIL-6 GTTCTCTGGGAAATCGTGGA TTCTGCAAGTGCATCATCGT mMIP-2 GCGCCCAGACAGAAGTCATAG GGCAAACTTTTTGACCGCC mCol1α1 TCAGAGGCGAAGGCAACAGT CCCAAGTTCCGGTGTGA mGAPDH ATGACATCAAGAAGGTGGTG CATACCAGGAAATGAGCTTG h: human; CXCR: CXC chemokine receptor; SP: surfactant protein; OCT: octamer-binding transcription factor; GAPDH: glyceraldehyde-3-phosphate dehydrogenase; m: murine; TNF: tumour necrosis factor; IL: interleukin; MIP: monocyte inflammatory protein; Col1α1: collagen type 1 α1.
- Table 2– Summary of measurements of transepithelial electrical resistance
Days after EB adhesion and expansion on insert Days after differentiation in SAGM Transepithelial electrical resistance Ω·cm2 Experiments n 8 0 163.83±3.83 18 11 3 184.83±5.67** 5 13 5 204.71±5.80# 8 Data are expressed as mean±sem, unless otherwise stated. EB: embryoid body; SAGM: small airway growth medium. **: p<0.01; #: p<0.0001; using unpaired t-test with respect to the values obtained in cells not treated with SAGM.


