


Abstract
The glutathione S-transferase (GST) enzymes catalyse the conjugation of xenobiotics to glutathione. Based on reports that inherited copy number variations (CNVs) modulate some GST gene expression levels, and that the small airway epithelium (SAE) and alveolar macrophages (AMs) are involved early in the pathogenesis of smoking-induced lung disease, we asked: do germline CNVs modulate GST expression levels in SAE and AMs?
Microarrays were used to survey GST gene expression and determine CNVs genotypes in SAE and AMs obtained by bronchoscopy from current smokers and nonsmokers.
26% of subjects were null for both GSTM1 alleles, with reduced GSTM1 mRNA levels seen in both SAE and AMs. 30% of subjects had homozygous deletions of GSTT1, with reduced mRNA levels in both tissues. Interestingly, GSTT2B exhibited homozygous deletion in the blood of 27% of subjects and was not expressed in SAE in the remainder of subjects, but was expressed in AMs of heterozygotes and wild-type subjects, proportionate to genotype.
These data show a germline CNV-mediated linear relationship of genotype with expression level, suggesting minimal compensation of gene expression levels in heterozygotes, consistent with GST polymorphisms playing a role in the risk of smoking-associated, xenobiotic-induced lung disease.
The epithelial surfaces of cigarette smokers are exposed to large amounts of inhaled compounds in an aerosol of 1014 free radicals per puff, 1010 particulates·mL−1 and >4,000 different compounds, including >60 carcinogens [1–4]. The small airway epithelium (SAE; bronchi, more than six generations, <2 mm in diameter) takes the brunt of the exposure to the xenobiotics generated by smoking and is the earliest site of abnormalities that are central to the pathogenesis of chronic obstructive pulmonary disease (COPD) and adenocarcinoma, the most common smoking-associated lung cancer [5–15]. In addition to the small airways, the alveoli are also exposed to the stress of smoking [9, 10, 16, 17]. The alveoli are protected from xenobiotics, in part, by alveolar macrophages (AMs), the lung representative of the mononuclear phenotype systems, which are equipped with the biological armamentarium to engulf particulates and render xenobiotics harmless [16, 18–22]. AMs play an important role in the pathogenesis of smoking-induced disease in the lower respiratory tract [9, 14, 18, 20, 22–28].
As in the other tissues, in airway epithelium and AMs, xenobiotic compounds are enzymatically transformed into a variety of intermediates by phase I and II enzymes, including the glutathione S-transferases (GSTs). GSTs are an evolutionary-conserved family of dimeric phase II metabolic enzymes that catalyse the conjugation of reduced glutathione with electrophilic compounds, such as xenobiotics present in tobacco smoke, as well as other carcinogens and pesticides, and their isoforms are divided into seven classes: α (GSTA), μ (GSTM), π (GSTP), θ (GSTT), ζ (GSTZ), σ (GSTS) and ω (GSTO) [29–34]. Alhough cytosolic GST enzymes are a central part of the lung’s molecular detoxification arsenal, three of these isoenzyme genes, GSTM1, GSTT1 and GSTT2B (a copy of the GSTθ paralogue, GSTT2) are located in regions of the genome susceptible to copy number variations (CNVs), resulting in gene deletion with different frequencies in different populations [35–38]. Compensatory mechanisms may result in tissue-specific effects of CNVs on associated genes’ expression levels [39–41].
Given this background, and with the knowledge that single-nucleotide polymorphisms (SNPs) of GSTM1 and GSTT1 are linked to COPD, accelerated decline in lung function and lung cancer, the present study was undertaken to determine if the presence of known copy number variable regions (CNVRs) in GST isoenzymes results in modifications of GST expression in the SAE and AMs [42–46]. In order to address this issue, SAE and AMs were obtained via bronchoscopy from healthy nonsmokers and healthy smokers and, using microarray and TaqMan RT-PCR (Applied Biosystems, Foster City, CA, USA), assessed for the expression of the GST isoenzymes. Genomic DNA acquired from blood cells of the same individuals was examined by microarray and TaqMan RT-PCR for the presence of CNVs. These data demonstrated that GSTM1 and GSTT1 are significantly expressed in both SAE and AMs, while GSTT2(B) is only expressed in AMs. Importantly, the SAE and AM gene expression levels of GSTM1 and GSTT1 correlate with CNV genotype, while the high frequency gene deletion of GSTT2B correlates with expression of GSTT2 in AMs. In view of the associations of genetic variants of GSTM1 and GSTT1 with COPD and lung cancer, and that these diseases arise in the SAE and AMs principally due to exposure to cigarette smoke, with its heavy xenobiotic burden, the observation that the SAE and AMs of healthy nonsmokers and smokers exhibits CNV-correlated levels of GST expression suggests that the mechanisms underlying the disease associations with GST isoenzymes include CNV-mediated disturbances in gene expression in lung cells.
METHODS
Study population
In response to advertisements, nonsmokers and smokers were evaluated at the Weill Cornell National Institutes of Health Clinical and Translational Sciences Center and Dept of Genetic Medicine Clinical Research Facility under protocols approved by the Weill Cornell Medical College Institutional Review Board (New York, NY, USA). Written informed consent was obtained from each individual before enrolment. Subjects were deemed to be normal and in good health following standard medical history, physical examination, complete blood count, coagulation profile, serum chemistries and liver function testing, urine studies, chest radiograph, ECG, and pulmonary function testing. All were negative for HIV1 and had normal α1-antitrypsin levels (see online supplementary methods for detailed inclusion/exclusion criteria). For the group of nonsmokers (n = 35) and the group of current smokers (n = 35), self-reported smoking status was confirmed by urinary tobacco metabolite levels.
Sampling of the SAE and collection of AMs
SAE (10–12th generation) was collected using flexible bronchoscopy as previously described [47]. Cells were removed from the brush by flicking into 5 mL ice-cold LHC8 medium (GIBCO, Grand Island, NY, USA), with 4.5 mL immediately processed for RNA extraction, and 0.5 mL to determine the number and types of cells recovered. The expression of genes encoding surfactant and Clara cell secretory proteins confirmed the samples were SAE [47, 48].
Bronchoalveolar lavage fluid was also obtained at the time of bronchoscopy, as described previously [49]. Up to a maximum of three sites per individual (right middle lobe, lingula and right lower lobe) were lavaged with a typical volume per site of 100 mL, resulting in a 45–65% return of infused fluid volume. Debris and mucus were removed by filtering the lavage fluid through gauze, after which the fluid was centrifuged at 234×g (1,200 rpm) for 5 min, at 4°C. Cells were washed twice in RPMI 1640 medium containing 10% fetal bovine serum, 50 U·mL−1 streptomycin and 2 mM glutamine (Invitrogen, Carlsbad, CA, USA), and seeded overnight in six-well tissue culture plates (2×10⁶ cells in 2 mL medium per well) at 37°C in a 5% CO2 humidified incubator. The next day, nonadherent cells were gently removed and cell viability was assessed by Trypan blue exclusion, expressed as a percentage of the total number of recovered cells that were counted in a haemocytometer. Cell differentials were quantified on sedimented cells following cytocentrifugation and the remainder was processed for RNA extraction.
RNA extraction and preparation for microarray
Analyses were performed using the Affymetrix HG-U133 Plus 2.0 microarray (Affymetrix, Santa Clara, CA, USA). Total RNA was extracted from cells using TRIzol reagent (Invitrogen), and residual DNA was removed using the RNeasy MinElute RNA purification kit (Qiagen, Valencia, CA, USA), yielding 2–4 μg RNA per 106 cells. In order to visualise and quantify the degree of RNA integrity, an aliquot of each sample of RNA was analysed with the Agilent Bioanalyzer (Agilent Technologies, Santa Clara, CA, USA). The concentration was determined using a NanoDrop ND-1000 spectrophotometer (NanoDrop Technologies, Wilmington, DE, USA) and the samples stored in RNA Secure (Ambion, Austin, TX, USA). The GeneChip One-Cycle cDNA synthesis kit was used to create double-stranded cDNA from 3 μg total RNA, followed by a clean-up step using a GeneChip Sample Cleanup Module. In vitro transcription was next performed using a GeneChip IVT Labeling Kit, followed by additional clean-up and quantification of the biotin-labelled copy (c)RNA yield using a spectrophotometer (all reagents from Affymetrix). In accordance with Affymetrix protocols, the test microarrays were first hybridised and, if quality control was acceptable, hybridisation to the gene expression chips was then performed, followed by processing by the Affymetrix GeneChip Fluidics Station 450, and scanning with an Affymetrix GeneChip Scanner 3000 7G. The strict quality control measures employed included ensuring: 1) RNA quality, assessed as RNA integrity number >7.0; 2) cRNA transcript integrity, assessed by signal intensity ratio of glyceraldehyde-3-phosphate dehydrogenase (GAPDH) 3′ to 5′ probe sets ≤3.0; and 3) multi-chip scaling factor ≤10.0 [50].
Microarray data analysis and statistics
The Microarray Suite version 5.0 algorithm from Affymetrix was used to analyse captured images. GeneSpring version 7.3 software (Agilent Technologies) was used to normalise data as follows: 1) per microarray, by dividing raw data by the 50th percentile of all measurements on the individual array; and 2) per gene, by dividing the raw data by the median expression level for all of the genes across all of the arrays in a given dataset. In the current hypothesis-driven study, GSTM1, GSTT1 and GSTT2B were pre-selected for consideration on the basis that they are known to be affected by copy number polymorphisms from a review of the literature, and not on the basis of a global analysis of transcriptomic data or genome-wide genetic variation data. For each of these three pre-specified genes, the gene’s expression levels, as provided by microarray, were compared to the measurement of their specific gene copy number, as assessed by SNP microarray. Correction for false discovery from multiple testing was therefore not performed in the current study. Because equal variance of gene expression among each CNV grouping was not uniformly present, statistical testing for association between copy number and expression levels was performed with a Kruskal–Wallis test for nonparametric data. Correlations of gene expression level with CNV genotypes were performed using a Kendall τ rank correlation coefficient test. Correlations of gene expression levels for pairs of genes were calculated using Spearman’s rank correlation. Statistical analyses were carried out using StatView version 5.0 (SAS Institute Inc., Cary, NC, USA). All microarray data has been deposited at the Gene Expression Omnibus site (accession number 20250).
Assessment of CNVs in genomic DNA
DNA was extracted from blood samples obtained from the study population using the Autogen FX robotic system in accordance with the manufacturer’s protocols (Autogen, Holliston, MA, USA). In order to minimise handling errors, pre-printed bar-coded labels were used and critical steps in the processing of samples were performed with two technicians present. The Affymetrix Human SNP Array 5.0 was used to examine the genomic DNA for CNV regions using Partek Genomics Suite software version 6.4 (Partek Inc., St Louis, MO, USA). Multiple SNP arrays were loaded with data normalised by array to ensure comparable probe intensities relative to a HapMap subject. Search parameters (p<0.00001, >10 probe sets, fold-change 1.7–2.3 and signal/noise ratio ≥0.5) were chosen to allow detection of CNVs in chromosomes harboring cytosolic GST genes. As an additional confirmation of a given CNV call at a given locus, probe intensities of two of the largest CNV probe sets located within the boundaries of the relevant gene and the overlapping reported CNV region according to the Database of Genomic Variants [51] were plotted against each other for the entire study population, in order to examine concordance with Partek calls.
TaqMan RT-PCR confirmation of microarray expression levels and copy number calls
For gene expression confirmation, cDNA was synthesised from 2 μg RNA in a 100-μL reaction volume using the TaqMan Reverse Transcriptase Reaction Kit (Applied Biosystems), using random hexamers as primers. Triplicate wells were run for each of two dilutions of each sample (1:50 and 1:100). TaqMan PCR reactions were performed using pre-made kits (Applied Biosystems) and for each 25-μL reaction volume, 2 μL cDNA was used. 18S ribosomal (r)RNA served as an endogenous control and relative expression levels were determined using the ΔΔCt method (Applied Biosystems), with the average value for the nonsmokers as the calibrator. The rRNA probe was labeled with VIC dye and the probe for the gene of interest was labelled with FAM (6-carboxyfluorescein), and reactions were run in an Applied Biosystems 7500 Sequence Detection System.
For copy number call confirmation, genomic DNA from individuals of known CNV genotype (based on Partek microarray analysis) was extracted and purified using a commercial kit, and quantified using the TaqMan RNase P method (Applied Biosystems). DNA samples were diluted to 5 ng·μL−1 with 1× Tris–EDTA buffer, pH 8.0. Samples labeled with FAM were run against a DNA sample of known copy number for the GST gene of interest, which was used as a calibrator reference (labeled with VIC), together with a no-template control, to allow detection of contamination and background fluorescence. rRNA was used as the internal control (Human Ribosomal RNA Kit, Applied Biosystems). Reactions were carried out using gene-specific TaqMan Copy Number Assays in accordance with the manufacturer’s protocols (Applied Biosytems) and run in the 7500 Sequence Detection System. CopyCaller™ Software (Applied Biosystems) was used to make the CNV calls.
RESULTS
Study population and sampling
SAE from healthy nonsmokers (n = 35) and healthy smokers (n = 35), and AMs from healthy nonsmokers (n = 22) and healthy smokers (n = 34) were analysed. All subjects were deemed to be healthy based on: no significant prior medical history; a normal physical examination; and unremarkable urine studies, serum chemistries, radiology and pulmonary function studies ([table 1 and online supplementary methods). For all subjects, no significant differences were observed between the two groups (nonsmokers versus smokers) with respect to age (p>0.8, pairwise t-test), sex (p>0.1, Chi-squared test) and ancestry (p>0.2, Chi-squared test). The combined smokers had a mean±sd smoking history of 24±13 pack-yrs and their self-reported smoking status was confirmed in all cases by urinary tobacco metabolite levels. SAE samples of both nonsmokers and smokers contained ∼6×10⁶ cells of >99% purity, with cell types typical for the SAE. There was no significant difference in the relative proportions of these airway epithelial subtypes recovered between the two groups of subjects (p>0.05) with the exception of a greater proportion of undifferentiated columnar cells in smokers (p<0.001). Characteristic morphological appearances of both airway epithelium and macrophages were confirmed by microscopy of cytospin preparations from the brushings and cells recovered by lavage, respectively. Approximately twice as many AMs were recovered from the lavage samples of smokers versus nonsmokers (31.2×10⁶ versus 14.1×10⁶ AMs respectively; p<0.005) while the total numbers of other cell types were similar between the two groups (p>0.1).
Expression of GST genes in SAE and AMs
Using an expression criterion of having an Affymetrix detection call of “present” in ≥50% of either the nonsmoker or smoker samples, significant expression of all known cytosolic GST genes was observed in SAE of healthy nonsmokers and healthy smokers (all subjects combined) with the exceptions of GSTM5 and GSTT2 (fig. 1a). Similarly, in the case of AMs, expression was assessed by microarray, and significant expression of all GST genes was seen in nonsmokers and smokers, except for GSTM5, GSTA3 and GSTO2 (fig. 1b). Using the Affymetrix “P” call criteria, of the three GST isoenzyme genes known to be deleted by CNV polymorphisms (GSTM1, GSTT1 and GSTT2), two (GSTM1 and GSTT1) were significantly expressed in the SAE and all three were significantly expressed in AMs. All of the GST genes indicated as being expressed in figure 1 were expressed when nonsmokers and smokers were considered as two separate groups.
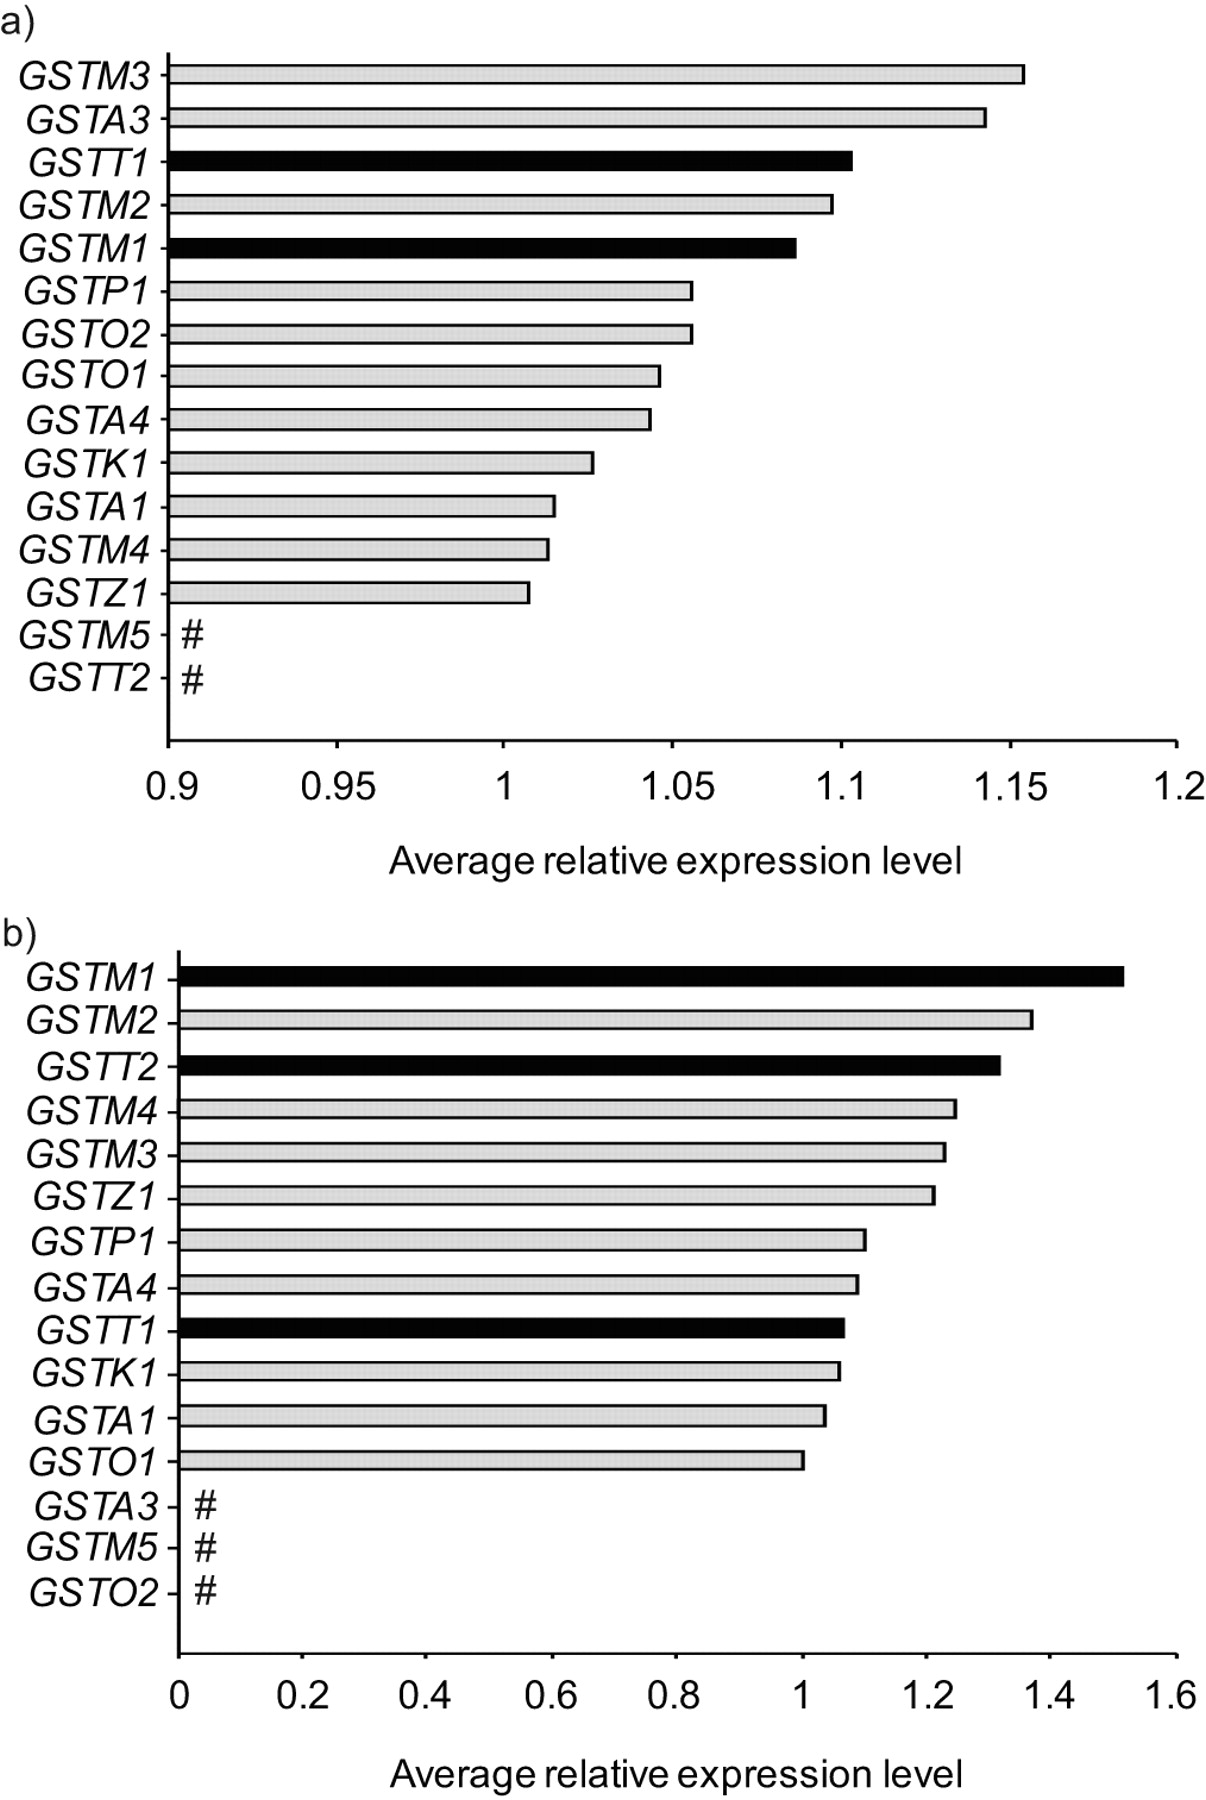
Expression of cytosolic glutathione S-transferase (GST) subtypes in human small airway epithelium (SAE) and alveolar macrophages (AMs) for the total study population. a) Relative average gene expression levels of GST isoenzymes in SAE of healthy nonsmokers (n = 35) and healthy smokers (n = 35). b) Relative average gene expression levels of GST isoenzymes in AMs of healthy nonsmokers (n = 22) and healthy smokers (n = 34). All cytosolic GSTs are shown on the ordinate axis. The Affymetrix HGU133 Plus 2.0 microarray has no specific probeset for GSTT2B, a duplicate gene of GSTT2, and therefore is not shown. ▪: GST subtypes known to be affected by common (>5% frequency) heritable copy number variation. #: not expressed.
GSTM1 CNV and correlation with SAE gene expression
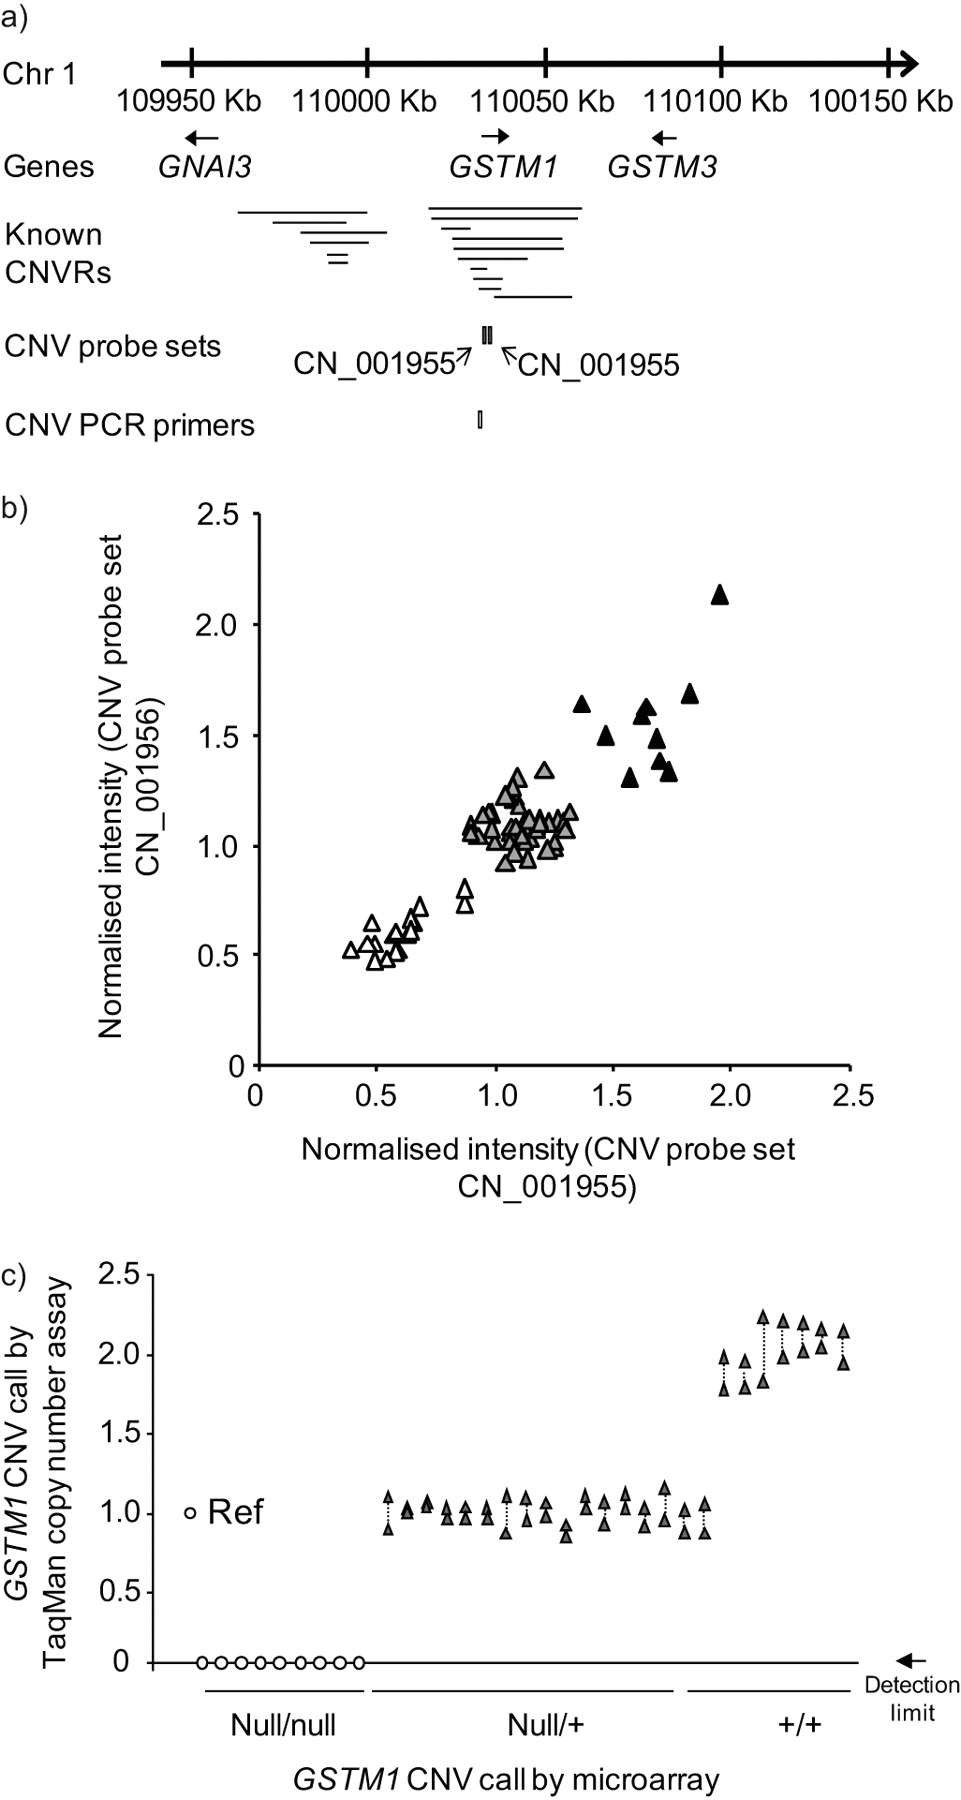
In order to establish which of the study subject samples had evidence of heritable copy number polymorphisms in the GSTM1 gene, genomic DNA from the entire population of 35 healthy nonsmokers and 35 healthy smokers was hybridised to Affymetrix Human SNP Array 5.0 chips to determine GSTM1 copy number (fig. 2a and b). The data demonstrated that 10 subjects (14%) had the wild-type diploid copy number for GSTM1, 42 subjects (60%) were heterozygotes and 18 subjects (26%) were homozygous for the gene deletion. For a random subset of these subjects, CNV genotypes were confirmed by TaqMan RT-PCR (fig. 2c). For an overview of the frequency of the null allele for GSTM1 and the other GST genes studied in detail, see table 2.

Identification of heritable GSTM1 copy number variation (CNV). a) Region of human chromosome (Chr) 1 showing the genomic location of the GSTM1 gene in relation to independently reported copy number variable regions (CNVRs) in the Database of Genomic Variants [51]. The relative chromosomal locations of two Affymetrix Human SNP 5.0 CNV probe sets and an Applied Biosystems TaqMan RT-PCR probe for GSTM1 CNV are shown below the lines identifying the known CNVs. b) GSTM1 CNV genotypes by microarray analysis. Normalised intensity levels from the entire study population (n = 70) of the two CNV probe sets indicated in a) are plotted on the abscissa and ordinate axes. Individuals homozygous null for the GSTM1 CNV (▵), heterozygotes (▴) and wild type diploid individuals (▴) are as shown. c) PCR correlation with microarray analysis of GSTM1 genotypes, assessed by TaqMan PCR. Represented on the abscissa are the are the TaqMan RT-PCR assays for the GSTM1 CNV using the primers shown in a) in a random subset of subjects (n = 33) of known GSTM1 genotype (null/null: homozygous null; null/+: heterozygous; +/+: diploid wild type) based on microarray results. One reference haploid subject (Ref) is shown left-most, with TaqMan-derived copy number calls on the ordinate. Null/null individuals had a RT-PCR product below the detection limit, as indicated. Duplicate measurements for each subject are shown, linked by dotted lines.
In order to assess the association of the GSTM1 CNV genotype with SAE GSTM1 gene expression, SAE microarray gene expression data from the same 70 individuals who were genotyped was examined for correlations between genotype and expression level (fig. 3). The association of GSTM1 gene expression with GSTM1 CNV genotype was seen in different GSTM1 probe sets (p<0.001 for both probe sets determined by Kruskal–Wallis analysis), and GSTM1 SAE expression level was verified in a random subset of individuals by TaqMan RT-PCR (fig. 3a and b). In order to identify potentially spurious associations of genotype with expression, the assessment included two genes flanking GSTM1 but not located within regions known to be copy number variable, GNAI3 and GSTM3. The data show that, while SAE GSTM1 gene expression level was positively correlated with increasing GSTM1 copy number (p<0.001; τ = 0.404), neither GNAI3 (p>0.8; τ = 0.020) nor GSTM3 (p>0.7; τ = 0.039) were correlated with GSTM1 CNV genotype (fig. 3c–e). TaqMan RT-PCR verified the lack of association of SAE expression level of the flanking gene GSTM3 with GSTM1 CNV genotype (p>0.3; data not shown).
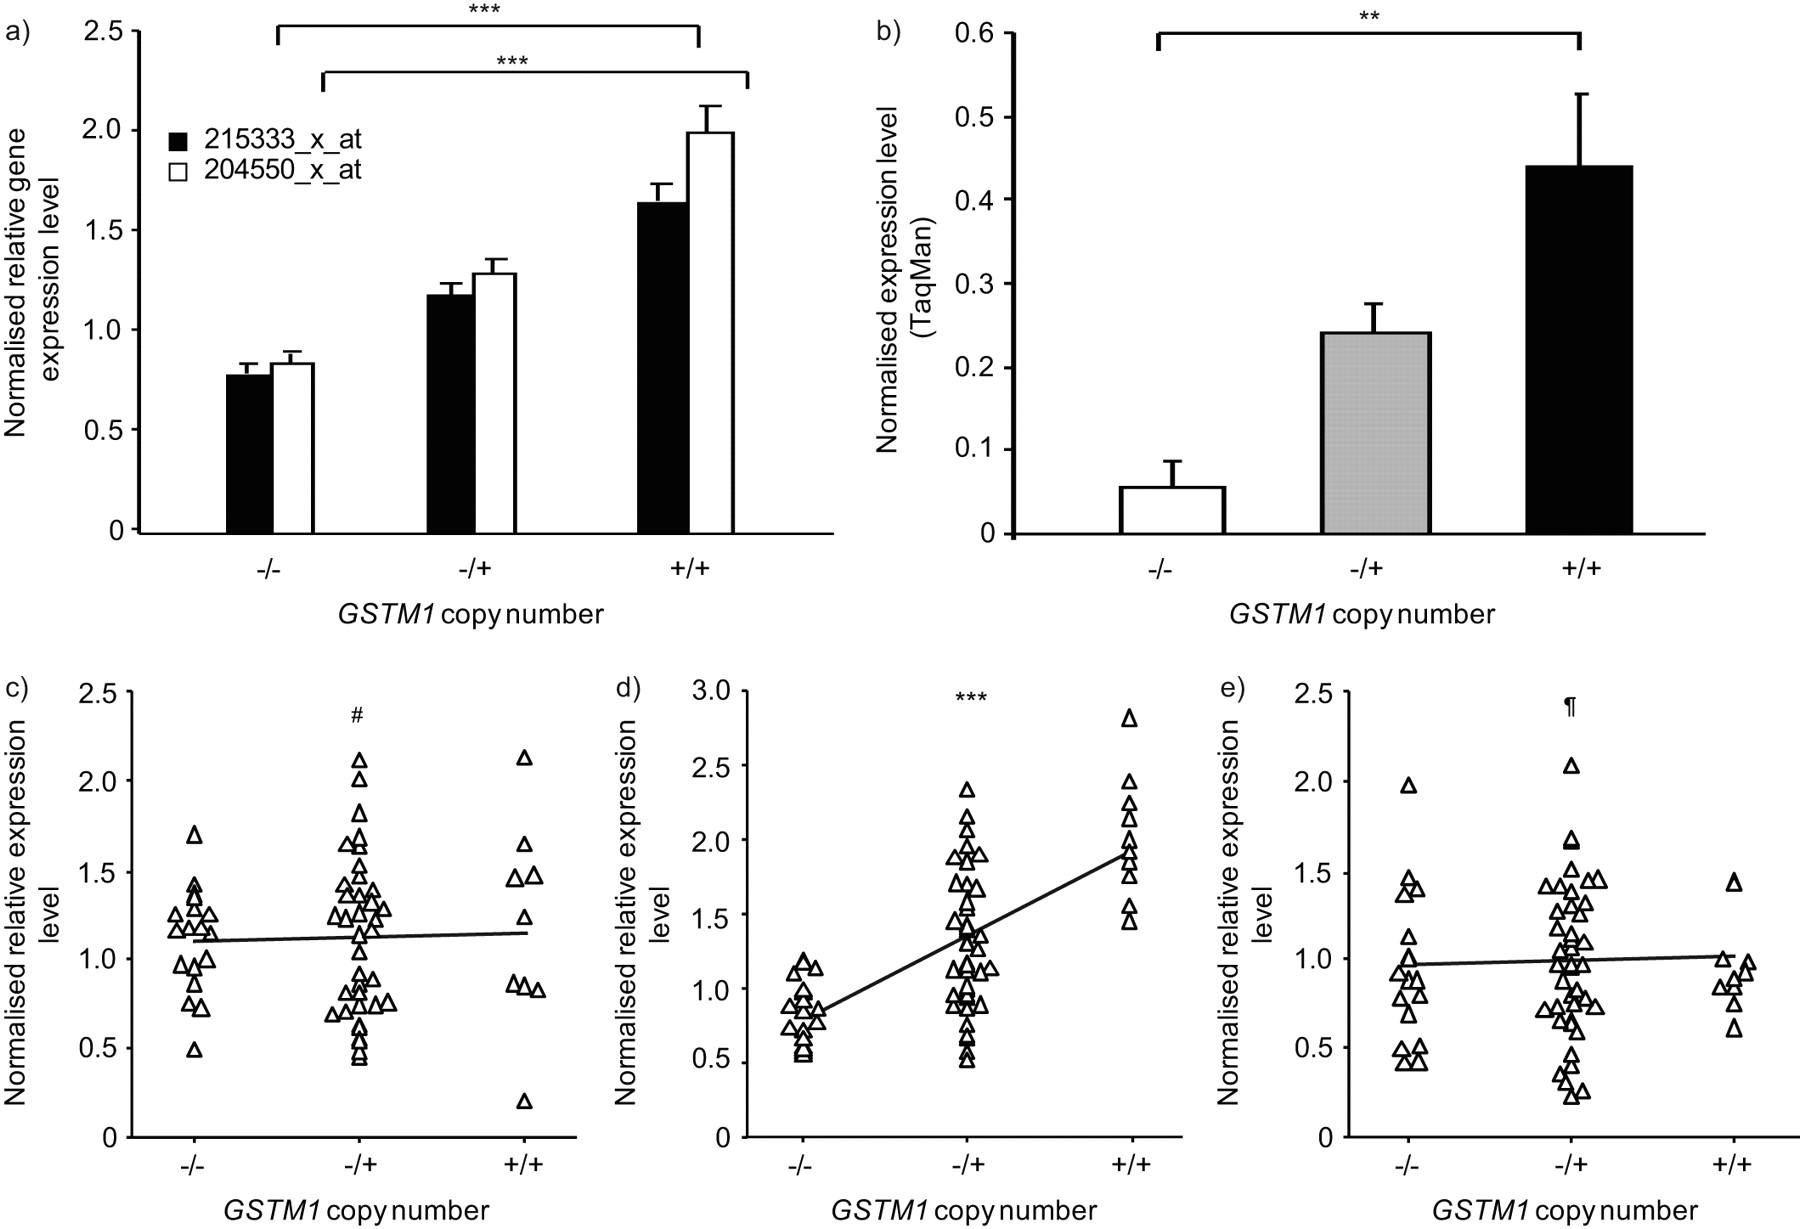
Correlation of small airway epithelium (SAE) gene expression levels with GSTM1 copy number variation (CNV) genotype. a) Microarray analysis. GSTM1 CNV genotype is plotted against normalised average gene expression level for the two indicated Affymetrix GSTM1 expression probe sets (healthy nonsmokers, n = 22; healthy smokers, n = 34). p-values represent Kruskal–Wallis tests. Data are presented as mean±se. b) TaqMan RT-PCR. The normalised average expression level by TaqMan RT-PCR is shown on the ordinate axis for incremental GSTM1 copy number, for a random subset of individuals (n = 22). p-value represented Kruskal–Wallis test. Data are presented as mean±se. c–e) Comparisons of GSTM1 CNV genotypes versus SAE gene expression levels. The three plots show GSTM1 copy number on the abscissa versus normalised relative gene expression levels on the ordinate, for c) GNAI3, d) GSTM1 and e) GSTM3, in the total study population (n = 70). Kendall τ rank correlation p-values are as shown. #: p>0.8; ¶: p>0.7; **: p<0.01; ***: p<0.001.
GSTT1 CNV and correlation with SAE gene expression
For the copy number-variable GST isoenzyme gene GSTT1, a similar approach to that used for GSTM1 was employed in order to establish whether or not heritable GSTT1, CNVs were present in the same study population of 35 healthy nonsmokers and 35 healthy smokers (fig. 4). By microarray analysis, the data revealed that 22 subjects (31%) possessed the wild-type diploid number of GSTT1 gene copies, 27 subjects (39%) were heterozygotes and 21 individuals (30%) had no copy of GSTT1 in their blood genome (fig. 4a and b). The CNV genotypes identified by microarray were confirmed in a random subset of subjects using TaqMan RT-PCR, with 100% concordance (fig. 4c).

Identification of heritable GSTT1 copy number variation (CNV). a) Region of human chromosome (Chr) 22 showing the genomic location of the GSTT1 gene in relation to independently reported copy number variable regions (CNVRs) in the Database of Genomic Variants [51]. The relative locations of two Affymetrix Human SNP 5.0 CNV probe sets and an Applied Biosystems TaqMan RT-PCR primer for GSTT1 CNV are shown below the lines identifying the known CNVs. b) CNV genotypes by microarray analysis. Normalised intensity levels from the study population (n = 70) of the two CNV probe sets indicated in a) are plotted on the abscissa and ordinate axes. Subjects homozygous null for the GSTT1 CNV (▵), heterozygotes (▴) and homozygous wild-type individuals (▴) are as shown. c) Correlation of PCR-assessed GSTT1 CNV genotypes to microarray assessment. TaqMan RT-PCR assays for the GSTT1 CNV using the probe shown in a), in a random subset of subjects (n = 31) of microarray-defined GSTT1 genotypes (null/null: homozygous null; null/+: heterozygous; +/+: diploid wild type) are represented on the abscissa. The reference haploid subject (Ref) is shown on the left, with copy number calls by RT-PCR on the ordinate. Null/null individuals had an RT-PCR product below the detection limit, as indicated. Duplicate measurements are shown for each subject, linked by dotted lines.
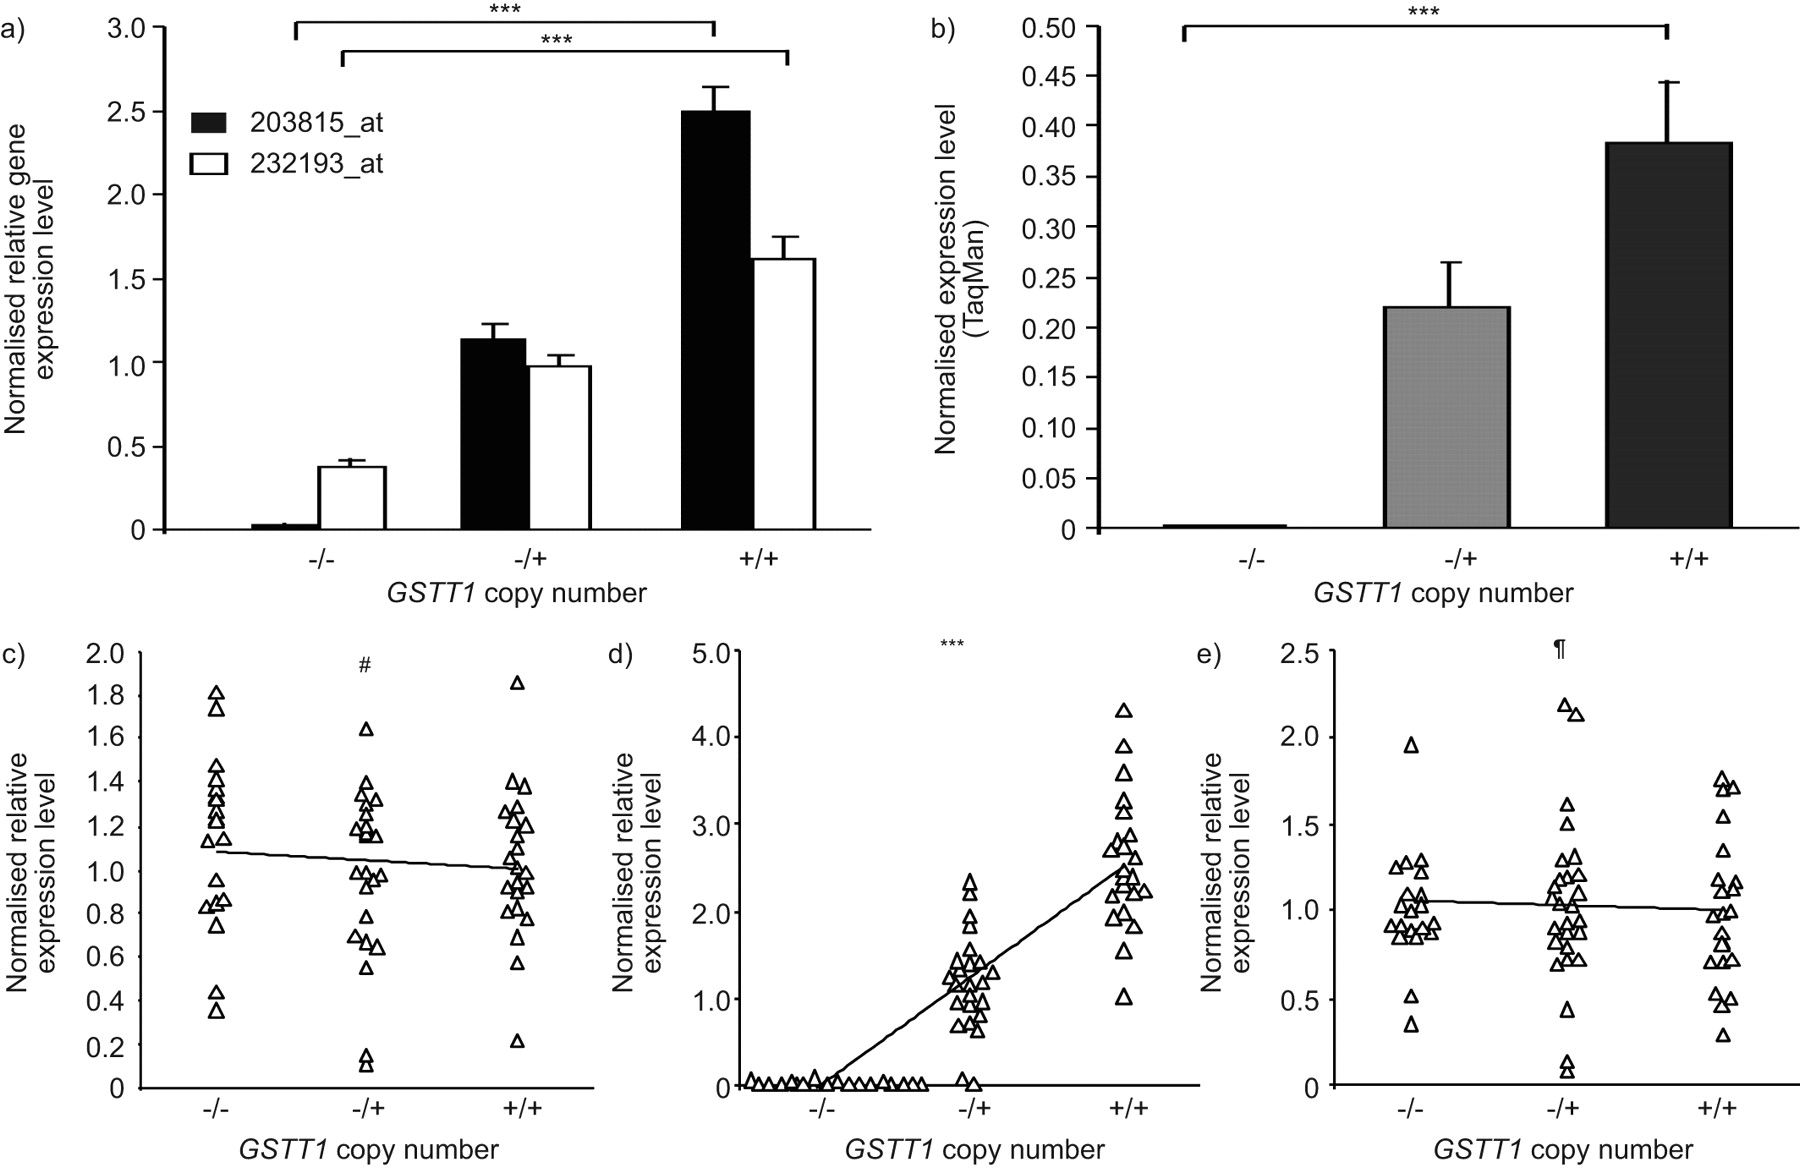
In order to investigate the association of GSTT1 CNV genotype with the GSTT1 expression level in SAE, gene expression microarray probe sets specific to GSTT1 were correlated with the identified GSTT1 CNV genotype in the total population of 70 individuals. The nearby flanking genes, MIF and ADORA2A, were also examined for potential correlation with GSTT1 CNV genotype, as they are not known to be located within the CNVR surrounding GSTT1 (fig. 4a). The data showed that GSTT1 SAE expression levels were directly proportional to the copy number of GSTT1, with highest expression levels in the wild-type subjects, intermediate levels in the heterozygotes and lowest levels of GSTT1 in the homozygous null individuals (fig. 5a; p<0.001 and p<0.001, respectively, for two different probe sets, based on Kruskal–Wallis testing). The correlation of GSTT1 gene expression and copy number was confirmed in a random subset of individuals by RT-PCR (fig. 5b; p<0.001 comparing homozygous nulls with wild types). No correlation was seen between gene expression levels of flanking genes and GSTT1 CNV genotype (fig. 5c–e; ADORA2A p>0.5, τ = -0.044; MIF p>0.3, τ = -0.082); however, there was a strong correlation of GSTT1 expression level in SAE with GSTT1 CNV genotype (fig. 5c; p<0.001, τ = 0.631). TaqMan RT-PCR confirmed no association of MIF expression levels with GSTT1 CNV genotypes (p>0.5; data not shown).

GSTT1 copy number variation(CNV) genotype versus small airway epithelium gene expression. a) For each of the two indicated Affymetrix GSTT1 gene expression probe sets, GSTT1 CNV genotype is plotted against normalised average gene expression level on the ordinate axis. p-values represent Kruskal–Wallis tests. Data are presented as mean±se. b) The normalised average expression level by TaqMan RT-PCR is shown on the ordinate versus GSTT1 copy number, for a random subset of individuals (n = 24). p-value represents Kruskal–Wallis test. Data are presented as mean±se. c–e) GSTT1 copy number versus c) MIF, d) GSTT1 and e) ADORA2A normalised relative expression levels, in the total study population (n = 70). Kendall  rank correlation p-values are shown. #: p>0.3; ¶: p>0.5; ***: p<0.001.
GSTM1 and GSTT1 CNV, and correlation with AM gene expression
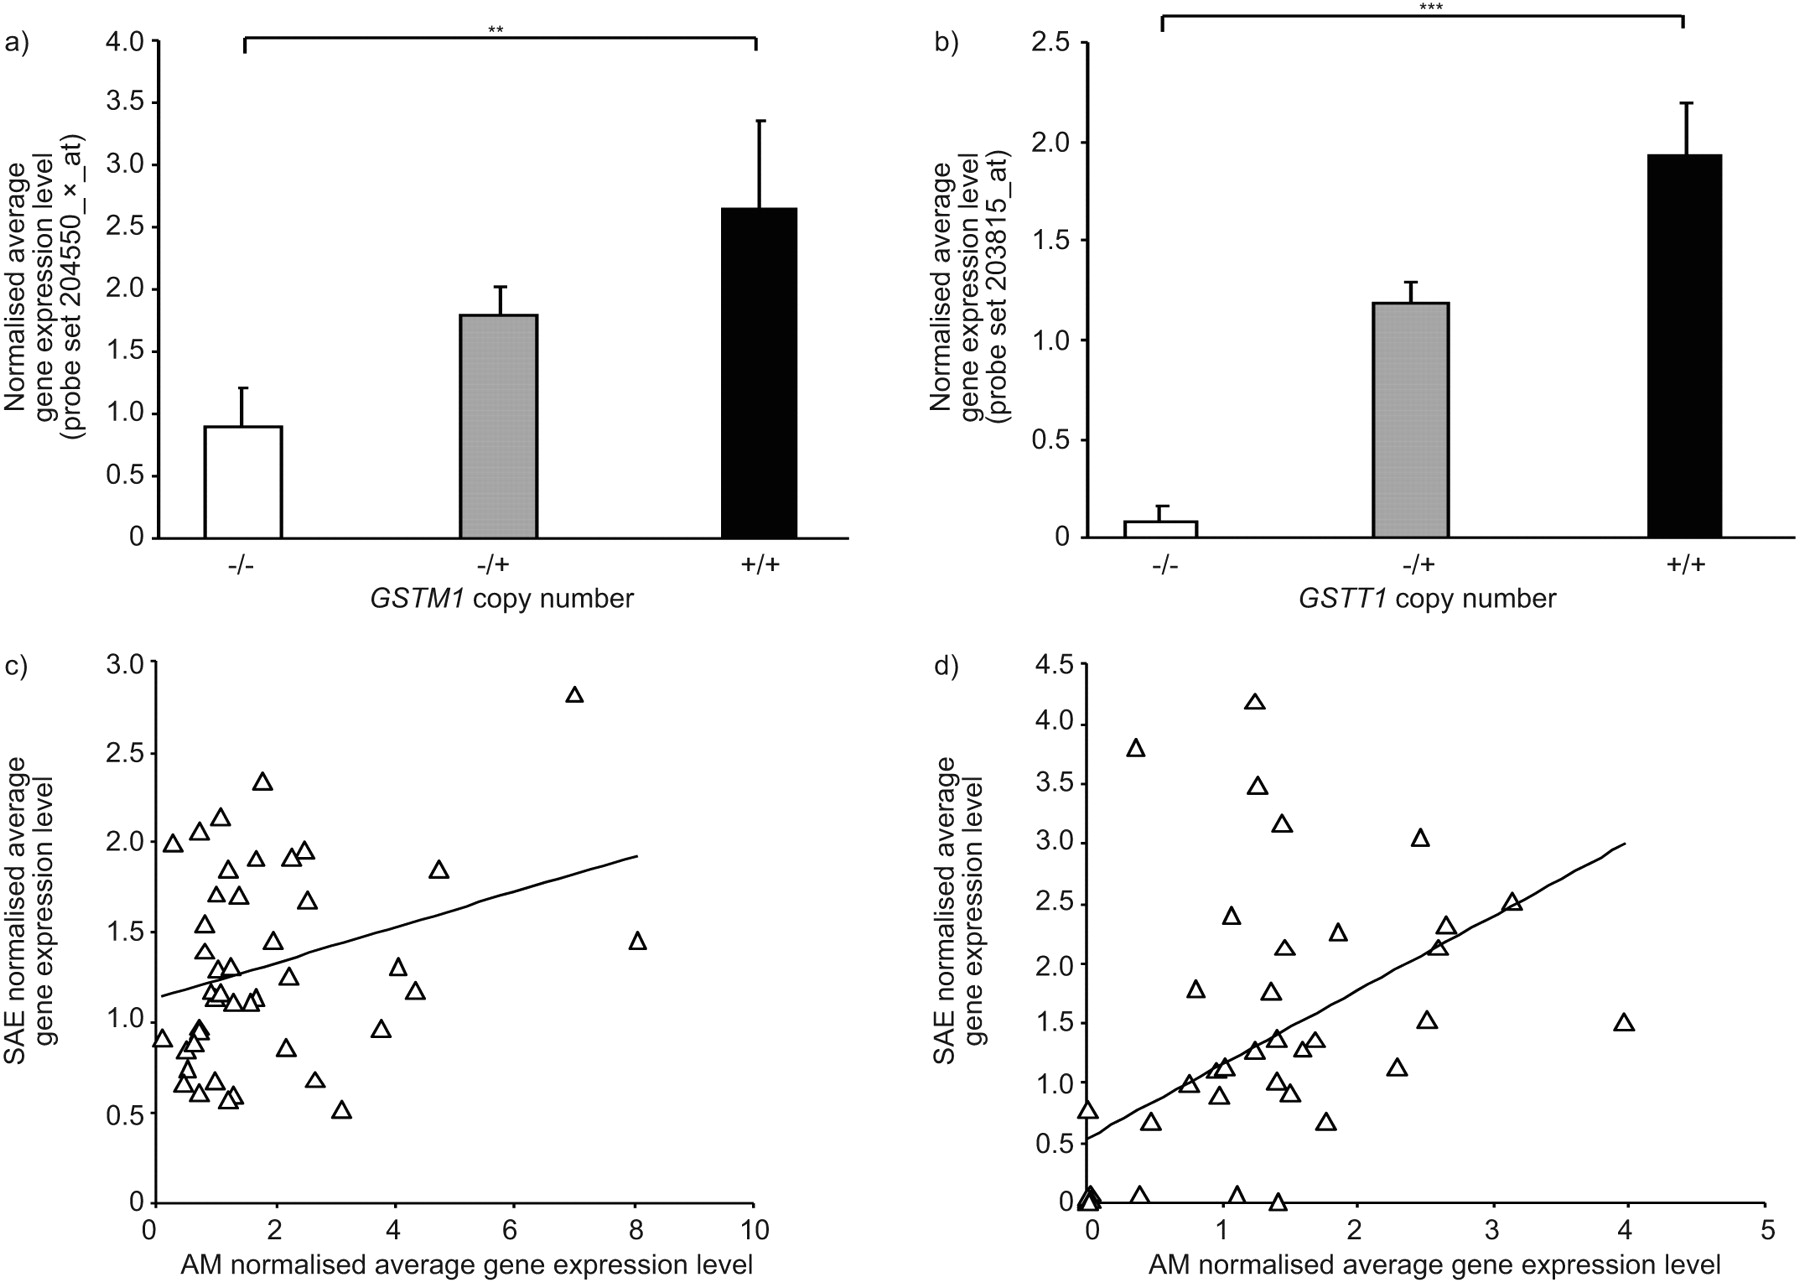
For the purpose of investigating potential correlations of GSTM1 and GSTT1 CNV genotypes with the GSTM1 and GSTT1 expression levels in another lung cell type, microarray gene expression data of AMs (22 healthy nonsmokers and 34 healthy smokers), were assessed as for the SAE. Similarly to what was observed in the SAE, GSTM1 AM gene expression levels were positively correlated with GSTM1 copy number (fig. 6a; p<0.01 by Kruskal–Wallis test). GSTT1 CNV genotypes were also directly proportional to GSTT1 gene expression level in the AM samples (fig. 6b, p<0.001 by Kruskal–Wallis test). There was poor correlation of GSTM1 gene expression levels within individuals between SAE and AM samples (r2 = 0.09), and a stronger corresponding, but still weak, correlation (r2 = 0.28) for GSTT1 (fig. 6c and d).

Correlation of GSTM1 and GSTT1 gene expression levels in alveolar macrophages (AMs) with copy number variation (CNV) genotype. a) GSTM1 gene expression levels versus GSTM1 CNV status. Average normalised gene expression levels in AMs for GSTM1, as assessed using microarrays, are shown on the ordinate axis, versus GSTM1 genotype from healthy nonsmokers (n = 22) and healthy smokers (n = 34). p-value represents Kruskal–Wallis test. Data are presented as mean±se. b) GSTT1 gene expression levels versus GSTT1 CNV status. AM average normalised gene expression levels of GSTT1 are shown on the ordinate for each of the indicated GSTT1 CNV genotype groups. p-value represents Kruskal–Wallis test. Data are presented as mean±se. c) GSTM1 expression in SAE versus AMs. Average normalised microarray gene expression levels in AMs is plotted against SAE gene expression for the same individuals (n = 43). r2 = 0.093. d) GSTT1 expression in SAE versus AMs. Average normalised microarray gene expression levels in AMs is plotted against SAE gene expression for the same individuals (n = 43). r2 = 0.280. **: p<0.01; ***: p<0.001.
GSTT2B CNV and correlation with GSTT2 AM gene expression
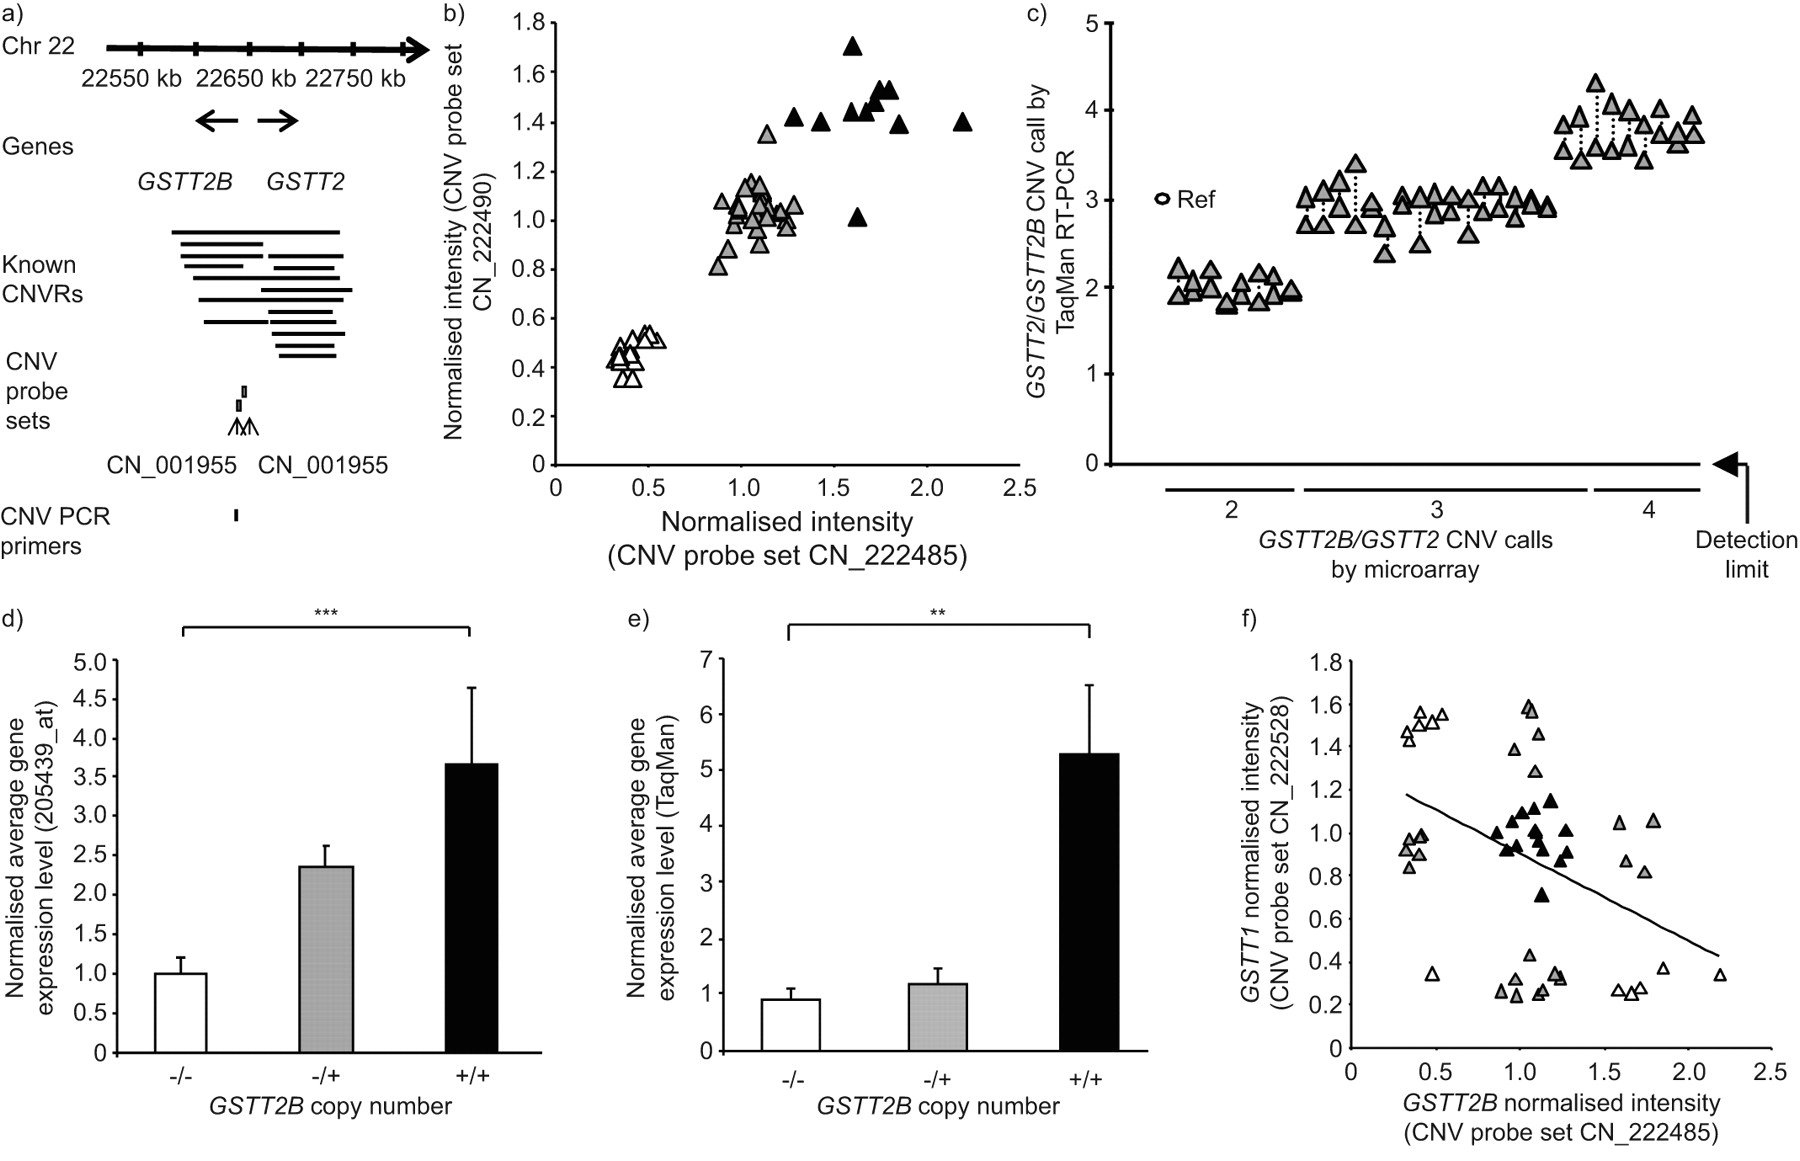
GSTT2B has also been recently described to manifest a common heritable CNV [38]. The Affymetrix probe set for GSTT2 (there is no specific GSTT2B probe set) was expressed in SAE in <50% of subjects by “P” call, and was therefore not examined further in this cell type. However, the prevalence of GSTT2B CNV correlated with AM gene expression levels in the study population of 22 healthy nonsmokers and 34 healthy smokers. The data revealed that 12 individuals (21%) were wild types with two copies of GSTT2B, 29 subjects (52%) were heterozygous for the gene deletion and 15 subjects (27%) were homozygous nulls (fig. 7a and b). The GSTT2B CNV calls of the microarray data was confirmed for a random subset of individuals using TaqMan RT-PCR, with >93% concordance, using custom-designed primers and probes that detect both GSTT2B and GSTT2 (fig. 7c).
Identification of genomic GSTT2B copy number variation (CNV) and correlation with gene expression in alveolar macrophages. a) Region of human chromosome (Chr) 22 showing the genomic location of the GSTT2 and GSTT2B genes in relation to independently reported copy number variable regions (CNVRs) in the Database of Genomic Variants [51]. The relative locations of two the Affymetrix Human SNP 5.0 CNV probe sets and an Applied Biosystems TaqMan RT-PCR primer for GSTT2 CNV are shown below the lines identifying the known CNVs. b) GSTT2B CNV genotype assessed by microarray. Normalised intensity levels of the two GSTT2B CNV probe sets shown in a) are plotted against each other. Those subjects who are homozygous null for the GSTT2B CNV (▵), heterozygotes (▴) and individuals with two gene copies (▴) are shown. c) GSTT1/GSTT2 CNV genotypes. TaqMan confirmation of the CNV calls made by microarray, in a random subset of individuals (n = 33), is shown. A reference haploid subject (Ref) is shown against whom other individuals of microarray-defined genotype were assessed, with RT-PCR copy number on the ordinate. The custom-designed RT-PCR primers and probe used were specific to both GSTT2 and GSTT2B. Data points for duplicate measurements are shown, linked by dotted lines. d) GSTT2 alveolar macrophage (AM) gene expression versus GSTT2B CNV status. Normalised average GSTT2 gene expression level, as assessed by microarray on the ordinate, for healthy nonsmokers (n = 22) and healthy smokers (n = 34) of known GSTT2B CNV genotypes as indicated on the abscissa. p-value represents Kruskal–Wallis test. Data are presented as mean±se. e) GSTT2 TaqMan conformation of expression in AMs. TaqMan confirmation of AM GSTT2 gene expression level in a random subset of individuals of known GSTT2B genotype, as shown on the abscissa. The ordinate shows the average normalised GSTT2 expression level. p-value represents Kruskal–Wallis test. Data are presented as mean±se. f) Concordance of CNV genotype for GSTT2B and GSTT1. Microarray-defined GSTT1 and GSTT2B CNV probe set intensity levels were plotted against each other. Subjects within each of the nine possible genotype combinations are shown in alternating shades for clarity. There is a trend, but only a minor correlation (r2 = 0.188). **: p<0.01; ***: p<0.001.
The TaqMan RT-PCR expression data using AM mRNA for the flanking gene MIF, which lies outside the GSTT2B CNV region, demonstrated no correlation with GSTT2B CNV genotype (data not shown). However, in the case of both the gene expression microarray probe set for GSTT2 and a TaqMan RT-PCR assay, AM GSTT2 gene expression levels correlated positively with GSTT2B copy number (fig. 7d and e; p<0.001 and p<0.01, respectively, by Kruskal–Wallis test). Despite the proximity of GSTT1 and GSTT2B to one another (within 64 kb), within the boundaries of known CNVs on chromosome 22, there was a poor correlation between CNV genotypes of GSTT1 and GSTT2B, with only one subject being homozygous null for both deletions and no subject having both wild type genes (r2 = 0.19; fig. 7f).
For all of the observed associations of GST isoenzyme copy number with gene expression levels in the present study, there was no significant effect of potential confounding factors, including when parsed by smoking status, with the exception of a higher pack-yr smoking history in the individuals that were heterozygous for the GSTM1 gene deletion when only the AM subject subpopulation was examined (p = 0.03; table 3).
DISCUSSION
Smoking places a tremendous xenobiotic burden on the SAE and AMs [1–28]. As with other cell types that express the GST, these lung cells attempt to biotransform such compounds into innocuous chemicals [29–34]. Based on the knowledge that some members of the GST family have a high frequency of gene deletion mediated by germline CNV polymorphisms [35–38], the present study asked the question: do germline CNVs influence SAE and AM gene expression levels of GST subtypes? Through the use of microarray analyses, the data demonstrate that GSTM1 and GSTT1 are expressed in both SAE and AMs, while GSTT2 is expressed only in AMs. The expression levels of these GST genes were modulated by the CNV genotype, with increasing gene copy number resulting in increased gene expression levels, as evidenced using different gene expression probe sets for each gene and/or confirmed by TaqMan RT-PCR. There was no strong evidence of any compensation at a mRNA level for the reduced gene dosage seen in subjects heterozygous for GST gene deletions; in all three cases, gene expression levels generally appeared to fall, in a linear manner, with falling gene copy number. None of these observations was attributable to effects of age, sex, smoking status, pack-yrs or genetic ancestry. Together, these observations suggest that in cells that are confronted by the sustained xenobiotic insult of cigarette smoke, GST genes known to play a key role in xenobiotic biotransformation are negatively regulated by highly prevalent, heritable CNV polymorphisms, with a generally linear relationship between gene dose and gene expression, carrying implications for smoke-induced lung disease pathogenesis.
CNVs and gene expression
CNV polymorphisms, operationally defined as genomic gains or losses of ≥1 kb, cover as much as 12% of the human genome and will probably turn out to be even more widespread within the genome, as the resolution of the platforms used to identify CNVs improves [40, 53]. Most data available on CNV polymorphisms are from the mouse and rat, in which transcripts are over-represented in differentially expressed genes compared with ubiquitously expressed “housekeeping” genes [39, 41, 54]. Overall, a weak positive correlation was observed in these animal studies between relative gene expression level and gene copy number, driven by strong correlations in less than a third of these CNV-associated genes. For approximately two-thirds of CNV-associated genes, the number of gene copies had no effect on relative expression levels in any of several tissues examined. Furthermore, the expression of some genes correlated with gene dosage in some tissues but not in others, implying gene dosage compensation and tissue-specific responses to CNV [39, 41, 54]. Dosage compensation mechanisms have been observed for many genes, and postulated mechanisms proposed include inverse dosage effects and incomplete inclusion of regulatory elements in the gene deletion event [39, 54–56]. Examples of tissue-specific gene dosage effects of CNV observed in mice include Rshl2a/b and Sirbp1 [39, 40]. Another source of added complexity is the increasing evidence of common somatic mosaicism for CNV in different organs and tissues from the same individual [57–59].
For these reasons, the present study was carried out to establish the gene dosage effect of common germline CNVs for GST genes, which are associated with smoke-induced lung diseases, such as COPD and lung adenocarcinoma, in cells that are relevant to the smoke-induced lung diseases, such as SAE and AMs [5–28]. Perhaps surprisingly, given the importance of these GST isoenzymes and the above observations, we found no convincing evidence of dosage compensation for these common CNVs at the mRNA level. This finding argues more strongly towards the relevance of these gene deletions to xenobiotic-associated lung disease, where no compensatory mechanism against allelic loss of gene expression appears to exist. The three distinct tiers of gene expression levels arising from these common biallelic polymorphisms in SAE and AM helps explain why historically, the results of association studies of polymorphic GST isoenzymes with lung disease are inconsistent, as usually, the contributions of all these possible highly prevalent CNV genotypes in a given individual have not been fully addressed in such studies [38, 44].
SAE, AMs and xenobiotic-biotransforming genes
Accumulating evidence has defined the importance of the SAE as the initial site of pathology in smoke-induced lung diseases, including COPD and lung adenocarcinoma [5–15]. In addition, AMs have long been postulated to play a major role in the development of emphysema [9, 14, 18, 20, 22–28]. Both the SAE and AMs are important sources of xenobiotic-transforming enzymes, such as cytochrome P450 enzymes and GSTs, which constitute the hosts defences against attack from a myriad of compounds, including many carcinogens present in cigarette smoke [29–34, 48]. The present study demonstrates that the gene expression levels in SAE and AMs of GST isoenzyme genes GSTM1, GSTT1 and, in the case of AM only, GSTT2 are reduced in healthy nonsmokers and smokers proportionate to the gene copy numbers in that individual. This gene dosage effect of CNV was seen with different probe sets for these genes and confirmed by TaqMan RT-PCR. The apparent expression of GSTM1 in homozygous nulls, as determined by microarray analysis in the present study, is probably a consequence of background noise from nonspecific probe-set hybridisation, because TaqMan RT-PCR shows absent expression in such individuals. In the case of GSTT2B, a duplicate gene of GSTT2, CNV-mediated GSTT2B deletion reduces gene expression of GSTT2 in the AMs, an effect that may be due to the inclusion within the deleted region of an enhancer element for GSTT2 as well as GSTT2B [38]. In the present study, significant expression in SAE and AMs was documented for all the cytosolic GST isoenzymes, except for GSTM5 and GSTT2 in SAE, and GSTM5, GSTA3 and GSTO2 in AMs. Heretofore, GSTT1 was not known to be significantly expressed in SAE, nor is there literature regarding the expression of GSTT2 in AMs. Many previous studies of the diversity of GST expression in the lung have focused on whole-lung homogenates or proximal, large airway specimens, rather than purified samples of SAE, as in the present study, and often do not discriminate between isoenzymes within each of the seven GST classes [29, 30, 33, 34, 60].
The fact that the CNV-modulated GST genes are unaffected by smoke exposure is somewhat surprising. Many antioxidant and detoxification genes are significantly upregulated in airway epithelium by chronic cigarette smoke exposure, based on studies in mice and humans [61–63]. Notably, no study has ever shown smoke-inducibility of GSTM1, GSTT1 or GSTT2 in airway epithelium. In fact, the only human airway epithelium gene expression data showing upregulation of a GST isoform in response to cigarette smoke implicates GSTA2 [61], which is not a subject of the current study. Microarray studies in mice have shown that chronic cigarette smoke exposure upregulates GSTM2 and GSTO1, which are not affected by common CNV polymorphisms [63].
It is reasonable to suggest that in the setting of the expression of various isoforms of a GST class in a given tissue, redundancy of enzymatic activity would be created, making the CNV-mediated alteration in gene dosage clinically irrelevant. A number of groups have previously documented the expression of GSTμ1–4 in human lymphocytes, which is similar to the GSTμ isoform expression profile seen in human SAE and AMs in the present study [64–68]. It has been demonstrated in lymphocytes that (in the context of the known expression of other GSTμ isoforms), the selective activity of GSTμ1 towards the substrate trans-stilbene oxide (TSO) correlates with the CNV-mediated deletion mutation of GSTM1 [64, 69]. Furthermore, and of relevance to the molecular pathogenesis of smoke-induced lung disease [70], it has also been shown that DNA adduct levels in lymphocytes of smokers are inversely correlated with GSTμ1 enzymatic activity towards TSO and positively correlated with daily cigarette consumption [66]. These observations support the concept that expression of various isoforms of a GST class within a given tissue is not sufficient to prevent the development of a clinically relevant CNV-mediated deficit in GST enzymatic activity in the face of chronic cigarette smoke exposure.
GST isoenzyme polymorphisms and lung disease
Gene deletion polymorphisms of GSTM1 and GSTT1 have been well documented [29–38, 71–74]. The GSTM1 null allele is thought to have arisen from homologous unequal crossing over between two highly identical 4.2-kb repeated sequences flanking the GSTM1 gene, resulting in a 15-kb deletion including the entire GSTM1 gene [37, 73, 74]. A similar mechanism involving homologous recombination of two 403-bp flanking repeats has been reported to give rise to the GSTT1 null allele, resulting in a 54-kb deletion that includes the GSTT1 gene in its entirety [74, 75]. The GSTT2B CNV has only recently been identified, and is a 38-kb deletion of the entire GSTT2B gene located within a 61-kb DNA inverted repeat [38]. Deletion of GSTT2B was shown to result in very low mRNA expression of the nearby duplicate gene GSTT2 in various cell lines, suggesting involvement of a common enhancer element centromeric to GSTT2 and within the CNV region.
All three of these GST gene deletions arise commonly in the population with differing frequencies depending on the ancestral group in question. For example, the GSTM1 CNV-mediated homozygous gene deletion has been reported to have a frequency of 38–67% in individuals of European ancestry versus 28–35% in individuals of African ancestry [76]. While the CNV-mediated GSTT1 and GSTT2B polymorphisms appear to be biallelic, GSTM1 has evidence of a multiallelic CNV, with reports of an uncommon amplification genotype in ≤3% of Saudi Arabians [77]. The present study, however, showed no evidence of other than biallelic copy number polymorphisms in GST subtypes.
A number of genomic association studies have linked GSTM1 and GSTT1 CNV-mediated gene deletions to the smoke-induced lung diseases COPD and lung cancer [42–46], although some studies have failed to reproduce these disease associations [78–81]. A number of potential explanations have been put forward for this variability, including inadequately powered studies, effects of population stratification given the known ancestral differences in frequency of the deletions, and the fact that many studies did not discriminate methodologically between wild-type individuals and those with a single copy of the gene. However, many of the GST isoenzyme genes, including GSTM1 and GSTT2B, are located within segmental duplications, known to be CNV-enriched throughout the genome, suggesting that there are other, yet to be characterised null alleles of other GST genes or modifying genes that may impact the results of such disease association studies, and may be uncovered in the future as CNV detection methods are improved [38]. Another potential source of added complexity, which the present study does not address, is the increasing evidence of common somatic mosaicism for CNV in different organs and tissues from the same individual [57–59].
In conclusion, the SAE and AMs, front-line cells exposed to the xenobiotics within cigarette smoke and implicated in smoke-induced lung disease, are significant sources of many GST subtypes, including classes μ and θ. The data show that highly prevalent germline CNV-mediated deletions of GSTM1 and GSTT1 cause a progressive loss of mRNA in the SAE of healthy nonsmokers and healthy smokers, with no evidence of a compensatory mechanism for the reduced gene dosage at this crucial disease site. The presence of a highly prevalent recently described gene deletion affecting GSTT2B is also confirmed in the present study, with an associated reduction in total GSTT2 gene expression in AMs. These data support the concept that the mechanism for associations of CNV-mediated GST gene deletions with smoking-induced lung disease involves an uncompensated loss of gene dosage in SAE and AMs, with probable resultant loss of some xenobiotic detoxifying capability. Future association studies of GST genes with lung disease should ensure capture of the many varied genotypes brought about by deletion and duplication events in different individuals to clarify the role of this important family of enzymes in complex smoking-induced lung disorders.
Acknowledgments
We thank D.T. Dang, M. Teater, L. Phipps, M. Hicks, J.P. Murray and T. Fukui for technical assistance, and N. Mohamed and T. Virgin-Bryant (all Weill Cornell Medical College, New York, NY, USA) for help in preparing this manuscript.
Footnotes
This article has supplementary material available from www.erj.ersjournals.com
Support Statement
The study was supported, in part, by NIH grant numbers R01 HL074326, P50 HL084936 and UL1-RR024996.
Statement of Interest
None declared.
- Received February 22, 2010.
- Accepted October 20, 2010.
- ©ERS 2011
REFERENCES


