


Abstract
Malignant pleural effusion (MPE) accompanying lung adenocarcinoma indicates poor prognosis and early metastasis. This study aimed to identify genes related to MPE formation.
Three tissue sample cohorts, seven from healthy lungs, 18 from stage I–III lung adenocarcinoma with adjacent healthy lung tissue and 13 from lung adenocarcinomas with MPE, were analysed by oligonucleotide microarray. The identified genes were verified by quantitative real-time PCR (qRT-PCR), immunohistochemical staining, and immunofluorescence confocal microscopy.
20 up- or down-regulated genes with a two-fold change in MPE cancer cells compared to healthy tissues were differentially expressed from early- to late-stage lung cancer. Of 13 genes related to cellular metabolism, aldolase A (ALDOA), sorbitol dehydrogenase (SORD), transketolase (TKT), and tuberous sclerosis 1 (TSC1) were related to glucose metabolism. qRT-PCR validated their mRNA expressions in pleural metastatic samples. Immunohistochemical staining confirmed aberrant TKT, ALDOA, and TSC1 expressions in tumour cells. Immunofluorescence confirmed TKT co-localisation and co-distribution of ALDOA with thyroid transcription factor 1-positive cancer cells. TKT regulated the proliferation, vascular endothelial growth factor secretion in vitro and in vivo vascular permeability of cancer cell.
Glucose metabolic reprogramming by ALDOA, SORD, TKT and TSC1 is important in MPE pathogenesis.
Lung cancer is the leading cause of cancer death in both males and females in the USA, Europe and Taiwan [1]. Its incidence is increasing and females are more likely than males to have an adenocarcinoma subtype [2], which is often complicated by malignant pleural effusion (MPE) [3]. A recent study reports that the majority of 136 patients with lung adenocarcinoma and MPE were female (61%) [4]. Patients with MPE have been previously classified as stage IIIB but recent data from the International Association for the Study of Lung Cancer propose that the staging of lung cancers with concomitant MPE should be reclassified as early metastasis (M1a) [5].
Unlike other solid cancers with surrounding vascular structures to provide conduits for travel and nutrient delivery, cancer cells in MPE proliferate autonomously and have a high metastatic potential. Due to their specific biological properties, malignant cells within MPE are uniquely capable of surviving and proliferating without a solid-phase scaffolding [6]. Another important mediator is the vascular endothelial growth factor (VEGF), which contributes to the formation of malignant effusions by increasing vascular permeability [7]. Some genes in MPE may be so specific in maintaining the survival of cancer cells in MPE and VEGF secretions that MPE remains intractable and resistant to chemotherapy [8]. A previous study reveals that the interleukin-6/signal transducer and activator of transcription 3/VEGF pathway [9] plays a key role in MPE formation. A connection between EGFR gene mutation and MPE has also been reported [4] but the specific genes or pathways dysregulated remain unexplored.
This study aimed to identify specific genes or pathways of adenocarcinoma with MPE and investigate their significance in MPE cancer cell survival and formation. It focused on female lung adenocarcinoma patients with MPE.
MATERIALS AND METHODS
MPE cancer cells, healthy normal lung tissue, and stage I–III lung cancer for microarray analysis
First, to identify differently expressed genes in MPE cancer cell and normal lung tissue, two cohorts for microarray analysis were collected. The institutional review board approved the study and all patients provided written informed consent. The first cohort of MPE was obtained from 13 females who underwent thoracentesis or thoracotomy at the National Cheng Kung Hospital (Tainan, Taiwan) from 2002 to 2005. Cytological analysis or pathological proof from pleural biopsy was used to verify each lung adenocarcinoma-associated MPE specimen. The methods used for collection of cancer cells from MPE [10], RNA extraction, Affymetrix array hybridisation, and image processing are shown in the online supplementary material. A second cohort of healthy lung tissue microarray was provided by C-H. Lin (National Yang-Ming University, Taipei, Taiwan).
Secondly, the study aimed to show that MPE-specific genes were not only different from health lung tissue but also relatively up- or down-regulated compared to the primary tumour. The identified genes were MPE-specific and more metastatic and invasive than the primary tumour. However, the primary pulmonary tumour of MPE was often not available and no pairing analyses (primary tumour and MPE) could be done. Thus, a third cohort microarray database set (National Center for Biotechnology Information gene expression omnibus accession number: GSE7670) [11], which included samples from 18 females with lung adenocarcinoma with adjacent healthy tissue. The basic and clinical characteristics of these three cohorts are listed in table 1.
Statistical analysis of microarray data
Using the Golub criteria to identify differentially expressed genes between MPE and healthy normal lung tissue [13], the top 500 differential genes corresponding to 631 microarray probes were identified. These 500 discriminative genes (MPE-specific genes) were further analysed using the third cohort microarray database set. The first and the third cohorts were pooled and classified as a fourth group including samples from 18 subjects with adjacent normal lung tissue, nine with stage I lung cancer, nine with stage III, and 13 with MPE cancer cells, representing normal tissue to early stage lung cancer to late-stage (or pre-metastatic) stage.
After using robust multi-array analysis normalisation [11], the 631 probes were further restricted by adding the criterion that the genes show a tendency to be expressed at higher or lower levels between the adjacent healthy, stage I, stage III and MPE samples. First, the identified genes had to be differentially expressed between the four groups. One-way ANOVA was used to search for genes that were expressed statistically differently among these four groups (p<0.05). Moreover, the expressions of these genes had to be higher in MPE compared with the tumour part of stage III cancer, higher in the tumour part of stage III cancer compared with that of stage I cancer, and higher in the tumour part of stage I cancer than the adjacent normal lung tissue. Otherwise, the expression of these genes had to be lower in MPE compared with the tumour part of stage III cancer, lower in the tumour part of stage III cancer compared with that of stage I cancer, and lower in the tumour part of stage I cancer than the adjacent normal lung tissue.
The identified up- or down-regulated genes in MPE cancer cells were also expressed differentially as the cancer progressed from early stage to MPE. Using these supervised and strict set of criteria among the four groups, 71 genes were identified from 500 genes. These 71 genes were further restricted to the expression level at least two-fold higher in MPE samples than normal lung tissue, with p<0.001 to exclude false significant results [14]. The workflow for the analysis is shown in figure 1a.

a) Flow chart for the collection of three different cohorts for microarray analysis. b) Gene expression profiles clustered hierarchically based on final 20 genes. MPE: malignant pleural effusion.
RNA extraction and quantitative RT-PCR
RNA extraction and quantitative RT-PCR were done by Welgene Biotech Co., Ltd (Taipei, Taiwan), while total RNA purification was done by TRIzol reagent combined spin columns. All samples were PCR-amplified (LightCycler-FastStart DNA Master SYBR Green I kit; Roche Diagnostics Corporation, Roche Applied Science, Indianapolis, IN, USA) with constitutively expressed β-actin. The primers designed for the identified genes were listed in table 2.
Immunohistochemistry and immunofluorescent images
Immunohistochemistry and immunofluorescence analysis validated the gene expression in clinical specimens. The basic and clinical characteristics of the three validation cohorts were listed in table 3. The MPE cell blocks were produced using the AgarCyto cell block method [15]. The methods and the antibodies used for immunohistochemistry and immunofluorescence are shown in the online supplementary material.
Cell lines, cell lysates and Western blot
The PC14PE6/AS2 (AS2) cell line was from ascites generated from intraperitoneal injection with PC14PE6 in the metastatic animal model [9]. The normal bronchial cell line (NL-20), lung adenocarcinoma cell line A549, and H1650 were purchased from American Type Culture Collection (Rockville, MD, USA). The CL1-0 clonal cell line was provided by P-C. Yang (National Taiwan University College of Medicine, Taipei, Taiwan).
Total protein from healthy lung lysates and cancer cell lines were extracted, blotted and detected using antibodies against human transketolase (TKT), aldolase A (ALDOA; Proteintech Group, Chicago, IL, USA), tuberous sclerosis 1 (TSC1; Cell Signaling Technology, Inc., Beverly, MA, USA), and glyceraldehyde-3-phosphate dehydrogenase (Santa Cruz Biotechnology, Inc, Santa Cruz, CA, USA). Antibody binding was detected by electrochemiluminescence (Amersham Biosciences, Piscataway, NJ, USA) based on the manufacturer's instructions.
TKT inhibitor and MTT test
Oxythiamine was purchased from Sigma Chemical Co. (St Louis, MO, USA). A 3-(4,5-dimethylthiazol-2-yl)-2,5-diphenyltetrazolium bromide (MTT) test was used to evaluate the anti-proliferation effect of oxythiamine.
Transfection with siRNA, proliferation analysis, colony formation assay, in vitro VEGF secretion and in vivo vascular permeability assay
Oligonucleotides representing small interfering (si)RNA against human TKT expression (TKT siRNA) and mismatch control oligonucleotides (scramble siRNA) were used (Invitrogen-Life Technologies, Carlsbad, CA, USA). The siRNA sequence that targeted TKT was 5′-AAAGAGGACAGCCAUGAUCUCUGCG-3′, while the scramble siRNA was the negative control. The PC14PE6/AS2 cells were transfected with siRNA for a final concentration of 50–100 nM by MicroPorator MP-100 (NanoEnTek, Seoul, South Korea).
The cell proliferation of PC14PE6/AS2 after transfection was detected by flow cytometry analysis with proliferation-associated antigen Ki-67 and cell colony formation assay (online supplementary material).
Transfected PC14PE6/AS2 cells were maintained in 60 mm ultra-low attachment plate (50,000 cells per plate; Corning, Lowell, MA, USA) for 48 h to evaluate cell morphology, VEGF secretion in vitro and in vivo permeability assay (Miles permeability assay; online supplementary material) [9].
Statistical analysis
Data were analysed using Prism 4 (GraphPad Software, Inc., La Jolla, CA, USA). Differential expressions of specific genes between different stages were assessed by one-way analysis of variance (ANOVA) and by Bonferroni post hoc multiple comparisons. The area grade of immunohistochemistry between tumour and healthy samples was determined by the Mann–Whitney U-test. Paired t-test was used to determine differences between TKT siRNA and scramble-transfected PC14PE6/AS2 cells. Statistical significance was set at p<0.05.
RESULTS
Glucose metabolism regulatory genes were aberrantly regulated in MPE cancer cells
20 differentially expressed genes were identified between MPE and healthy adjacent lung tissue. 14 genes were up-regulated and six were down-regulated in the MPE group compared with the healthy controls (fig. 1b). Their relative changes and annotation are listed in table 4. Functional annotation and pathway interaction of these genes was done using the BABELOMICS platform [16] and ingenuity pathways analysis (IPA) [17]. Gene ontology annotation of three of the 20 genes remained unestablished.
Combining IPA canonical pathway analysis and functional definitions with gene ontology and KEGG pathway analysis in the BABELOMICS platform, 13 of the 17 well-known genes (76%) were related to metabolic processes. Further studies of the 13 genes showed that three, ALDOA, sorbitol dehydrogenase (SORD) and TKT, were directly related to glucose metabolism (fig. 2a and b). Of the down-regulated genes, TSC1 was involved in the insulin pathways, according to the KEGG database.
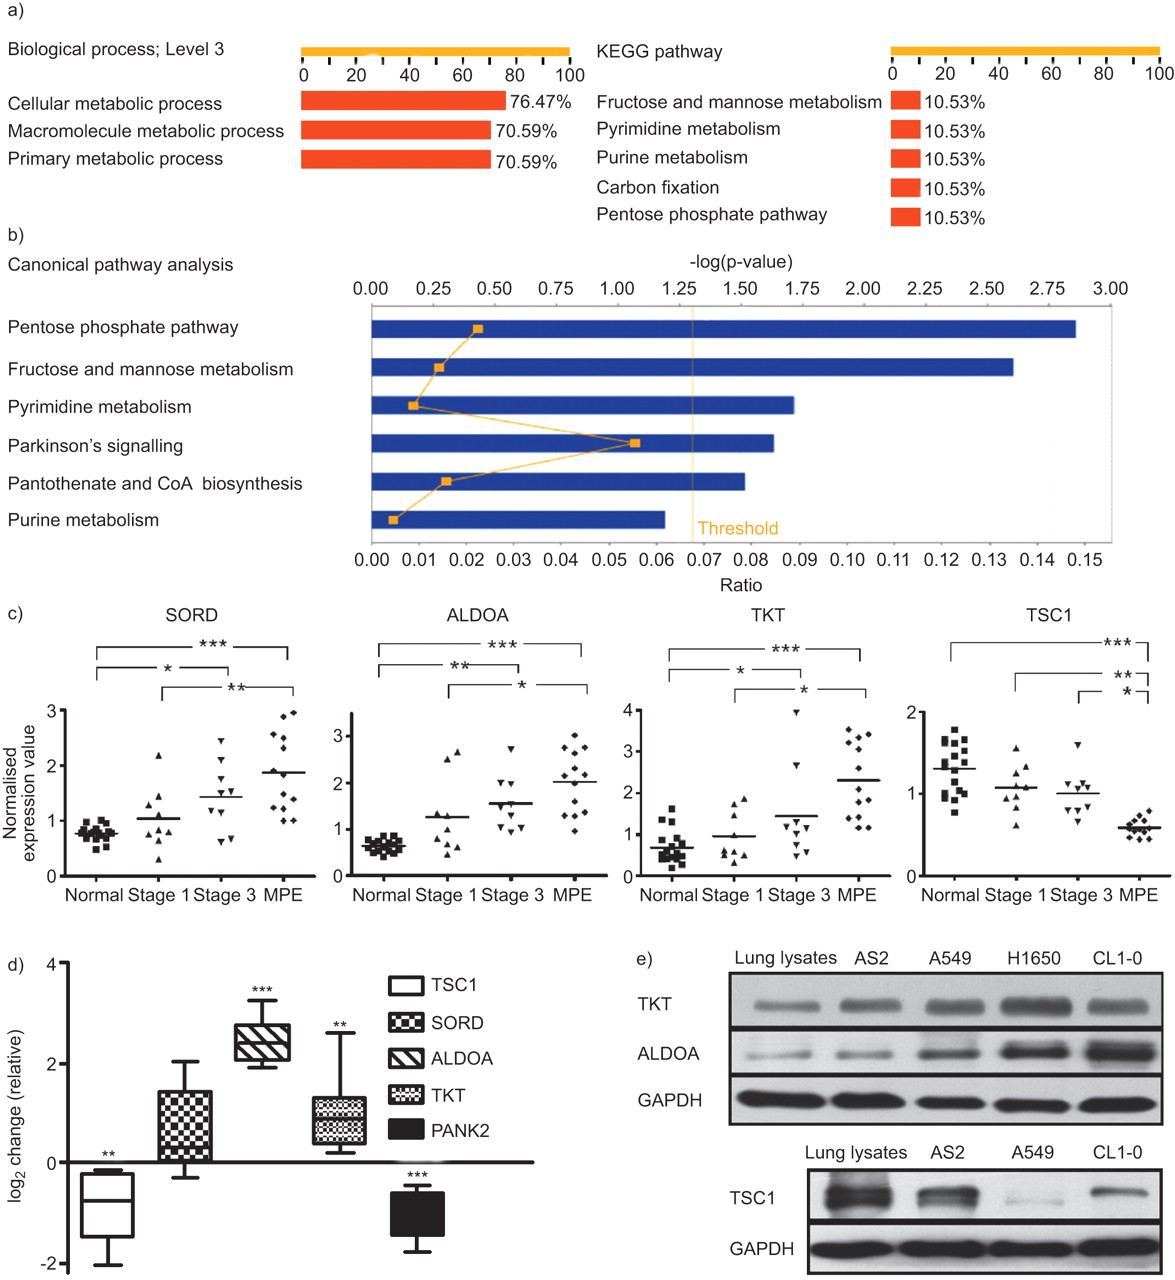
Analysis of all genes and selected gene expression in different stages of lung cancer via bioinformatics platform, qRT-PCR of tissue samples and Western blotting of lung cancer cell lines. a) The BABELOMICS platform revealed that most genes were associated with cell metabolism, according to the gene ontology database. The axis indicates the percentage of well-known genes associated with a specific biological function or pathway. b) Ingenuity pathways analysis of all genes was displayed by canonical pathway. The axis indicates the significance (-log p-value; threshold p<0.05) of the pathway association. c) Gene expression values of glycolysis-associated genes (tuberous sclerosis 1 (TSC1), sorbitol dehydrogenase (SORD), aldolase A (ALDOA) and transketolase (TKT)) from healthy controls and lung cancer patients at different stages (using robust multi-array analysis normalisation). *: p<0.05; **: p<0.01; ***: p<0.001. d) Quantitative real-time PCR analysis of TSC1, SORD, ALDOA, TKT and pantothenate kinase 2 (PANK2) from four lung cancer and adjacent healthy lung tissue samples. e) Western blotting was used to detect TKT, ALDOA (PC14PE6/AS2, A549, H1650 and CL1-0) and TSC1 (PC14PE6/AS2, A549, CL1-0) expressions in the lysates from healthy lung and lung cancer cell lines. GAPDH: glyceraldehyde phosphate dehydrogenase.
Whether these genes are differentially expressed from healthy to early stage lung cancer to MPE were further investigated. The difference between stage I cancer and MPE was statistically significant (fig. 2c; p<0.01 in SORD and p<0.05 in ALDOA and TKT, all by Bonferroni multiple comparisons). The expression levels were also significantly different between the healthy and stage III samples in the three genes (p<0.01 in ALDOA, and p<0.05 in SORD and TKT). Expression levels of TSC1 were lower in the MPE samples than in the stage I (p<0.01) and III (p<0.05) samples.
To verify these gene expression data, RNA was extracted from nine metastatic pleurae lung adenocarcinoma and adjacent normal lung tissue. Samples were then analysed using quantitative RT-PCR. ALDOA and TKT expressions were significantly higher, while TSC1 and pantothenate kinase 2 (PANK2; a non-glucose-metabolism gene) expressions were significantly lower in tumour than in healthy samples (fig. 2d; p<0.05 by t-test). SORD expression was also higher in tumour samples, but the difference was not statistically significant (p = 0.05).
TKT and ALDOA protein expression was higher and TSC1 protein expression was lower in tumour cells than in healthy cells
Western blotting was used to test the protein expression levels of TKT, ALDOA and TSC1 in four lung cancer cell lines: A549, PC14PE6/AS2, H1650 and CL1-0. TKT and ALDOA expression were higher and TSC1 expression was lower in lung cancer cell lines than in healthy lung lysates (fig. 2e) and normal bronchial cell line (NL-20; online supplementary material). Immunohistochemical staining validated the protein expression in clinical samples of lung cancer tissue, adjacent healthy tissue, tumours invading the pericardium, and cancer cells from patients with MPE. TKT was located predominantly in the nucleus (fig. 3a and b) and was more abundantly expressed in tumour cells that invaded the pericardium (fig. 3c), and tumour tissue than in adjacent healthy bronchial epithelium.

Immunohistochemical staining of transketolase (TKT), aldolase A (ALDOA) and tuberous sclerosis 1 (TSC1) in clinical specimens. a) TKT intensity in healthy bronchiole epithelium (arrows, 20× objective). b) Nucleus immunoreactive TKT predominantly expressed in the lung adenocarcinoma adjacent to healthy bronchiole epithelium (arrowheads, 20× objective). c) TKT expression in lung cancer cells invading the pericardium (40× objective). d) TKT intensity of cancer cells in malignant pleural effusion (40× objective). e) Cytoplasmic localisation of predominant ALDOA in lung adenocarcinoma (arrowhead, 20× objective) adjacent to the healthy bronchiole epithelium (arrows, 20× objective). f) ALDOA intensity in lung adenocarcinoma. g) ALDOA expression in lung cancer cells invading the pericardium (40× objective). h) Nuclear and cytoplasmic expression of TSC1 in pneumocytes (arrowheads, 20× objective). i) No expression of TSC1 in adjacent tumour tissue (20× objective). Scale bars = 10 μm. j) Immunohistochemical analysis of TKT, ALDOA, and TSC1 expression in tumour and adjacent healthy tissue specimens from 48 patients (semi-quantitative area scores: 0, no stained tumour cells; 1, 0–25% of tumour cells stained; 2, 26–50% tumour cells stained; 3, 51–75% tumour cells stained; 4, 76–100% tumour cells stained). **: p<0.01; ***: p<0.001 (paired t-test). Higher TKT, higher ALDOA, and lower TSC1 expression was observed in tumour tissue compared to the adjacent healthy area.
Cancer cells from MPE were used to make AgarCyto cell blocks and to study TKT expression in MPE cancer cells. Cancer cells in MPE expressed high levels of TKT (fig. 3d). ALDOA expression, located predominately in cytoplasm, was higher in tumour cells than in adjacent healthy bronchial epithelial cells (fig. 3e and f). Tumour cells that invaded the pericardium also expressed high ALDOA levels (fig. 3g). Conversely, TSC1, located primarily in the cytoplasm and nuclei, was expressed mainly in healthy pneumocytes, but barely or not at all in tumour cells (fig. 3h and i).
Immunohistochemical analyses of 48 lung adenocarcinoma specimens showed that 19 were stage I, 13 stage II, eight stage III and eight stage IV. The percentage of immunoreactive cancer cells was scaled using a four-tiered area grade and semi-quantitative system [18]. Using the area grade, the staining scores for TKT (fig. 3j; p<0.001) and ALDOA (p<0.01) were significantly higher in tumour tissue than in adjacent healthy tissue, and the staining score for TSC1 was significantly lower in tumour tissue (p<0.001) than in adjacent healthy tissue. A limited number of samples for each stage prevented further correlation studies of staining scores and cancer stages.
Cancer cell in MPE and pleural metastasis expressed high TKT and ALDOA
Thyroid transcription factor 1 (TTF-1) served as a good marker of lung cancer cells in MPE [19, 20]. To verify TKT and ALDOA expressions in lung cancer cells from MPE, eight MPE blocks from eight patients who underwent thoracocentesis and cancer cells were examined by cytology (table 2). Triple immunostaining using DAPI, TTF-1, TKT or ALDOA and recording under confocal microscope were used to investigate the expression and distribution of TKT and ALDOA in the TTF-1-positive cells from MPE blocks. TTF-1 expression was predominant in the nucleus of cancer cells from MPE block while TKT immunoreactivity was detected in the nuclei located within TTF-1-positive cancer cells (fig. 4a).

Immunofluorescent analysis detected the expression and distribution of transketolase (TKT), aldolase A (ALDOA) and thyroid transcription factor 1 (TTF-1) at malignant pleural effusion (MPE) lung cancer cells. a) Confocal image under higher power field (60× objective ) showed the immuno-detection of TTF-1 at nucleus demonstrated by DAPI stain for nucleus, TTF-1 stain, merge of DAPI stain and TTF-1 stain and merge of TTF-1 and DIC (differential interference contrast) images. The co-localisation of TTF-1 and TKT was verified by TKT stain and merge of TTF-1 and TKT stain. b) Continuous section showed simultaneous immunodetection of TTF-1 and ALDOA (cytoplasma and cell membrane) by DAPI stain, TTF-1 stain, ALDOA stain and merge of TTF-1 and ALDOA stain. c) Representative confocal images under low power field (20× objective) showed co-localisation of TKT and TTF-1 in nucleus and cytoplasm distribution of ALDOA in TTF-1-positive MPE cancer cells. Scale bars = 10 μm. d) Immunofluorescent analysis was used to detect the co-localisation ratio between TTF-1 and TKT (pixel-by-pixel analyses), and ratio of cytoplasm co-distribution of ALDOA in TTF-1-positive cancer cell from eight patients' MPE cell blocks.
The continuous section showed that ALDOA expression was detected in the cytoplasm and cell membrane within TTF-1-positive cells (fig. 4b). Co-localisation of TKT and co-expression of ALDOA in TTF-1-positive cancer cells were also observed under lower power field with the acinar type (fig. 4c). Further quantitative analysis of ALDOA and TKT expression in the eight MPE cell blocks showed that the co-localisation ratios of TKT and TTF1 were >70% (fig. 4d; using pixel-by-pixel analysis through by FV-1000 software) [21]. Defining co-expression of ALDOA as the distribution of ALDOA staining in more than one-third of the plasma membrane of TKT positive cells [21], the co-expression ratios were >75% (fig. 4d).
There were high TTF-1, TKT and ALDOA expressions in metastatic pleural tissue by immunohistochemistry staining (fig. 5a). Immunofluorescence staining and photography by confocal microscope on the continuous section further confirmed the co-localisation of TKT and co-expression of ALDOA in TTF-1-positive cancer cells (fig. 5b). Immunohistochemical analyses of the metastatic pleural adenocarcinoma of 10 patients (table 4) showed that staining scores for TKT and ALDOA were significantly higher in tumour tissue compared to adjacent stroma and endothelial cell (fig. 5c and online supplementary material; p<0.001).

Distribution of transketolase (TKT), aldolase A (ALDOA) and thyroid transcription factor 1 (TTF-1) at metastatic pleurae tumour. a) Immunohistochemical analysis was used to detect the expression of TKT, ALDOA and TTF-1 in metastatic pleurae tumour (area of dashed line, 20× objective) compared to adjacent normal pleurae tissue. b) Continuous section for immunofluorescence analysis and confocal image showed co-localisation of TKT and TTF-1 in nucleus and cytoplasmic distribution of ALDOA in TTF-1-positive cancer cells in metastatic pleurae tumour (area of dashed line, 20× objective). Scale bars = 20 μm. c) Immunohistochemical analysis was used to detect the expression of TKT and ALDOA in the metastatic pleurae tumour of 10 patients. Higher expression of TKT and ALDOA was found in tumour tissue compared with the adjacent fibroblast and endothelial cell (semi-quantitative area scores: 0, no stained tumour cells; 1, 0–25% of tumour cells stained; 2, 26–50% tumour cells stained; 3, 51–75% tumour cells stained; 4, 76–100% tumour cells stained). ***: p<0.001.
Oxythiamine and TKT knockdown with siRNA inhibited lung cancer cell proliferation
Oxythiamine, a well-known TKT inhibitor, blocked TKT function by competing with thiamine, a key TKT co-factor [22]. It dose-dependently inhibited the proliferation of AS2, A549, CL1-0 and H1650 lung cancer cells 96 h after being added to the culture medium (fig. 6a). MTT assays showed that the half maximal inhibitory concentrations of all cells were around 10–20 mM.

Inhibition of transketolase (TKT) blocked the viability or proliferation of lung cancer cells. a) Oxythiamine, a TKT inhibitor, blocked the viability of lung cancer cells. The viability rate was detected using MTT test. b) The knockdown of TKT with TKT siRNA inhibited the proliferation of PC14PE6/AS2 cells. Western blotting analyses showed the expression of TKT of PC14PE6/AS2 cells transfected or untransfected with siRNA-scramble control, siRNA-TKT. c) Histograms showed Ki-67 staining of TKT siRNA and scramble-transfected PC14PE6/AS2 cells compared to the isotype control. Ig: immunoglobulin. d) Proportions of Ki-67 positive and colony formation in TKT siRNA or scramble-transfected PC14PE6/AS2 cells. **: p<0.01 (paired t-test).
To verify the role of TKT on cancer cell proliferation, siRNA was used to knockdown TKT expression in PC14PE6/AS2 cells. The transfection of TKT siRNA into cells suppressed TKT expression but not in the scrambled and untransfected control, as assayed by Western blotting (fig. 6b). To investigate the effects of proliferation, the proportion of ki-67 staining (fig. 6c) was lower in TKT siRNA transfected cells (54%) than in the scramble control (74%). The rate of colony growth also decreased (20%) by colony formation assay (fig. 6d).
TKT knockdown with siRNA prevented lung cancer cell VEGF secretion in vitro and vascular permeability in vivo
Since cancer cells in the pleural cavity tend to be spheroid or clustered, but are flattened attachments when cultured in adherent culture dishes, PC14PE6/AS2 cells were maintained in ultra-low attachment plates to investigate the effects on knockdown TKT. Using TKT siRNA to knockdown TKT expression, TKT siRNA cells dispersed instead of forming clusters (data not shown).
VEGF is a vascular permeability factor contributing to the generation of malignant effusions [7]. First, ELISA of VEGF secretion of the conditioned medium revealed decreased VEGF secretions in si-TKT PC14PE6/AS2 cells compared to the si-scramble controls (fig. 7a).

Inhibition of transketolase (TKT) in PC14PE6/AS2 cells reduced vascular endothelial growth factor (VEGF) secretion and vascular permeability. a) Secretion of VEGF of PC14PE6/AS2 was calculated after transfection with scramble siRNA or TKT siRNA and maintained in ultra-low attachment plate (n = 4). **: p<0.01. b) Biological activity of VEGF secreted by PC14PE6/AS2 cells after transfection with scramble siRNA or TKT siRNA was measured by the Miles permeability assay. The dye leakage areas are marked by dashed red circles. c) The areas of dye leakage were calculated for each injection site (n = 4). *: p<0.05.
The in vivo permeability assay (Miles permeability assay) was performed to determine if knockdown of TKT can down-regulate VEGF and lead to diminished vessel permeability. The areas of dye leakage induced by conditioned medium from TKT siRNA PC14PE6/AS2 cells were smaller than the leakage area from scramble transfected cells (fig. 7b and c). Thus, VEGF produced by PC14PE6/AS2 cells is biologically active, and that down-regulation of VEGF secretion in PC14PE6/AS2 cells by inhibiting TKT can reduce vascular permeability.
DISCUSSION
20 genes are not only up-regulated (14) or down-regulated (six) in MPE cancer cells compared to normal lung tissue but also expressed differentially as lung cancer progresses from early stage to MPE. Of the 13 genes related to cell metabolism, three (ALDOA, SORD and TKT) are directly involved in glucose metabolism while one (TSC1) is involved in the insulin pathway. Unlike other microarray studies derived directly from solid tumours, the MPE in this study has been collected from pleural metastatic lung adenocarcinoma and cancer cells have been further enriched as in a previous study [10]. Immunohistochemistry and immunofluorescence analysis of MPE and metastatic pleural lesion further confirm the specificity of these genes in cancer cells other than in adjacent fibroblast and endothelium cell.
In 1924, Warburg [23] proposed that tumour cells use glycolysis even in oxygen-rich environments and concluded that this defective metabolism results in cancer formation. Cancer cells in MPE proliferate autonomously and have a high metastatic potential [6]. Other investigators [24] have also demonstrated that low glucose concentrations and pH in the pleural effusion predicts shorter survival and less successful pleurodesis. An 18F-2-deoxyglucose (FDG) positron emission tomography study [25] shows that higher 18F-FDG uptake (higher glycolysis) in pleural effusion is associated with poor survival. Other glucose degradation pathways such as the pentose phosphate and sorbitol pathways have also been associated with cancer proliferation [26, 27].
Recently, many basic and clinical studies have confirmed that metabolic reprogramming benefits cancer cells [28]. Inhibiting glycolysis-associated enzymes blocks tumour growth in animal models. Conversely, VEGF acts as a key mediator in pleural effusion formation by increasing vascular permeability [7]. Many studies demonstrate the link between glycolysis and VEGF activation. Though hypoxia is a definite VEGF trigger [29], normoxic cells or cancer cells exposed to inflammatory stimuli, such as interferon, tumour necrosis factor-α and interleukin, may manifest phenotypic changes like those observed in hypoxic cells [30]. These inflammatory stimuli also induce VEGF secretion in lung cancer with MPE [9, 31]. The product of glycolysis, lactate, has also been proven to incite angiogenesis, even in a normoxic environment [32].
In the current study, ALDOA, TKT and SORD are all involved in glucose metabolism. There are three aldolase isozymes in humans and ALDOA expression is higher in lung tumours than in healthy tissue [33]. The mechanism for this up-regulation remains unknown. SORD is involved in the sorbitol pathway of glucose metabolism and although no studies have linked SORD to tumourigenesis, blocking the sorbitol pathway suppresses colon cancer cell proliferation [27]. TKT, the key enzyme in the pentose phosphate pathway, which mediates the conversion of glucose to ribose phosphate, is used in the biosynthesis of nucleic acids and nucleotides. The pentose phosphate pathway is up-regulated in cells with anchorage-independent cell growth phenotype [34], which have high metastatic potential. Cancer cells that proliferate in MPE are also anchorage independent.
TKT expression is not only higher in MPE in microarray analysis but also verified in primary lung cancer tissue, metastatic pleural tumour, and malignant pleural effusion. Using the TKT inhibitor, oxythiamine, or transfecting lung cancer cell with small interfering RNA against TKT, inhibiting TKT suppresses lung cancer cell proliferation. Therefore, up-regulating TKT in cancer cells from MPE may facilitate their survival by activating the pentose phosphate pathway. Using an ultra-low attachment plate, the knockdown of TKT prevents cell aggregation, which is related to colony formation in soft agar [35]. TKT also controls the secretions of VEGF and vascular permeability in vitro and in vivo. A recent study in a diabetic animal model also verifies that the TKT activator benfotiamine stimulates the activity of pentose phosphate pathway enzymes, leading to phosphorylation/activation of VEGF receptor-2 [36]. Taken together, TKT is involved not only in MPE cancer cell proliferation but also in VEGF secretion in MPE formation.
The TSC1/TSC2 complex is associated with the development of tuberous sclerosis, and mutations in either gene are responsible for both the familial and sporadic forms. Although not directly involved in glucose metabolism, TSC1 modulates the mammalian target of rapamycin (mTOR) pathway and receives input from the PI3K-Akt and LKB1-AMPK pathways. Hyperactivation of mTOR alone is sufficient to drive hypoxia-inducible factor-dependent transcription of glycolytic and angiogenesis-related genes [37]. The LKB1 gene is inactivated in lung cancer cells and related to tumourigenesis and metastasis [38]. Moreover, TSC1 regulates VEGF expression via the mTOR pathway [39]. Considering all of these, the AMPK-LKB1-TSC1 pathway is a potential target for lung cancer therapy.
In conclusion, a panel of genes from MPE may contribute to lung cancer progression. Glucose metabolism is important not only in tumourigenesis but also in cancer cell proliferation and VEGF secretion in MPE. This study increases the understanding of underlying mechanisms of MPE, which may facilitate the development of new treatment strategies for MPE-associated lung adenocarcinoma.
Acknowledgments
The authors thank I. J. Fidler (MD Anderson Cancer Center, Houston, TX, USA) for the human lung adenocarcinoma cell line PC14PE6, and P-C. Yang (National Taiwan University College of Medicine, Taipei, Taiwan) for the human lung adenocarcinoma cell line CL1-0. The authors thank the Microarray and Gene Expression Analysis Core Facility of the National Yang-Ming University VGH Genome Research Center (Taipei) for technical support and E.Y. Chuang (Bioinformatics and Biostatistics Core, National Taiwan University, Taipei) for help with the ingenuity pathway analysis. The authors also thank G. Alzona Nisperos for editing.
Footnotes
This article has online supplementary material available from www.erj.ersjournals.com
Support Statement
This work was supported by the Department of Health (DOH99-TD-C-111-003, DOH99-TD-B-111-102), and by grants NSC 97-2314-B-006-014-MY2 and NHRI93A1-NSCBS04-2-5.
Statement of Interest
None declared.
- Received January 29, 2010.
- Accepted September 16, 2010.
- ©ERS 2011
REFERENCES


