


Abstract
The aim of our study was to determine the contribution of secular trends and sample size to lung function reference equations, and establish the number of local subjects required to validate published reference values.
30 spirometry datasets collected between 1978 and 2009 provided data on healthy, white subjects: 19,291 males and 23,741 females aged 2.5–95 yrs. The best fit for forced expiratory volume in 1 s (FEV1), forced vital capacity (FVC) and FEV1/FVC as functions of age, height and sex were derived from the entire dataset using GAMLSS. Mean z-scores were calculated for individual datasets to determine inter-centre differences. This was repeated by subdividing one large dataset (3,683 males and 4,759 females) into 36 smaller subsets (comprising 18–227 individuals) to preclude differences due to population/technique.
No secular trends were observed and differences between datasets comprising >1,000 subjects were small (maximum difference in FEV1 and FVC from overall mean: 0.30– -0.22 z-scores). Subdividing one large dataset into smaller subsets reproduced the above sample size-related differences and revealed that at least 150 males and 150 females would be necessary to validate reference values to avoid spurious differences due to sampling error.
Use of local controls to validate reference equations will rarely be practical due to the numbers required. Reference equations derived from large or collated datasets are recommended.
Pulmonary function test, in particular spirometry, play an important role in diagnosing obstructive lung disease 1–6, assessing the severity of lung disease, monitoring treatment of patients with respiratory disorders, and allocating patients to treatment groups in drug intervention studies. Since spirometric lung function depends on body size, age, sex and ethnic group, reference equations derived from healthy individuals are imperative for interpreting results. While there is ample choice of published equations [7], there are significant differences between reference equations which have implications for the interpretation of results 8–14. Furthermore, the observed differences between equations raise important questions about the causes of these discrepancies, how to select the most appropriate equations and whether or not “local healthy controls” should be used to validate the selected reference.
It has been proposed 10 that the observed differences between prediction equations are due to technical and procedural differences (including quality control), true (biological) differences between populations, including secular trends, and chance differences between populations due to sampling (“sampling error”). Smaller samples have greater uncertainty about the true mean and thus increase the chance that they will differ from other datasets simply due to sampling error. Since many prediction equations are based on limited sample sizes, to date, it has been difficult to separate the effects of sampling error from those due to biological or technical differences.
Given the practical limitations of measuring large samples of healthy individuals to derive population-specific reference equations, especially those derived from across the entire life span, it has been proposed that available datasets should be collated to produce globally applicable reference equations 13, 15. Earlier attempts to achieve this goal relied on constructing summary equations derived from published equations for specific age groups 16–18. Although such summary equations have been widely used and served a useful role, their limitations soon became apparent 19. The potential advantages of collating original data and storing such data within an international database supported by the major international respiratory societies was proposed in 1995, but has yet to be implemented 13. The recent emergence of flexible and sophisticated statistical methods such as GAMLSS to model lung function data [20–22] provides a powerful tool to underpin such initiatives, and overcomes many of the previous difficulties, including those relating to the rapid age-related changes in childhood and adolescence when trying to derive “all-age” equations 13, 23–26. The benefits of collating data include a larger sample size over a wider age range which will be more generalisable. This may, however, come at a cost of increased variability from outlying datasets due to the biological or technical differences mentioned previously, which may in turn inflate the lower limit of normal (LLN). Furthermore, if secular trends in pulmonary function arise from a trend in physical development 27, 28 and/or in technical improvements, equations based on collated datasets could be internally biased 29–34.
Although many users remain unaware of which prediction equations are being used to interpret their data, it is generally recommended to apply reference equations that have been derived from a similar population to that being tested, using comparable instruments, methods and quality standards 8, 10, 35. It has also been suggested that results from a group of local healthy subjects should be used to validate the selected reference equations. However, in practice these recommendations are difficult to apply, since evidence regarding the number of healthy subjects actually required is limited and inconsistent, with estimates ranging from 20 to100 8–10, 36.
The objectives of our study were to: 1) explore the differences between centres in a collated dataset, including those due to secular trends, and how these affect predicted values of spirometric lung function; 2) investigate the influence of sample size per se on the interpretation of lung function results; and 3) to estimate the minimum number of subjects required for local validation of reference equations.
MATERIAL AND METHODS
Within the framework of the Global Lungs Initiative (see [37] for further information), 64 centres from 28 countries across five continents have now shared spirometric data on 149,759 healthy, lifelong nonsmokers aged 2.5–95 yrs. The overall aim of this group is to derive prediction equations for different ethnic groups that are valid worldwide. The analysis presented in this paper is confined to white subjects, as they currently represent the majority of available data. 30 centres provided data on 19,291 white males and 23,741 white females aged 2.5–95 yrs. The distribution by age is shown in the supplementary data (fig. E1). Sample size in each of the individual datasets varied between 20 to 4,759 female subjects and 17 to 3,683 male subjects; 12 datasets comprised <100 females and 10 had <100 males. Data were collected between 1978 and 2009. Although published data from the Health Survey for England 1995–1996 (HSE) study was limited to individuals aged ≥16 yrs 38, for the purposes of this analysis these were complemented with data from subjects aged 7–16 yrs olds that had been collected in the same study using identical protocol and techniques.
All datasets complied with international recommendations with regard to equipment, methods, procedures, data selection and quality control, valid at the time of data collection. All persons, groups or organisations sharing data with the Lung Function in Growth and Aging initiative have specified that data were collected with appropriate ethical approval and permission has been given to publish results from the collated dataset.
GAMLSS [20–22] was used to derive the best fitting function for forced expiratory volume in 1 s (FEV1), forced vital capacity (FVC) and FEV1/FVC as a function of age and height in males and females. The statistical methods used were as described by Cole et al. 23, details of which are provided in the supplementary data. Once the equations had been derived from the entire dataset, they were used to calculate the average standardised residuals (z-scores) for each centre. Ideally, the residuals from each centre should have a mean of 0 and an sd of 1. To investigate the influence of secular trends, we displayed the residuals (z-scores) as a function of the year of measurement; in studies conducted over several years the mid-point of the study was used.
In order to explore the influence of sample size per se on predicted values, without any confounding effects due to biological or technical differences, and to estimate the minimal number of local controls that would be needed to validate published reference equations, we repeated this exercise after dividing data from the HSE study into smaller subsets. A random selection was performed (without replacement) so that 36 subgroups of males (n = 3,683; subgroup size 38 to 225) and 46 subgroups of females (n = 4,759; subgroup size 18 to 227) were formed. Using all the data in the HSE study, GAMLSS was again used to derive the best fitting function for FEV1, FVC and FEV1/FVC as a function of age and height in females and males. Subsequently, the average standardised residuals (z-scores) were obtained for each of the 82 individual HSE subsets.
RESULTS
Difference in mean z-score between centres
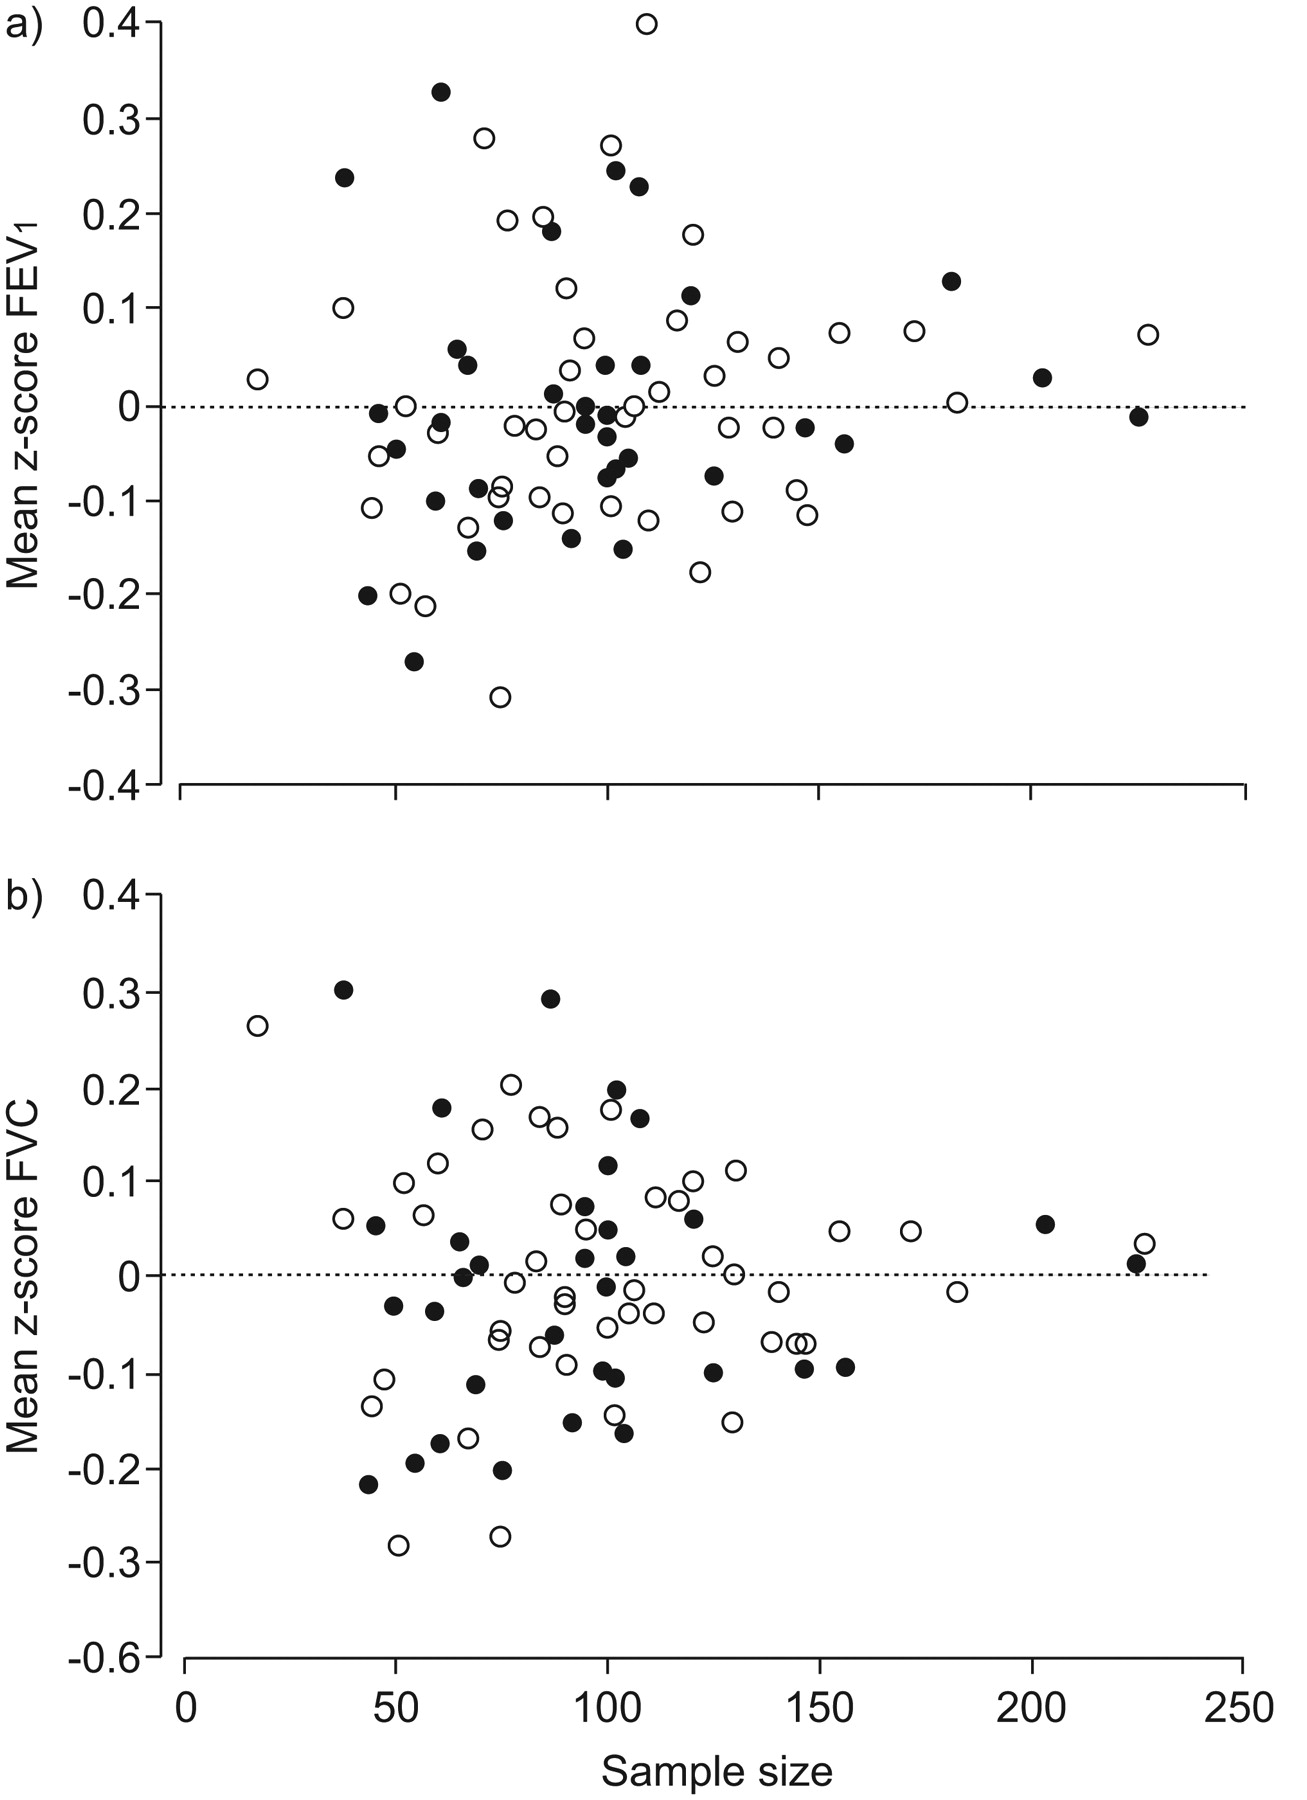
Differences between the largest datasets were small and clinically minimal (fig. 1). The mean of the z-scores in the largest datasets was virtually zero. Maximum differences from the overall mean for FEV1, FVC and FEV1/FVC in datasets with >1,000 subjects ranged 0.30– -0.22 z-score (i.e. were within ∼3% of that predicted from the collated dataset). For datasets with n>150 but n<1,000 the corresponding range for FEV1 and FVC was 0.4– -0.3 z-scores, with slightly larger differences for FEV1/FVC. The smaller the number of subjects in a dataset, the larger the offset from zero (fig. 1). Details of the numbers of subjects in each study and the centre specific z-scores are given in the supplementary data (table E1).

Distribution of mean z-scores (standardised residuals) for a) forced expiratory volume in 1 s (FEV1) and b) forced vital capacity (FVC) in 30 datasets as a function of sample size. z-scores for each centre were calculated using the equations derived from the entire collated dataset by using GAMLSS [21] to regress FEV1 and FVC on age and height separately for males and females. ○: females; •: males.
Secular trends
There was no significant correlation between year of measurement and either sample size or the residuals for FEV1, FVC and FEV1/FVC (p = 0.833 for FEV1 and p = 0.447 for FVC) (fig. 2). Height differed between datasets from that in the HSE study by up to 2%; these differences were unrelated to the mean z-score for that centre.
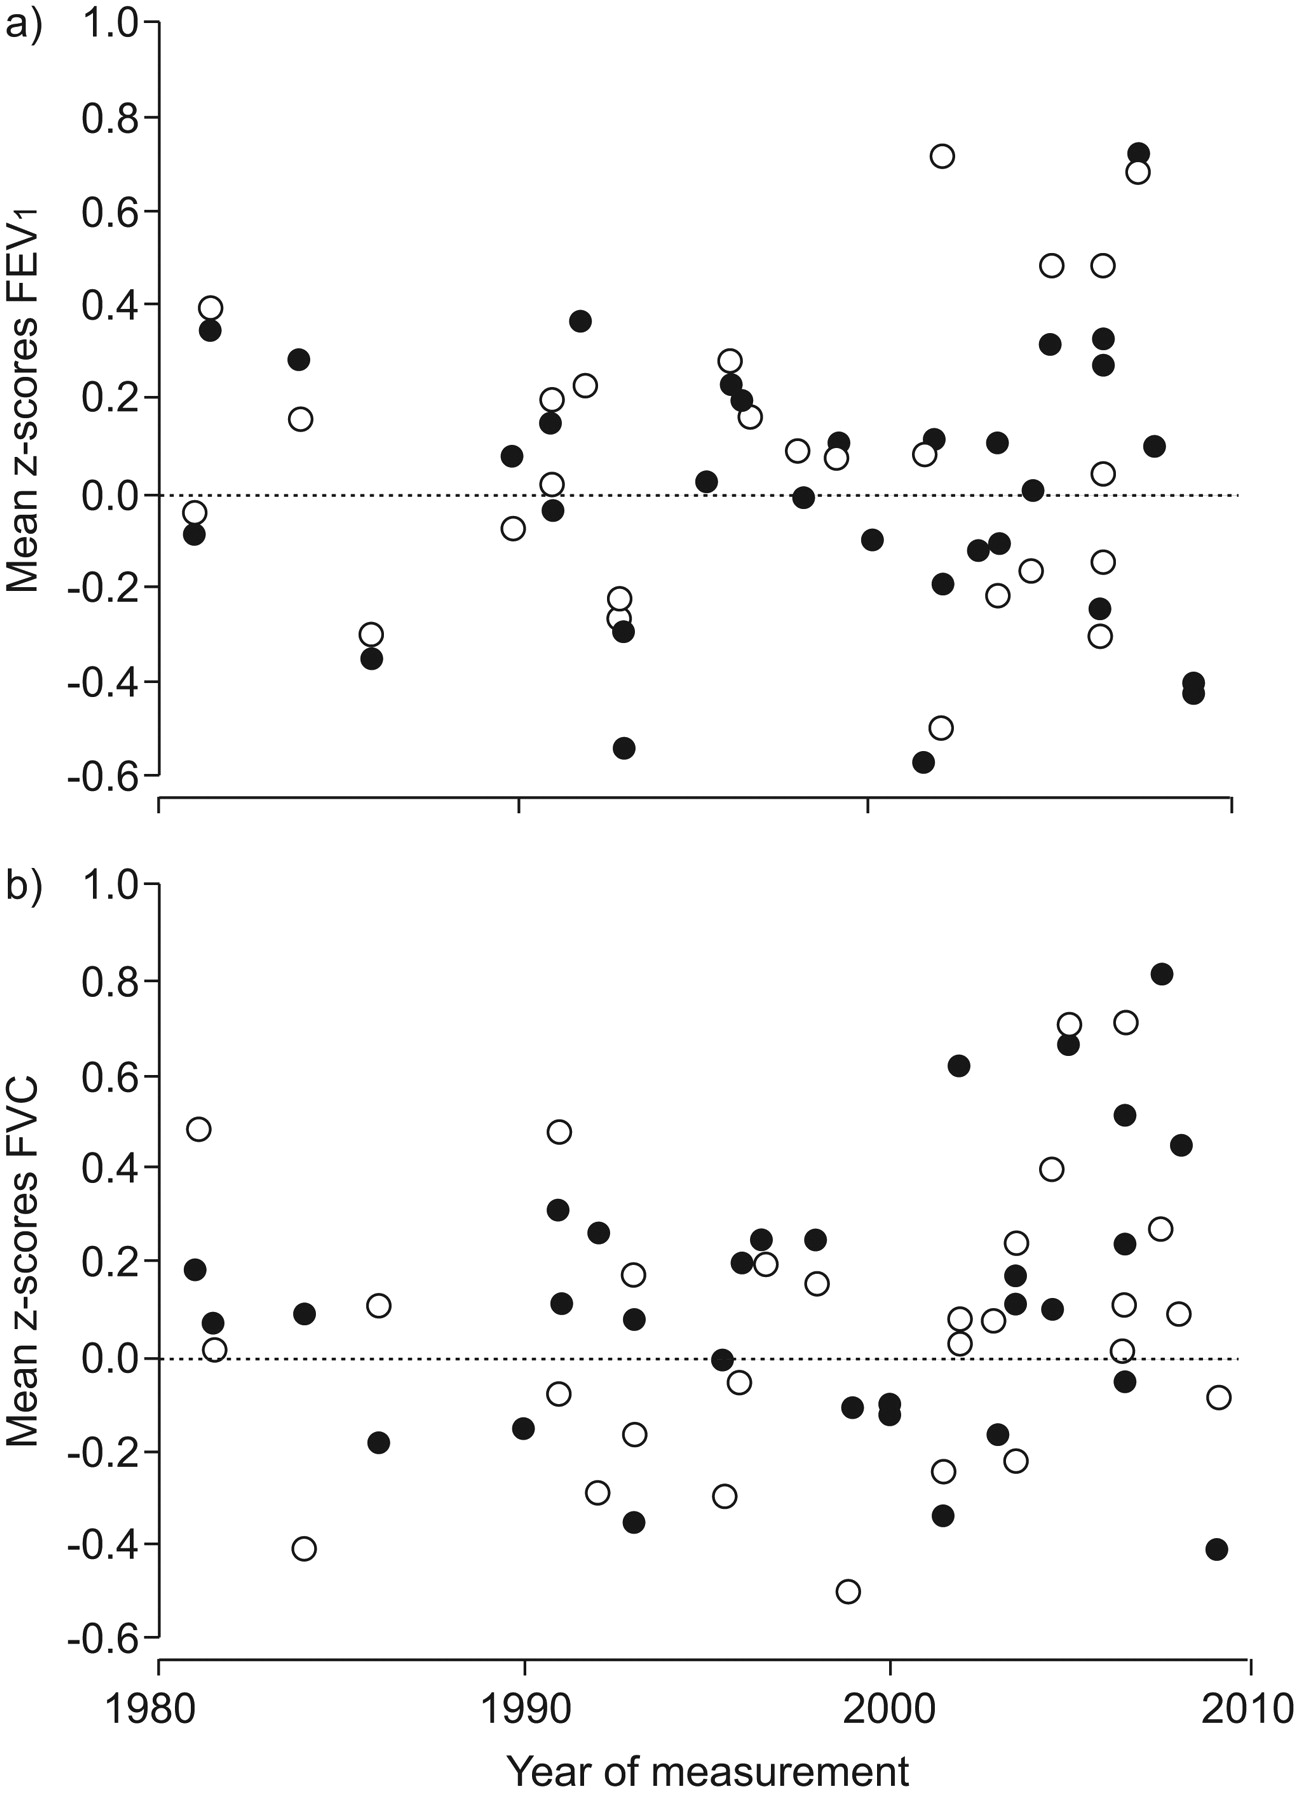
Distribution of mean z-scores for a) forced expiratory volume in 1 s (FEV1) and b) forced vital capacity (FVC) in 30 datasets as a function of the year of measurement. No secular trends were evident in data collected from white subjects over the past 30 yrs. ○: females; •: males.
Differences in scatter between centres
The scatter (sd of the z-scores) in each centre was also related to sample size (fig. E2 in supplementary data). Thus, while the sd was fairly close to the ideal of 1 in datasets comprising >1,000 subjects, there was increasing variability for sample sizes <1,000, the extremes being 0.60 and 1.29. The average sd of the z-scores from all the centres was slightly less than 1 (0.97 in females, 0.95 in males for FEV1; 0.96 in females, 0.94 in males for FVC). The LLN in collated data is determined by the largest datasets; these have a slightly lower LLN for FEV1 and FVC than in small datasets. This effect was more pronounced for the FEV1/FVC ratio (0.90 in both females and males). Further details are given in the supplementary data.
The effect of sample size on predicted values
To investigate whether including the smaller datasets biased the predicted values and their scatter, we derived prediction equations that were limited to datasets where n>100 for each sex and compared these to the values derived when data from all 30 centres had been included. This had minimal effect on either the predicted values (maximum difference in FEV1 or FVC 17 mL) or the scatter (maximum difference in sd up to 2 mL).
What size of sample is needed to validate equations?
To confirm whether differences observed between centres (fig. 1) were primarily due to sample size, we examined the differences within subsets of varying sizes from the HSE study. As can be seen from figure 3, exactly the same pattern was observed as when examining differences in residuals between centres. Thus, there was minimal offset from the predicted value derived from the entire HSE dataset in the largest subsets (n>150), with increasing scatter in the residuals with decreasing group size (fig. 3).This is in keeping with results from other studies 39–41. As these data derive from the same population and were collected by the same staff, using the same methods and quality control, differences can only be explained by sampling error; the smaller the sample, the more the offset and variability from the expected mean.
Distribution of mean z-scores (standardised residuals) for a) forced expiratory volume in 1 s (FEV1) and b) forced vital capacity (FVC) in 3,683 males (•) and 4,759 females (○) as a function of sample size in subsets of the Health Survey for England population 38.
The sd of the z-scores was also calculated for each of the 82 subsets of data from the HSE study. The sd for FEV1, FVC and FEV1/FVC ranged from 0.80 to 1.21 in females and from 0.72 to 1.25 in males for the various subsets, the average being 0.99–1.00. Once again, the pattern was similar to that observed from the 30 centres, i.e. the sd decreased as sample size increased, with close agreement once the sample size was >150. This is in keeping with results from other studies 39–41. These findings suggest that at least 300 local healthy controls (150 males and 150 females) would be needed to validate published reference equations with any degree of certainty, since with smaller sample sizes differences of up to 0.5 z-scores may occur purely by chance.
DISCUSSION
This study provides evidence with respect to several important issues related to the interpretation of spirometry data using reference equations. First, differences between large datasets were clinically insignificant, and no evidence was found of secular trends in data collected from white subjects over the past 30 yrs. Secondly, reference equations derived from collated datasets are a reasonable approach to interpret lung function results across different centres. Thirdly, differences between datasets based on a relatively homogeneous population (in this case white subjects of European origin) are largely explained by sampling variability. Fourthly, validation of published reference values for spirometry using local controls is unlikely to be practical due to the numbers required to avoid sampling error. Finally, prediction equations derived from <150 individuals for each sex are unlikely to be reliable. This is likely to hold true for any ethnic group.
Despite being collected over a period of 30 yrs (1978–2009), there was no evidence of a secular trend in pulmonary function (fig. 2). This strongly suggests that differences between centres can only be attributed to a minor extent to biological and technical differences. Secular trends in pulmonary function have been described previously 28–34. They may be due to a cohort effect, i.e. that persons born for example 50 yrs ago had a different lung development during growth than those born 30 yrs ago. Infectious diseases, nutrition, smoking during pregnancy, exposure to environmental factors, different age of maturation, etc. might all leave their marks so that the lung function of a 50-yr-old person born in 1930 would be different from that in a 50-yr-old person born in 1960. The fact that we did not find evidence for a secular trend in spirometric indices over the past 25–30 yrs may be due to the fact that the present study is based on data derived from societies in Europe, North America, Australia and New Zealand with comparable and relatively stable socio-economic conditions. Alternatively, since secular changes in height with increasing affluence tend to reflect changes in leg length rather than trunk height 27, it is possible that subtle improvements in lung function over time may be masked when lung function is based on standing height. Since data in this study complied with different standards issued by ECCS, ECCS/European Respiratory Society (ERS), American Thoracic Society (ATS) and ATS/ERS [17, 35, 42–44], secular trends might spuriously arise from the application of more rigorous standards and differences in instruments used. For example, Hankinson et al. 45 found that applying the 1994 ATS standards 43 rather than the 1987 standards 42 made a difference in the level of FEV1 and FVC equivalent to z-scores of ∼0.14 and ∼0.12, respectively. Our results suggest that any trend due to implementation of more rigorous standards is obscured by small differences between populations. This may not hold true for measurements of lung volumes and transfer factor for the lung of carbon monoxide.
A major concern when working with collated data is that differences in inclusion criteria or in methodological and other issues will adversely affect the accuracy and precision of predicted values, i.e. the average and the LLN. Our findings suggest that biological differences between populations were small, that standards of administering pulmonary function tests and quality control were relatively uniform, and that differences between centres seem to be mainly due to sampling error. By creating subgroups of different sizes from the large HSE study, we controlled for secular trends, biological differences and technical differences in administering pulmonary function tests, as well as in quality control. This analysis confirmed that the offset from predicted values is related to sampling error, such that smaller sample sizes have greater offset from the predicted mean. This provides further evidence to support the collation of data in order to derive more robust prediction equations.
When combining data from 30 sources around the world, we would expect greater offset and variability than in the sub-samples of datasets derived from a large population (HSE). Instead, there was remarkable similarity, with only the smallest datasets differing more from the overall mean rather than the sub-samples from the HSE population (fig. 3). However, the findings differed with respect to the residual scatter which was, on average, smallest in the smallest datasets (fig. E2), indicating that populations in the largest datasets were less homogeneous. Because the results of regression analysis are dominated by the largest datasets, which reflect a representative population sample, the LLN derived from the collated data will be slightly lower than those in datasets comprising <1,000 individuals (fig. E2). As the largest datasets arose from random population samples, the predicted values and their LLNs are representative of such populations. Our results also indicate that while inclusion of the smaller datasets does not lead to biased results, predicted values and LLNs derived from small local datasets of healthy controls are unlikely to be representative of a general population. This does not diminish the value of recruiting prospective controls in research studies.
In the past, equations based on collated data were generated using published prediction equations 16–18, 35. This leaves much to be desired as the prediction equations were simple in structure and, therefore, did not allow appropriate modelling of the complex relationship of pulmonary function with age and height from derived data. This also holds for determining the LLN. A clear advantage of deriving prediction equations from collated data using modern statistical techniques and the actual results from each individual is that the age-related changes in the level of pulmonary function, as well as the LLN, can be modelled properly 15, 23, 25, 26.
Our findings have practical implications in that laboratories seeking to validate reference equations for spirometry need to collect data on at least 300 healthy subjects. Even then, results from a local reference population are still likely to differ from predicted values by up to 0.2 z-scores. Since the between-subject variability (coefficient of variation) in this study varied from ∼11% in adolescents to 17% in elderly subjects and those aged <6 yrs, a difference of 0.2 z-scores equates to 2–3.5% of predicted, depending on the age of the local reference group. Thus, while validation of reference equations is potentially important, it appears to be largely impractical. Given the cost and effort required to form such large local reference populations, it is probably more practical and acceptable for laboratories to adhere closely to international standards for pulmonary function testing and adopt reference equations derived from large or collated studies.
Conclusions
The collation of spirometric data to produce reference equations is a robust approach to interpret lung function results. The potential and minimal inflation of the limits of normality when using a collated dataset is balanced against a greater bias in predicted values when smaller datasets are used. Differences between centres are unlikely to be due to secular trends, technical or population differences, but rather sampling variability due to small sample sizes. The validation of external reference values by lung function laboratories is quite costly and impractical. In practice it is advisable for laboratories which adhere closely to international standards for pulmonary function testing to adopt reference equations derived from large studies. This study provides evidence in support of the collation of spirometry data to create worldwide all-age reference equations.
Acknowledgments
The persons and centres contributing data to this manuscript as part of the Global Lungs Initiative were as follows. C.S. Beardsmore (Dept of Infection, Immunity and Inflammation, Division of Child Health, University of Leicester, Leicester, UK); B. Brunekreef (Institute for Risk Assessment Sciences, Universiteit Utrecht, Utrecht, the Netherlands); H. Eigen (Section of Pulmonology and Intensive Care, James Whitcomb Riley Hospital for Children, Indiana University School of Medicine, Indianapolis, IN, USA); E. Falaschetti (Dept of Epidemiology and Public Health, UCL, London, UK); B. Fallon (Respiratory Laboratory, Nepean Hospital, Penrith, Australia); M.W. Gerbase (Division of Pulmonary Medicine, University Hospitals of Geneva, Geneva, Switzerland); C.J. Gore (Physiology Dept, Australian Institute of Sport, Belconnen, Australia); G. Hall (Respiratory Medicine, Princess Margaret Hospital for Children, Perth, Australia); J.L. Hankinson (Hankinson Consulting, Valdosta, GA, USA); A.J. Henderson (University of Bristol, Bristol, UK); M. Gappa and the LUNOKID study group (Children’s Hospital and Research Institute, Marienhospital Wesel, Germany); G.S. Kerby and the Lung Function Measures in Preschool Children with Cystic Fibrosis study group (University of Colorado Denver School of Medicine Pulmonary Medicine, The Children's Hospital, Aurora, CO, USA); J. Kühr (Klinik für Kinder- und Jugendmedizin, Städtisches Klinikum Karlsruhe, Karlsruhe, Germany); S. Kuster (Lungenliga Zürich, Zürich, Switzerland); A. Langhammer (HUNT Research Centre, NTNU, Verdal, Norway); S. Lum (Portex Respiratory Unit, UCL, Institute of Child Health, London, UK); W. Nystad (Division of Epidemiology, Norwegian Institute of Public Health, Oslo, Norway); P. Piccioni (SC Pneumologia CPA ASL Torino 2, Torino, Italy); F. Pistelli (Pulmonary and Respiratory Pathophysiology Unit, Cardiothoracic Dept, University Hospital of Pisa and Pulmonary Environmental Epidemiology Unit, CNR Institute of Clinical Physiology, Pisa, Italy); P.H. Quanjer (Dept of Pulmonary Diseases and Pediatrics, Erasmus Medical Centre – Sophia Children’s Hospital, Erasmus University, Rotterdam, the Netherlands); M. Rosenthal (Royal Brompton Hospital, London, UK); S. Stanojevic (Portex Respiratory Unit, UCL, Institute of Child Health, London, UK); J.B. Soriano (Program of Epidemiology and Clinical Research, CIMERA, Recinte Hospital Joan March, Illes Balears, Spain); W. Tomalak (Dept of Physiopathology of Respiratory System, National Institute for TBC and Lung Disease, Rabka Branch, Poland); S.W. Turner (Dept of Child Health, University of Aberdeen, Aberdeen, UK); D. Vilozni (Pediatric Pulmonary Units of The Edmond and Lili Safra Children's Hospital, Sheba Medical Center Ramat-Gan and Meyer Children's Hospital of Haifa, Rambam Medical Center, Haifa, Israel); H. Vlachos (Dept of Pediatrics, Division of Respiratory Medicine, University of Sherbrooke, Quebec, Canada); S. West (Respiratory Function Laboratory, Westmead Hospital, Australia); and D. Zagami (Lung Function Laboratory, Gold Coast Hospital, Southport, QLD, Australia).
The following individuals/centres share datasets (occasionally more than one) with the Global Lungs Initiative, centres that formed the Asthma UK initiative are marked with an asterisk. O. Al-Rawas (Oman); M. Badier (France*); C. Beardsmore (UK*); H. Ben Saad (Tunisia); B. Brunekreef (the Netherlands); P. Burney (UK); W. Dejsomritrutai (Thailand); H. Eigen (USA*); B. Fallon (Australia); A.M. Fulambarker (USA); M. Gappa (Germany*); M. Gerbase (Switzerland); M. Golshan (Iran); C. Gore (Australia); G. Hall (Australia*); J.L. Hankinson (USA*); J. Henderson (UK); M.S.M. Ip (China); S. Karrasch (Germany); G. Kerby (USA*); J. Kühr (Germany); S. Kuster (Switzerland); A. Langhammer (Norway); S. Lum (UK*); A.L. Miller (USA); W. Nystad (Norway*); Y.M. Oh (South Korea); W-H. Pan (Taiwan); R. Perez-Padilla (Mexico); P. Piccioni (Italy*); F. Pistelli (Italy); Prasad KVV (India); P.H. Quanjer (the Netherlands); M. Rosenthal (UK*); S. Stanojevic (UK*); J.B. Soriano (Spain); F. Thomas (France); W. Tomalak (Poland*); Y. Trabelsi (Tunisia); S.W. Turner (UK*); D. Vilozni (Israel*); H. Vlachos (Canada*); R. Warshaw (USA); S. West (Australia); D. Zagami (Australia); and J.P. Zheng (China*).
We would like to thank M. Bottai and C. Schindler for undertaking an independent statistical review of this paper.
Footnotes
This article has supplementary material available from www.erj.ersjournals.com
Statement of Interest
None declared.
- Received July 13, 2010.
- Accepted August 12, 2010.
- ©ERS 2011
REFERENCES


