


Abstract
It is unclear to what extent the same set of environmental or genetic factors regulate objective intermediate asthma phenotypes. We examined heritabilities of these phenotypes and estimated their environmental and genetic overlap.
We studied baseline lung function (forced expiratory volume in 1 s (FEV1), forced vital capacity (FVC) and FEV1/FVC), bronchial hyperresponsiveness, number of positive skin prick tests (SPT) to 11 allergens, serum total immunoglobulin (Ig)E, number of positive specific IgE tests to four allergens and eosinophil counts. 103 twin pairs were studied (46 monozygotic and 57 dizygotic; mean age: 22.5 yrs, range: 17.0–27.0 yrs). Univariate and bivariate genetic analyses were performed after adjustment for significant covariates.
All intermediate asthma phenotypes showed significant heritabilities (47–83%). Most phenotypes were substantially correlated, which was mainly due to shared genetic factors. Pairs of phenotypes with the largest genetic correlations were specific IgE and SPT (0.98), and total IgE with specific IgE (0.87), with SPT (0.72), and with eosinophils (0.62). SPT showed significant environmental correlations with total IgE (0.65), specific IgE (0.70) and bronchial hyperresponsiveness (0.44).
Genetic effects explain the majority of the variation in objective intermediate asthma phenotypes. Additionally, correlations between pairs of these traits are also mainly explained by genetic rather than environmental factors.
Asthma afflicts millions of people worldwide and is caused by multiple genetic and environmental factors. There has been a strong interest in searching for susceptibility genes for asthma, driven by the prospect of better disease prevention, diagnosis and treatment. However, studies on the genetics of asthma are complicated, since there are difficulties in standardising the diagnosis of asthma 1, 2. Most current genetic studies have concentrated on asthma associated with atopy, defined in a number of different ways: by elevated total serum immunoglobulin (Ig)E levels and/or positive skin prick tests (SPT) to one or more allergens. The binding of >IgE to its receptors results in mast cell activation and eosinophil recruitment, another asthma-related phenotype. Bronchial hyperresponsiveness, the increased bronchoconstrictor response to nonallergic stimuli is a pre-requisite for an asthma diagnosis 3. These measurable and biological markers, so-called intermediate phenotypes, such as IgE levels, SPT, eosinophils and bronchial hyperresponsiveness, underlie the pathophysiology and clinical expression of asthma 4. They are more objective, accurate, and more informative to use in genetic analyses than clinical definitions or doctor's diagnosis of asthma. So far, only how far these intermediate phenotypes are driven by similar or different genetic or environmental factors has been studied.
Twin and family studies are widely used to estimate genetic and environmental contributions to atopic disease 5, 6. The multivariate classical twin design can help to estimate the degree to which the same genetic and environmental factors influence different intermediate phenotypes 7. If there is overlap in genes for two traits it is expected that the cross-twin cross-trait correlation will be higher in monozygotic (MZ) twins than in dizygotic (DZ) twins for these traits. Using this information cannot only widen our understanding of atopic comorbidity, it can also enhance gene-mapping efforts 6 and consequently enable us to understand the interplay between different pathways underlying asthma, benefitting the discovery of targeted treatments and interventional measures.
The aims of the current study were to estimate the relative influence of genetic and environmental factors on objective intermediate asthma phenotypes and, more importantly, to what extent correlations between these intermediate phenotypes can be explained by genetic and/or environmental factors using a sample of 103 young Dutch twin pairs.
METHODS
Subjects
The families participating in the asthma study were a sample of a larger number of Dutch twin families who participated in the Netherlands Twin Register (NTR), an ongoing survey study of health-related behaviour 8–10. The NTR represents a random sample of Dutch families with twins, recruited from city council registrations. We selected families in which twins were aged ≥18 yrs and who reported at least one member with a history of asthma. In total, 102 families participated, contributing 103 twin pairs (one family contributed two twin pairs) of which 46 pairs were MZ and 57 pairs were DZ, of which 26 pairs were of opposite sex (for details see the supplementary material). Zygosity was determined by DNA fingerprinting (Sequana, San Diego, CA, USA and TNO, Leiden, The Netherlands). The study was approved by the institutional review board and all subjects provided written informed consent.
Measurements
We used the European Community Respiratory Health Survey questionnaire to define the symptoms presented in table 1 (e.g. asthma, cough, wheeze and dyspnoea, etc.).
Lung function test
Lung function was measured using pneumotachographs (Vmax series, Sensor Medics Co., Yorba Linda, CA, USA) according to the guidelines of the American Thoracic Society 11. Each twin pair was tested on the same day and at the same time of day. Forced vital capacity (FVC) measurement was followed by measuring of the forced expiratory volume in 1 s (FEV1). Three measurements were made until at least two satisfactory measurements were produced; the highest values being taken as baseline value. The ratio of FEV1 and FVC was used to determine the degree of airway obstruction.
Bronchial hyperresponsiveness
Bronchial hyperresponsiveness (BHR) was measured on a DeVilbiss 646 nebuliser (Devilbiss Co., Somerset, PA, USA) using the standardised protocol described by Cockcroft et al. 12, based on 2-min inhalations of doubling concentrations of methacholine of 0.03–160 mg·mL-1 (see the supplementary material). The methacholine provocation concentration producing a 20% fall in FEV1 (PC20) was determined using linear interpolation of the last two points of the concentration-response curve 13.
Skin prick test
Skin prick tests were performed using allergen-coated lancets for 11 common allergens: house dust mite, storage mite, mixed tree pollens, mixed grass, weed, cat, dog, horse, hair, feathers and moulds. A participant was defined as atopic if at least one of these allergens tested elicited a mean wheal diameter ≥3 mm 14 and the negative control had a mean wheal diameter <1 mm.
Measurements of total serum IgE, specific IgE and eosinophil counts
Measurements methods of serum total IgE and specific IgE are described in the supplementary material. Peripheral blood eosinophil counts were performed by flow cytometry.
Analytical approach
The aims of our analyses were two-fold. First, we estimated the relative influence of genetic and environmental factors on observed phenotypic variance in eight objective intermediate asthma phenotypes separately and investigated sex differences in genetic architecture. Secondly, we assessed to what extent phenotypic correlations between these phenotypes can be explained by genetic and/or environmental factors. We used bivariate modelling to estimate cross-trait correlations and to partition these into genetic and environmental components.
Twin correlations and heritability estimates
Most phenotypes were adjusted for covariates prior to the estimation of twin correlations and model fitting. FEV1, FVC and FEV1/FVC were adjusted for age, sex, height and smoking. PC20 was adjusted for age and sex. Total IgE and eosinophil counts were log-transformed to obtain normal distribution and both were adjusted for age and sex.
Pearson correlations were calculated for continuous traits. Polychoric correlations were calculated for ordinal traits (i.e. PC20, SPT and specific IgE) under a liability-threshold model 7, 15 (for details see the supplementary material). Although PC20 was measured as a continuous variable, it could not be normalised in our study. Therefore, we recoded PC20 into an ordinal variable with six categories. Lower recoded values represent higher actual values (e.g. 0 represented 160 mg·mL-1), indicating a lower bronchial responsiveness. SPT and specific IgE were also defined as ordinal variables with six and four categories, respectively, based on the total number of positive responses. Heritabilities for all traits were estimated using univariate genetic model fitting techniques.
Genetic modelling of twin data
We used model fitting analyses of twin data 16, a technique based on comparison of covariances (or correlations) in MZ and DZ twin pairs, which allowed a separation of the observed phenotypic variance into its genetic and environmental components (fig. 1): additive or dominant genetic components and common or unique environmental components. The unique environmental component also contains measurement error. Dividing each of these components by the total variance yields the different standardised components of variance, for example, the heritability (h2) can be defined as the proportion of the total variance attributable to additive genetic variation.

Path diagram for a univariate model. An opposite-sex twin pair is shown, twin 1 (left) being male and twin 2 (right) female. Observed phenotypes (P) for twin 1 and twin 2 are shown in squares, latent (i.e. unmeasured) factors are shown in circles: A: additive genetic factor; C: common environmental factor; E: unique environmental factor; rg is the correlation between A, which is 1 in monozygotic (MZ) twins and 0.5 in dizygotic (DZ) same-sex twins, while rc is the correlation between C, which is 1 in MZ twins and DZ same-sex twins. rg and rc can be estimated for DZ opposite-sex twins. Regression coefficients of observed variables on the different latent factors are shown in lower case: h: additive genetic effect; c: common environmental effect; e: unique environmental effect; k: scalar factor. Heritabilities are constrained to be equal across sexes in this model, but total variances may be different. All (nonstandardised) variance components for females were constrained to be equal to a scalar multiple, k2, of the male variance components. Dominance genetic influence was also tested but is omitted to simplify the diagram.
The existence of sex differences in the influences of genetic and environmental factors on the phenotype can take several forms 16 (see the supplementary material). A path diagram of the applied twin model is shown in figure 1; k is the scalar factor that indicates that the total variance of the phenotype might differ between males and females.
Bivariate genetic models
In order to estimate genetic and environmental influences on the association between these intermediate asthma phenotypes, a bivariate Cholesky decomposition 16 was used to model the covariance between any two of them (fig. 2). This model allows determination of the extent to which the covariance (or phenotypic correlation (rp)) can be explained by genetic and/or environmental factors influencing both phenotypes under study (see the supplementary material). The genetic correlation (rg) between two traits gives an indication of the amount of overlap between (sets of) genes influencing those traits and ranges from -1 to 1. If rg is 1, then the same genes influence both traits. A correlation of 0 indicates that both traits are affected by a different set of genes. The positive or negative genetic correlation reflects positive or negative association between any two traits. Common and unique environmental correlations between two traits are calculated in a similar way (fig. 2). In order to include both continuous and ordinal (PC20, SPT and specific IgE) variables into the same bivariate model, we recoded continuous variables to ordinal ones with 10 categories.

Genetic and environmental correlations and factor loadings of the best fitting bivariate model for any two asthma-related traits. For clarity, only one twin is depicted. Factor loadings (or path coefficients) are expressed as square roots to make clear that squaring of those factor loadings yields estimates of genetic and environmental variance components, as shown in the text. G: additive genetic factor; h2: heritability; e2: unique environmental variance component; E: unique environmental factor; rg: genetic correlation, re: environmental correlation.
Model fitting procedure
Models were fitted to the raw data using normal theory maximum likelihood allowing inclusion of incomplete data (i.e. when data were only available in one twin of a pair). Depending on the correlation pattern for MZ and the DZ twins, the genetic model fitting started with either an ACE (additive genetic, common environmental, unique environmental) model (if twice the DZ correlation was larger than the MZ correlation) or an ADE (additive genetic, dominance genetic, unique environmental) model (if the DZ correlation was less than half the MZ correlation). The significance of variance components, additive genetic, common environmental or dominance genetic, was assessed by testing the deterioration in model fit after each component was dropped from the full model. Standard hierarchic Chi-squared tests were used to select the best fitting models 16 in combination with Akaike's information criterion (AIC = χ2-2 degrees of freedom). The model with the lowest AIC reflects the best balance of goodness-of-fit and parsimony.
Statistical software
Effects of sex and other covariates on mean values were tested by generalised estimating equations (GEE). GEEs take the non-independence between twins into account and yields unbiased standard errors and p-values 17. Data handling, preliminary analyses, and GEEs were performed with STATA software (StataCorp., College Station, TX, USA). Polychoric correlations were calculated and genetic modelling performed with Mx software (Virginia Institute for Psychiatric and Behavioral Genetics, Virginia Commonwealth University, Richmond, VA, USA), a computer program specifically designed for the analysis of twin and family data 18.
RESULTS
Table 1 shows the characteristics of the male and female twins. The mean age of the population was 22.5 yrs (range 17.0–27.0 yrs). The total number of asthmatics was 108 individuals. As shown in table 1, age, body mass index and current smoking status were comparable in males and females. Males were taller and heavier than females and showed significantly higher FEV1, FVC and PC20 values but lower FEV1/FVC values compared with females. Females reported more often to have dyspnoea at night and used medication more often than males. None of the traits showed significant differences between MZ and DZ twins.
Table 2 presents the twin correlations of the objective intermediate asthma phenotypes by zygosity groups. Twin correlations were collapsed across sex, because heritability estimates were not significantly different between males and females (see below and table 3). MZ correlations were consistently higher than DZ correlations, indicating an important contribution of genetic factors. Parameter estimates and 95% CIs of these best-fitting models are presented in table 3. All univariate models of the eight objective asthma-related phenotypes showed significant heritabilities (h2 range: 47–83%). A significant scalar sex effect (fig. 1) was found for FEV1, with males showing larger variability than females.
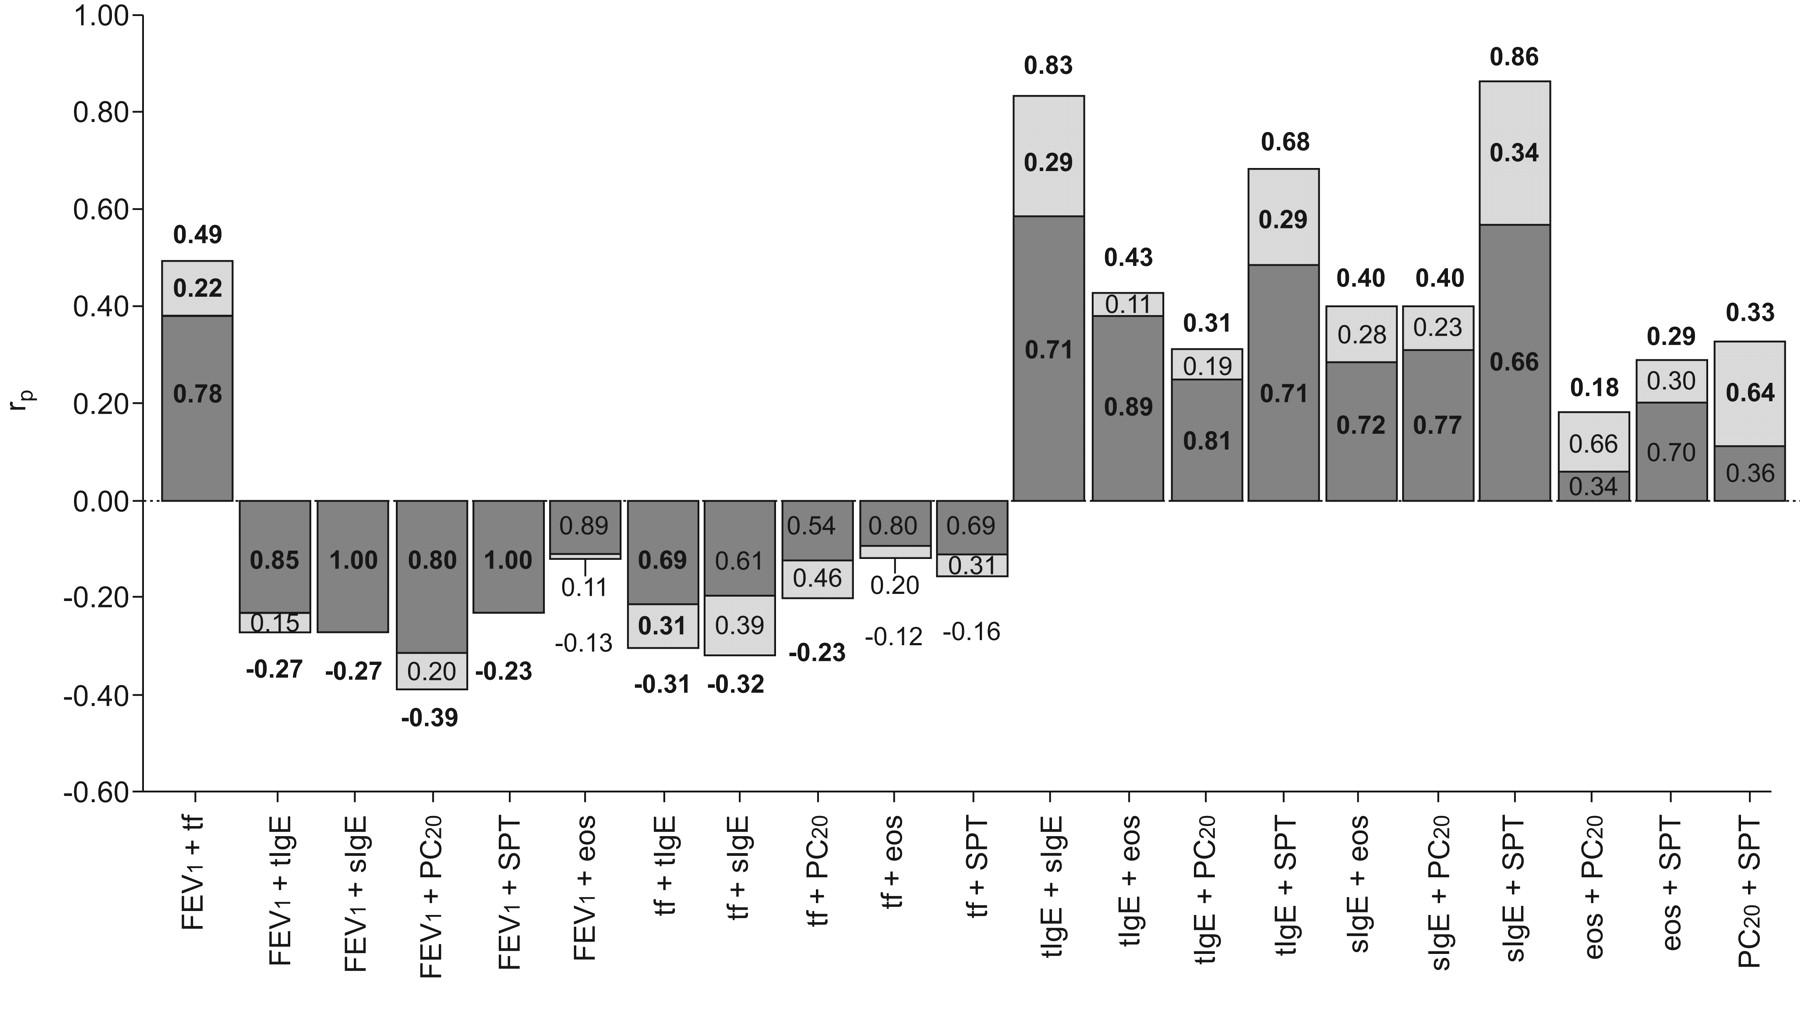
Subsequently, we performed bivariate model fitting to estimate cross-trait correlations and investigate to what extent these correlations can be explained by shared genetic or shared environmental factors influencing both phenotypes (table 4 and fig. 3). There were negative cross-trait correlations between lung function variables and all other traits. That is, atopy and BHR were related to lower lung function levels. Phenotypic correlations ranged 0.18–0.86 (irrespective of the sign). The strongest correlations were among serum total IgE, specific IgE and SPT (range 0.68–0.86). There were nonsignificant correlations of eosinophil counts with FEV1 (-0.13) and FEV1/FVC (-0.12), and of SPT with FEV1/FVC (-0.16).

Bivariate analyses for objective intermediate asthma phenotypes. The height of the bars in the figure corresponds to the magnitude of the phenotypic correlations (rp). The bars are partitioned into components reflecting proportions of rp that are accounted for by genetic (▒) and environmental (░) factors. FEV1: forced expiratory volume in 1 s; Ig: immunoglobulin; PC20: provocative concentration causing a 20% fall in FEV1; SPT: skin prick test; FVC: forced vital capcity; tf: FEV1/FVC; tIgE: serum total IgE; sIgE: specific IgE; eos: eosinophils. Significant correlations are shown in bold.
Serum total IgE showed significant genetic correlations with all other traits (range -0.32–0.87). Specific IgE also presented high genetic correlations with most traits (range -0.46–0.98) and especially a very high correlation with SPT (0.98). Similarly, substantial genetic correlations of FEV1 were observed with FEV1/FVC (0.52), PC20 (-0.51), specific IgE (-0.46) and SPT (-0.43). By contrast, eosinophil counts showed significant genetic correlations with total IgE (0.62) and specific IgE (0.50) only.
Compared with genetic effects, fewer environmental correlations were significant. FEV1 and FEV1/FVC were environmentally correlated (0.43), as were FEV1/FVC and total IgE (-0.31), and SPT and PC20 (0.44). Total IgE, specific IgE and SPT showed considerable environmental overlap with each other (range 0.65–0.77).
Figure 3 presents the results that decompose the phenotypic correlation into common genetic and environmental factors. These results confirm the expectation that much of the phenotypic correlations between these objective asthma-related traits are attributable to genetic factors, except for the correlation between PC20 and SPT, which is mainly attributable to environmental factors.
DISCUSSION
The aim of this study was to estimate the relative influence of genetic and environmental factors on individual differences in eight objective intermediate asthma phenotypes including baseline lung function (FEV1, FVC and FEV1/FVC), BHR, positive SPT, serum total and specific IgE, and eosinophil counts of importance, we investigated environmental and genetic overlap between these phenotypes in a subsample of young twins from the NTR. In addition to the findings of genetic effects accounting for a substantial portion (≥47%) of the variation of all asthma phenotypes, the main finding of our study was that these objective intermediate asthma phenotypes had significant cross-trait correlations, which were predominantly explained by genetic rather than by environmental factors.
We observed heritabilities of 61–83% for lung function phenotypes; higher than in previous reports 19, 20. This may be due to the somewhat younger age of our cohort of twins, in which environmental factors, such as smoke exposure may have had less influence. The current study is one of the few focusing on comprehensive clinical markers of allergy, thereby showing that the heritability of specific IgE is 0.60 in twins when analysing it as ordinal variable based on the sum score of the positive responses to four allergens. Few twin studies have included SPT 19, 21 and heritability estimates were not consistent (0.49 versus 0.85). We also analysed SPT as an ordinal variable and found a heritability of 0.56. We did not find any sex effect on heritability of these traits, except for a significant scalar effect with FEV1, males showing larger variability than females.
We did not find any evidence for environmental factors contributing to intermediate phenotypes that are shared among twins of a pair, probably due to gene–environment interactions. It is likely that environmental risk factors trigger asthma only in subjects with a larger genetic susceptibility for allergic and asthmatic diseases. Evidence for linkage between certain chromosomes and asthma were, for example, only found in those who where exposed to cigarette smoke in early childhood; in other words, certain genes may be expressed only upon environmental exposure 22–24. These results emphasise the importance of considering environmental information in genetic studies of asthma and its related traits.
A specific focus of this paper was to explore both genetic and environmental correlations between objective intermediate asthma phenotypes by performing bivariate variance components analyses. In this way, all traits associated with allergy, e.g. BHR, eosinophils, total and specific IgE, and SPT, presented significant cross-trait correlations. Thus, our findings support the pathophysiological connection arising from shared genetic determinants. The genetic correlation between eosinophils and total IgE (0.62) that we found fits with the finding of genetic linkage of eosinophilia to 2q33 25, a region previously reported to be linked with serum total IgE 26, and is also in accordance with previous findings 27 that 2q24–32 showed evidence of linkage for both eosinophils and total serum IgE in Dutch families. Furthermore, the latter study showed considerable genetic overlap among total IgE, specific IgE and SPT. Specific IgE and SPT were linked to chromosome 17q25 and 22q11, and total IgE and specific IgE to chromosome 7q11–q12 27. Interestingly, there were comparatively strong genetic overlaps of FEV1 with PC20 and SPT as well as FEV1/FVC. These results are in accordance with previous findings, which have reported that FEV1, atopy and BHR were all linked to chromosome 20q13. This linkage may result from a quantitative trait locus in this region that affects several asthma-related traits 28.
Bivariate analyses also showed that a smaller number of phenotypes had significant environmental correlations. In accordance with findings of Ferreira et al. 19, we found that there were environmental correlations of SPT with both specific IgE and PC20, indicating that exposure and sensitisation to aero-allergens are fundamental for development of both asthma and rhinitis. This is plausible, given the observation that inhalation of allergens to which an individual is allergic induces a more severe hyperresponsiveness, or even renders an individual hyperresponsive during the allergic season 29–31. However, the fact that unique genetic and environmental effects were also present for any pairs of traits (i.e. genetic or environmental correlation were not equal to 1) indicates that they are still distinct intermediate phenotypes, even though their genetic or environmental aetiology is partly the same.
A strength of our study is that we have analysed noncontinuous traits (specific IgE, PC20 and SPT) as ordinal variables (more than two categories) using a threshold model 7, 32, whereas similar previous studies merely analysed these as binary (yes/no) traits. It is known that threshold models of ordinal traits are more powerful for detecting additive genetic or common environmental factors 33.
Finally, some limitations need to be considered. First, the ratio of MZ pairs to DZ pairs (46:57) was higher than in the general population 34. However, oversampling of MZ twins was done on purpose to achieve similar group sizes of MZ and DZ twins, as is commonly applied in volunteer twin studies. Apart from a slightly lower power to detect common environmental factors 34, this is unlikely to have influenced results or generalisability of the study. Secondly, selective ascertainment of families was present in our study. Subjects studied only came from families with twins aged ≥18 yrs with at least one member (twins or their parents) reported a history of asthma, leaving us with a fraction of the original sample. Although this potentially may have impact on the estimates, a previous study comparing the heritability estimates in selected samples with those in the entire original sample 35, indicated that using the entire or selected sample gave very similar heritabilities.
In conclusion, genetic effects account for a substantial part of the variation in all objective intermediate asthma phenotypes. The correlations between pairs of these traits are, to a large extent, explained by genetic effects influencing both phenotypes. Environmental factors also contributed to the clinical homogeneity between asthma traits, but to a smaller extent. These findings enlarge our knowledge on the genetic and environmental origins of clinical homogeneity for these objective asthma phenotypes, and provide important clues and directions for gene-finding studies.
Footnotes
Statement of Interest
None declared.
↵This article has supplementary material available from www.erj.ersjournals.com
- Received August 4, 2009.
- Accepted December 20, 2009.
- ©ERS 2010
REFERENCES


