


Abstract
The aim of this study was to determine whether long-term air pollution exposure is associated with clinical phenotype in α1-antitrypsin deficiency.
In total, 304 PiZZ subjects underwent full lung function testing and quantitative high-resolution computed tomography to identify the presence and severity of the disease. Mean annual air pollutant data for 2006 was matched to the location of patients' houses and used in regression models to identify phenotypic associations with pollution, controlling for covariates. Relative trends in pollution levels were assessed to validate use of a single year's data to indicate long-term exposure.
Pollutant levels correlated significantly with one another, with higher levels of primary particles, SO2 and NO2 being associated with lower ozone levels. Regression models showed that estimated higher exposure to ozone was associated with worse gas transfer and more severe emphysema. Regression parameters suggested that significance from other pollutants was due to collinearity with ozone. The 2006 pollutant levels showed linear relationships with cumulative years, thus validating the model.
Higher exposures to ozone may be associated with worse respiratory status in α1-antitrypsin deficiency, identifying a group susceptible to ambient air pollution.
Adverse health effects have been linked to air pollution by both epidemiological and toxicological studies. Two major studies have linked long-term exposure to particulate matter with deaths from lung cancer and cardiorespiratory disease 1, 2. Time-series studies have shown mortality effects from short-term exposure to particulate matter 3 and from particles 4, 5, ozone 6, 7 and SO2 4, 8 on hospital admissions and lung function. Two UK reports on the long-term effects of major pollutants have estimated the overall health burden attributable to pollution, thus allow the UK government to consider which pollutants may need most control in future and, therefore, allow them to set recommendations 3, 4. The World Health Organization and the American Thoracic Society have identified permanent reduction in lung function as an important outcome potentially related to air pollution, and recognise that genetic factors may be important in determining such effects 5, 6.
α1-Antitrypsin deficiency (α1-ATD) is a genetic disorder that predisposes to the development of chronic obstructive pulmonary disease (COPD), and is classically associated with basal emphysema 7. Subjects with α1-ATD sustain lung damage as a result of the relatively unopposed action of neutrophil elastase, which degrades lung elastin 8. This process leads to a greater disease burden in subjects exposed to inflammatory stimuli, predominantly cigarette smoke 7. Other environmental agents, predominantly relating to occupation, may influence lung function in α1-ATD 9, 10, but air pollution effects have not been reported. Pollutants may contribute to lung disease by inflammatory, elastase predominant pathways or by mechanisms relating to oxidative stress 11. By studying subjects with α1-ATD it may be possible to elucidate which pollutants contribute to disease by elastase dependent mechanisms, as their effects may be more marked in α1-ATD. Herein, we report the associations between air pollution and disease severity in subjects from the UK α1-ATD registry.
MATERIALS AND METHODS
Study subjects
All PiZZ subjects from the UK α1-ATD registry were studied. Subjects were divided into two groups, those who had never moved from their place of birth and those who had. Those who had never moved (n = 304) were studied with regard to pollution exposure and compared, in terms of clinical and demographic data, to those who had moved. Residential history was ascertained by asking for place of birth, current and previous addresses. Subjects were recruited to the registry by referrals from primary and secondary care and family screening. The PiZZ genotype was confirmed by specific PCR (Heredilab, Salt Lake City, UT, USA). Ethical approval was given by the local ethics committee (South Birmingham, UK). None of the subjects had ever received α1-antitrypsin replacement. The incidence of vascular disease and malignancy (comorbidities potentially related to pollution) was noted alongside smoke exposure and lifelong occupational history. Clinical data were collected in 2006.
Study design
This is a cross-sectional study examining association of outdoor air pollution with respiratory phenotype in α1-ATD.
Methods
Clinical phenotyping
The α1-ATD subjects performed lung function tests and underwent high-resolution computed tomography scanning of the chest as described previously 12. The presence of emphysema was determined from the visual appearance of the scan and its severity by density mask analysis of slices at the level of aortic arch, representing the upper zone, and at the inferior pulmonary vein, representing the lower zone, using a threshold of -910 HU. This is the most sensitive level for detection of emphysema, deemed to be optimal by Muller et al. 13, and validated against physiological measures in α1-ATD 14.
To assess the relationship between occupational exposure and risk of lung damage an occupational hygienist created a job exposure matrix 15 using Standard Occupational Classifications 2000, generated using the computer assisted structured coding tool 16 system. Job codes were divided into three groups according to the likelihood and probable intensity of exposure to agents known to cause occupational lung disease. Patients' who had worked at any time in a job where the exposure intensity was likely to be <30% of the workplace exposure limit 17 were classed as low risk, with intensities above this being deemed high risk. Those who had never worked in an exposure prone job were classed as zero risk.
Patients' addresses from the year of pollution data collection (2006) were mapped to ordinance survey co-ordinates using the National Statistics Postcode Directory 18, which also lists a census classification into urban/rural dwelling. The census was also used to obtain the Carstairs deprivation index at the ward level for each subject's address. The clinical characteristics of the subjects are shown in table 1⇓. The distribution of residences across the UK, the most common high-risk professions observed, and their frequency in comparison to the UK population are shown in the supplementary material.
Demographic and clinical features of the patient group
Pollution data
Annual mean data for SO2, NO2, oxides of nitrogen (NOx), particles with a 50% cut-off aerodynamic diameter of 10 µm (PM10) and secondary particles were obtained from geographical information system (GIS) maps for 2006 together with AOT40 (ozone μg·m−3·h−1) and days of ozone >120 μg·m−3. AOT40 represents accumulated ozone dose, being the sum of the differences between the hourly mean and 40 ppb ozone concentrations for daylight hours exceeding this limit. Levels of primary particles were calculated by subtracting secondary particles from PM10.
GIS maps detail pollutant levels on a 1 km×1 km grid across the UK, using data from the National Atmospheric Emissions Inventory and a combination of modelling methods, including dispersion kernel approaches and weighted regression analyses. Where appropriate, the levels take into account major industrial sources and roadside increments. This methodology and its validity are described in detail elsewhere 19, 20. These measures were used as indicators of long-term exposure to each pollutant. Pollutant levels were mapped to patients using the ordinance survey co-ordinates from the grid.
For each associated pollutant the relationship of current levels to that of previous years was checked using data from 1993, 2003 and 2005 and correlated with current levels.
Statistical analysis
Data were analysed using SPSS (version 12; SPSS Inc., Chicago, IL, USA). Pollutants were compared between settlement types using the Kruskal–Wallis test. Spearmans' rho was used to check correlations between pollutants. Linear regression models were used to assess the effect of NO2, SO2, primary particles and ozone (AOT40) on forced expiratory volume in 1 s (FEV1), FEV1/forced vital capacity (FVC), transfer coefficient (KCO), and the upper and lower zone voxel index (UZVI and LZVI, respectively). Regression models were adjusted for pack-yrs smoked, age, sex, level of occupational risk and level of social deprivation. Subjects who had never moved were compared to those who had moved using the Mann–Whitney U-test, an unpaired t- test and Chi-squared test as appropriate.
RESULTS
Pollutant spatial distribution and inter-relationships
All pollutants except secondary particles differed across census settlement types (all p<0.0001), as shown in table 2⇓. Ozone was greater in rural locations, whilst others were greater in urban areas. The two ozone metrics correlated well, whilst NO2 and NOx showed a curvilinear relationship (both p<0.0001). Significant relationships between all other pollutants were also present (all p<0.0001). Data pertaining to these analyses is shown in figure 1⇓.

Intra-pollutant and interpollutant correlations. a, b) Correlations between measurements pertaining to the same pollutant, being for nitrogen oxides and their derivative, NO2 and ozone, respectively. Both correlations are significant (p<0.001). c–e) Positive correlations observed between NO2, primary particles and SO2, again all are significant (p<0.0001). f–h) Negative correlations between these pollutants and ozone, again all are significant (p<0.0001). AOT40 represents accumulated ozone dose, being the sum of the differences between the hourly mean and 40 ppb ozone concentrations for daylight hours exceeding this limit. a) r = 0.98, b) r = 0.85, c) r = 0.93, d) r = 0.60, e) r = 0.59, f) r = -0.41, g) r = -0.49, h) r = -0.37.
Pollutant distribution across census classes
Regression models
Each regression model was first constructed without pollution data, in order to ascertain associations with demographic features. Only those that were significant were included in subsequent multiple regression models, which included pollutants. Increasing age and cigarette smoke exposure were associated with lower KCO, FEV1 and FEV1/FVC and with worse computed tomography densitometry, the r2 values showed that smoking accounts for 6% of variability in KCO and FEV1/FVC, 16% of FEV1 variability, 2% of UZVI variability and 12.7% of LZVI variability. Male subjects had lower FEV1/FVC and more severe emphysema as measured by densitometry. Neither occupational risk nor social deprivation made a significant contribution to any of the regression models, although these variables were added after adjustment for smoking.
Single pollutant models were used in the regressions because of multi-collinearity between pollutants. AOT40 was used to represent ozone exposure. Although primary particles, NO2 and SO2 contributed significantly to regression models the B-values suggested that lung function and computed tomography densitometry were better in the presence of high levels. Conversely, the values for ozone showed that KCO was lower, and FEV1/FVC, UZVI and LZVI were higher with increasing ozone levels, with the urban–rural difference in ozone (table 2⇑) being associated with a 2% decrease in KCO. Addition of ozone to the model accounted for 1% of KCO variability and 2% of both UZVI and LZVI variability. The regression results are summarised in table 3⇓.
Pollutant regression models
Relationship of current to previous years' ozone levels
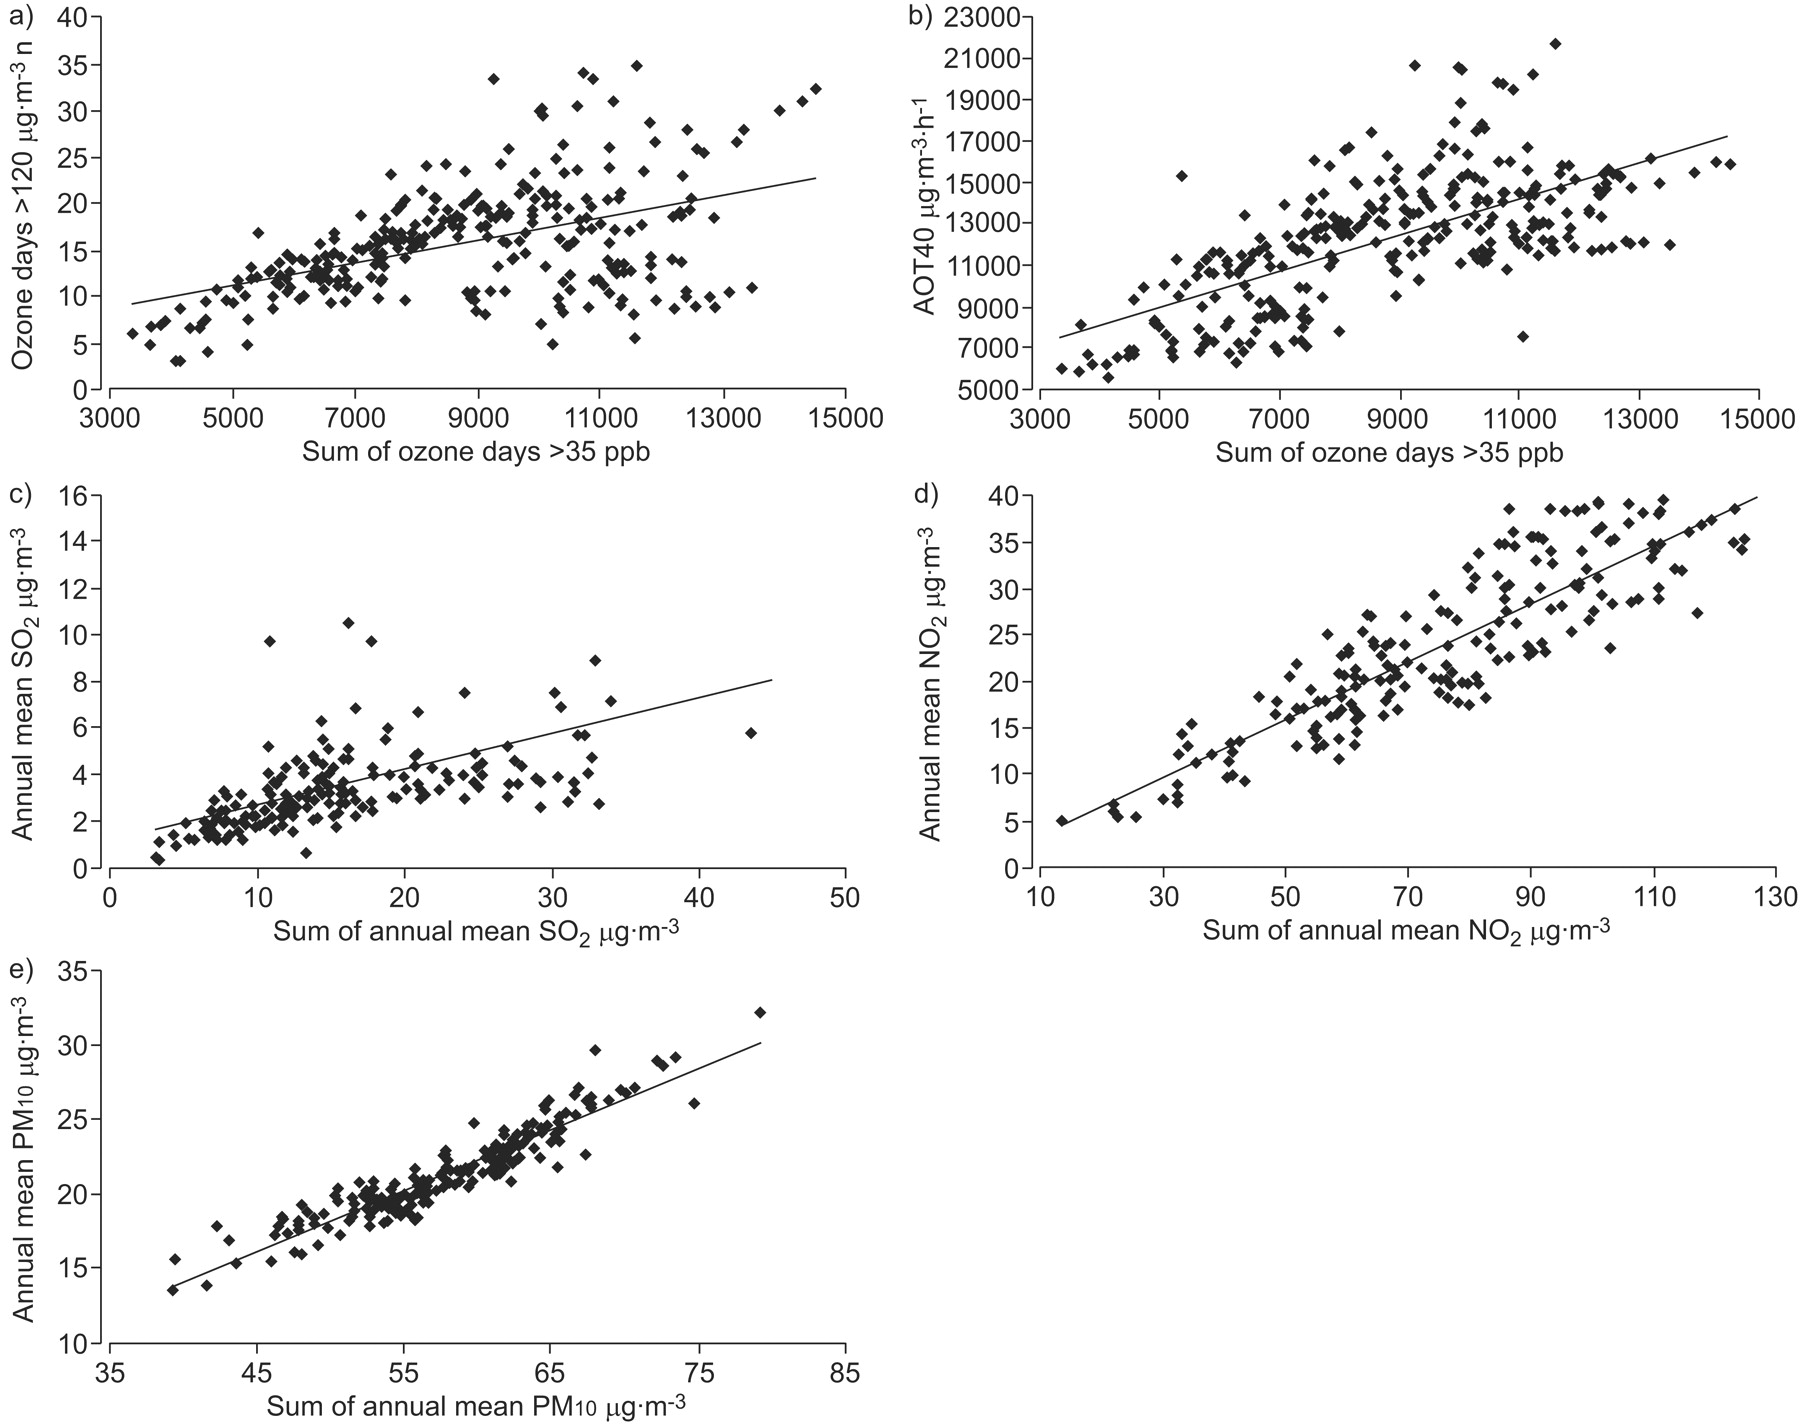
Analysis of pollutants from 1993, 2003 and 2005 showed lower levels of ozone, NO2 and SO2 in 2005 than in 1993 (p<0.0001). There were no data pertaining to secondary particles from previous years, thus it was not possible to assess primary particles; however, PM10 values were available and were higher in more recent years (mean±sem 18.25±0.17 versus 22.04±0.18 μg·m−3; p<0.0001). The cumulative ozone values correlated well with those from 2006, regardless of the metric used (both p<0.0001), even though AOT40 showed a closer relationship than ozone days >120 μg·m−3 (r = 0.68 versus 0.44). The correlations are shown in figure 2⇓.

Correlation between pollutant levels in 2006 and cumulative pollutant levels. a, b) Correlations between the two ozone metrics available for 2006 and the cumulative measure taken from 1993, 2003 and 2005. c–e) Correlations between 2006 levels of SO2, NO2 and particles with a 50% cut-off aerodynamic diameter of 10 µm (PM10) with a similar cumulative measure. AOT40 represents accumulated ozone dose, being the sum of the differences between the hourly mean and 40 ppb ozone concentrations for daylight hours exceeding this limit. All correlations are significant (p<0.0001). a) r = 0.44, b) r = 0.68, c) r = 0.51, d) r = 0.88, e) r = 0.94.
Comparisons of subjects who had moved to those who had not
There was no significant difference in age, sex, smoke exposure or clinical features between the subjects who had never moved from their place of birth and those who had. The Carstairs index was higher in those who had never moved, indicating lower mobility in the more socially deprived. The mean±sem in those who had moved was -0.71±0.29 compared with 0.51±0.19 in those who had not moved (p<0.0001).
DISCUSSION
We have shown an association between a surrogate measure of long-term ozone exposure and lung function in patients with α1-ATD, with higher putative exposures being associated with worsening disease.
The range of pollutants measured in the UK, and the number of measuring stations, has increased over the last 60 yrs 21. This, together with sophisticated statistical modelling methods that can take account of meteorological effects, dispersion from large sources and roads in addition to background pollution levels, has allowed the generation of GIS maps, which resolve pollution levels on a 1 km×1 km grid across the UK. The modelling data have been validated by persons responsible for producing maps and have been published elsewhere 19, 20. The validation data show good correlations between modelled and measured data at either networked or verification sites or both for NO2, PM10 20 and ozone 19, with r2 values for the correlations lying between 0.63 and 0.95. SO2 showed less robust correlations outside network sites 20, probably because the relative contribution of point sources (such as coal burning power stations) is decreasing, which makes the importance of background levels greater than in the past. Less is known about the background sources of SO2 than for the other pollutants considered in the current study, which may have influenced the accuracy of this GIS map. Extensive longitudinal data exist for some, but not all, pollutants. However, for recently added datasets (such as PM2.5) there are relatively few data; therefore, we could not perform longitudinal analyses using cumulative lifetime exposure. Nevertheless, the spatial distribution of pollutants remains relatively constant 22 and our data show a directly proportional relationship between the exposures in 2006 and cumulative exposure. Consequently, a cross-sectional study including only patients who have lived in one area throughout their lives can still give some indication of the effect of lifetime exposure.
The interpretation of our model of pollution on disease assumes that current levels are proportional to total exposure, an assumption that is supported by our data. We have used single pollutant models, which may have some limitations, but are necessary because of interpollutant correlations. For ozone, however, multi-pollutant models do not necessarily improve the direction or degree of associations between exposures and health end-points (H. Walton, Health Protection Agency, UK; personal communication). The apparently beneficial effects of NO2, SO2 and particles seen in our study are most likely attributable to an inverse correlation of their concentrations with those of ozone. An alternative interpretation is that our model is insufficiently representative of long-term exposure to detect effects reliably. Indoor exposure could also be important, since UK subjects spend most of their time indoors. Indoor exposures comprise both indoor sources (such as fuel combustion) and outdoor pollutants diffusing inwards. The extent to which the latter occurs depends on the penetration coefficient, and ventilation and decay rates 23. Therefore, indoor exposure would need to be measured prospectively for each individual. However, for ozone there are no relevant indoor sources and indoor concentrations are likely to reflect outdoor concentrations, thus our findings related to this pollutant are unlikely to be affected. Finally, as with any long-term study, it is possible that the data represents a survivor bias.
Ozone is known to induce airway inflammation, impair host defence to bacterial insults, decrease macrophage activity, impair mucociliary clearance and enhance bronchial hyperresponsiveness 24. These are processes accepted to be important in COPD pathogenesis, any or all of which could account for the observed associations with lung function. α1-antitrypsin levels in the lung rise within an hour of exposure to ozone 25, and provide >80% of the lung's defences in models of ozone induced inflammation 26. This suggests a rationale for enhanced susceptibility to ozone effects in α1-ATD, and lends support to elastase driven pathways being of relevance to ozone exposure. It is conceivable that in α1-ATD this is so pronounced that ill effects from other pollutants are not seen.
Ozone is a secondary pollutant, the levels of which depend less on emissions and more on meteorology and atmospheric effects 21. Since ozone is scavenged by NOx, any intervention controlling NOx, although beneficial in reducing NO2, will also tend to increase ozone. This, together with a rise in background ozone due to transport across the Atlantic, and predicted changes in the UK climate (likely to make it warmer and sunnier), underlie projected increases in ozone over the next 15 yrs 27, 28. This makes it more critical to investigate health effects of ozone, and highlights the importance of our observations.
Our study is strengthened by the detailed clinical assessments performed, and the ability to correct for age, sex, social deprivation, smoke and occupational exposure. This concurs with previous studies that increasing age 29 and cigarette smoke exposure 7 influence phenotype. There was no significant effect of occupation despite a high prevalence of at risk professions. This is a relatively small dataset to confidently exclude an effect of occupational exposure, and it is possible that ascertainment bias influenced results, since high-risk professions were more common than in the UK population. We used an arbitrary workplace exposure limit of 30% (used in most studies of occupational risk) and graded lifetime risk based on any prior or current level of exposure using a matrix. While misclassification is possible with matrices 30, it is a method which could be used more widely to correct for workplace exposure in epidemiological studies. More detailed quantification of risk would require interviews and/or contemporaneous data on risk agents in each work environment. For large scale studies, as needed to assess pollution effects in the general population, this level of risk measurement would be prohibitively complex and expensive. There was also no effect of social deprivation on lung function in our group, although again this is a small dataset for this type of analysis. Nevertheless, it is worth considering the reasons that could underlie this lack of association. We used the smallest available geographical area (i.e. ward level) to determine patients' social deprivation, in order to minimise the risk of misclassification that can occur with the use of large areas, but it remains possible that the measure used is not truly reflective of an individual's level of deprivation. Both smoking and occupation may relate to social deprivation, such that any effect on lung function after adjustment for these variables may be very small, reflecting the importance of smoking in particular in determining lung function. Furthermore, the higher Carstairs index observed in those that had moved away from their place of birth suggests that those affected by deprivation are over-represented in the group relative to all α1-ATD, which may have reduced power to detect an effect of this variable.
Our study has some weaknesses, notably the small size of this group, albeit a large number of α1-ATD cases in terms of the published literature. In addition, although we have constructed a model representative of long-term exposure, we acknowledge that directly measured cumulative exposure would be a superior study design, although this is not possible with the pollution data currently in existence. We were also unable to consider different time windows of air pollution exposure or differences in the impact of absolute exposures levels compared to changes in exposure levels. Such analyses may, however, be more relevant to a fluctuating condition, such as asthma, rather than a relatively fixed condition, such as COPD. Finally, we were unable to adjust for regional differences in pollution, or variation in prescribing patterns across the UK as the dataset was too small for further sub-stratification to be valid.
In summary, we have shown that ozone levels are associated with markers of emphysema severity in a group of genetically susceptible individuals, albeit accounting for only a small proportion of lung function variability. It is now important to determine whether our findings represent a true gene–environment interaction by performing similar analyses in subjects with different α1-ATD phenotypes and in COPD unrelated to α1-ATD.
APPENDIX
Subject locations in the UK
Subjects were recruited from across the UK, as detailed in table 4⇓.
Location of the subjects' residence
High-risk occupations observed in α1-ATD subjects that had never moved
The 10 most common high-risk professions in the subject group are shown in table 5⇓. The frequency of high-risk professions in those subjects still working was compared to that in the UK population using census data, and showed an increased incidence in the α1-ATD subject group (9.45% versus 7.48%; p<0.0001).
Common high-risk professions in the subject group
Support statement
The authors are supported by the Natural Environment Research Council, who had no involvement in study design or conduct, manuscript preparation or submission.
Statement of interest
A statement of interest for this study can be found at www.erj.ersjournals.com/misc/statements.dtl
Acknowledgments
We would like to thank A. Kent at AEA Energy and Environment (Didcot, UK) for providing the GIS maps for pollutant data.
Footnotes
-
This article has supplementary material accessible from www.erj.ersjournals.com
Earn CME accreditation by answering questions about this article. You will find these at the back of the printed copy of this issue or online at www.erj.ersjournals.com/current.dtl
- Received June 10, 2008.
- Accepted March 16, 2009.
- © ERS Journals Ltd
References


