


Abstract
The ability of micro-computed tomography (CT) to noninvasively evaluate allergic pulmonary inflammation in an experimental model was investigated. In addition, two image segmentation methods and the value of respiratory gating were investigated in the context of this model.
Brown Norway rats were exposed to one of four doses of house dust mite (HDM) extract (0, 0.15, 15 or 150 μg) delivered intratracheally every 24 h for 10 days. CT scanning was performed at baseline and after several longitudinal HDM exposures.
Both thoracic- and lung-segmentation methods yielded similar results when standardisation practices were employed. While tissue histology correlated well with CT images, cell counts from bronchoalveolar lavage depicted greater inflammation than did density measures from CT images. Evidence from representative CT slices and transaxial density distribution indicated that inflammation was primarily associated with major airways and extended into the periphery from these focal points. Respiratory gating demonstrated that images of the inspiratory state provided greater contrast of inflammatory processes. Lastly, decreases in tidal volumes indicated significant mechanical respiratory changes in animals exposed to both 15 and 150 μg.
In summary, CT image segmentation can extract pertinent data on in vivo allergic airway/lung inflammation. Furthermore, respiratory gating provides additional contrast and insight into these quantification practices.
Research in experimental models of disease, particularly in vivo, is an essential endeavour, especially as it pertains to revealing disease pathogenesis and developing assessment tools. However, these types of studies also have significant drawbacks. In particular reference to models of asthma, data analyses have largely relied on the invasive collection of biological samples such as bronchoalveolar lavage (BAL) and lung tissues. Unfortunately, these techniques demand the sacrifice of many animals. In addition, the data obtained from these measurements are generally extrapolated to the lung as a whole, whereas it is plausible that they are evaluating only one compartment or a small and distinct volume within the lung. Importantly, in reference to kinetic studies, the need to terminate animals at each designated time-point precludes performing longitudinal studies in the same group of animals.
In this context, micro-computed tomography (CT) is quickly becoming a useful tool for the investigation of lung diseases in small animals. Its usefulness relies on the ability to anatomically and functionally measure processes in the lung across an experimental protocol. Progress has already been made using this imaging modality in studies of fibrosis and emphysema 1–3. With respect to asthma, research utilising CT immediately following sacrifice, i.e. ex vivo, has elegantly contributed to establishment of the role of airway closure on hyperreactivity in mice undergoing acute allergic inflammation 4. The ability to acquire CT data in a model of allergic asthma in vivo would be a step towards noninvasive assessment, utilising the same tools that are available in humans 5, 6.
The main objective of the present study was to investigate whether CT could be useful to noninvasively and sequentially evaluate experimental allergic lung/airway inflammation. A secondary objective was to evaluate several volume extraction methodologies and display parameters that have recently been reported in other lung disease models. In particular, segmentations of the thoracic cavity versus the lung proper were investigated, in order to determine whether results can be compared between these two contrasting methods. Furthermore, we wished to explore whether we could gain functional information by gating CT images on the respiratory cycle 7. Our laboratory has extensive experience in the use of house dust mite (HDM) in models of allergic asthma in mice 8–10. However, in this report we chose to study Brown Norway (BN) rats in order to increase technical resolution. Some of the results presented here have been previously reported in abstract form 11.
MATERIALS AND METHODS
Animals
5-week-old female BN rats, weighing ∼90 g, were purchased from Charles River Laboratories (Montreal, QC, Canada). Rats were housed under specific pathogen-free conditions on a 12:12-h light:dark cycle and were acclimatised to housing conditions for 1 week prior to experimentation. The experiments described in this study were approved by the Animal Research Ethics Board of McMaster University (Hamilton, ON, Canada).
Allergen administration
Rats were exposed, under isoflurane-induced anaesthesia, to purified HDM extract (Greer Laboratories, Lenoir, NC, USA) by intratracheal intubation. The procedure was performed with a laryngoscope while rats were suspended supine, by the teeth, at 35° from horizontal. A 3.5-cm PE20 endotracheal tube (1.09 mm outer, 0.38 mm inner diameter (Becton Dickenson and Co., Sparks, MD, USA)) on a 25G needle was used to deposit allergen (or vehicle) ∼1.5 cm into the trachea; allergen was allowed to distribute freely through the lung. Groups of rats received 0, 0.0015, 0.15 or 1.5 mg·mL−1 of HDM, corresponding to delivered doses of 0 (vehicle control), 0.15, 15 and 150 μg of HDM protein in 100 μL sterile saline. Exposure took place daily for 10 consecutive days.
Collection and measurement of specimens
Sample sizes were six, ten, seven and six for allergen dose groups 0, 0.15, 15 and 150 μg, respectively; these sample sizes represent data pooled from two separate experiments. Rats were sacrificed and BAL was collected ∼48 h after the final allergen exposure (24 h post imaging). In brief, the lungs were removed and the trachea was cannulated with a polyethylene tube (Becton Dickenson and Co.). The lungs were lavaged twice with 1 mL PBS; ∼1 mL of the total instilled fluid was consistently recovered. Total cell counts were determined using a haemocytometer. After centrifugation, cell pellets were resuspended in PBS and slides were prepared by cytocentrifugation (Shandon Inc., Pittsburgh, PA, USA) at 9.6×g for 2 min. Hema3 (Fisher Scientific Co., Kalamazoo, MI, USA) was used to stain all slides. Differential counts of BAL cells were determined from at least 500 leukocytes using standard haemocytological procedures to classify the cells as neutrophils, eosinophils, lymphocytes or macrophages/monocytes. Additionally, blood was collected by cardiac puncture and serum was obtained by centrifugation in Capiject tubes (Terumo Medical Corp, Elkton, MD, USA). Total immunoglobulin (Ig)E from sera was determined with a rat IgE ELISA (Kamiya Biomedical, Seattle, WA, USA). Finally, lung tissue was fixed in 10% formalin and embedded in paraffin; 3-μm-thick sections were stained with haematoxylin and eosin (HE).
CT image acquisition, respiratory gating and standardisation
All HDM dose groups were composed of four rats for CT scanning. All imaging was performed on spontaneously breathing animals anaesthetised with 1.5% isoflurane at 1 L·min−1. CT images were acquired on an X-SPECT (Gamma Medica, Northridge, CA, USA) within the McMaster Centre for Pre-Clinical and Translational Imaging at McMaster University (Hamilton, ON, Canada). CT acquisition was performed at a voltage of 75 kVp and a current of 220 μA. Two rotations of 1,024 continuous projections (2,048 projections total, ∼10 min scan time) were collected and post-acquisition respiratory gating was applied with RespGate software (RespGate, Hamilton, ON, Canada), as described by Farncombe 12. Images were reconstructed using a Feldkamp cone beam reconstruction algorithm into 512×512×512 arrays (0.155-mm3 voxels) producing images for peak inspiratory and expiratory states as well as an ungated image reconstructed from all 2,048 projections. Calibration of each image for Hounsfield Unit (HU) scaling was performed using a water-filled tube included in the scan. For each CT scan, rats received 166 mGy of deposited energy; this value was calculated by D.R. Boreham and N. Phan (Dept of Medical Physics and Applied Radiation Sciences, McMaster University) from work in mice using thermoluminescent dosimeter chips (Harshaw TLD-100, Global Dosimetry, Irvine, CA, USA) on the same CT equipment used in the present study. As HDM exposures were carried out at 24-h intervals, scans were performed just prior to the first exposure and 20 h following the third, seventh and tenth exposures; these scans are henceforth referred to as baseline, 3, 7, and 10 days (end-point) of exposure, respectively.
CT image processing
CT images were processed with Amira software (Version 3.1; Visage Imaging, Andover, MA, USA). Two methods of volume segmentation, as described by others 1–4, 13, were performed, in order to assess the advantages of and similarities between these methods. In Method 1, the thoracic volume was segmented by defining a region of interest that encapsulated the entire lung by manually outlining the ribcage and chest wall using characteristic landmarks and interpolation. A representative thoracic volume is shown in figure 1a⇓. In Method 2, lung volume was segmented by a semi-automatic process where a computer-assisted volume selection of -1000– -50 HU was further subjected to manual alterations as required to include all lung regions and exclude all non-lung regions that may have been selected. This volume selection process included blood vessels as well as a small volume of tissue immediately surrounding the lung, but excluded the heart. A representative lung volume is shown in figure 1b⇓. Method 1 was applied on respiratory-gated data as well as ungated data, while Method 2 was used only on ungated data due to a lower signal-to-noise ratio in gated data sets, particularly in inspiratory state images because of fewer associated projections. To simplify the use of volume expansion tools used in Method 2, digital Gaussian filtering (kernel 3, sigma value 1) was employed to smooth the three-dimensional, ungated, HU-calibrated CT images. Images from respiratory gating did not undergo digital filtering; Method 1 did not require a filtering procedure if no image artefacts were present and Method 2 was not applied to gated images. Density histograms were produced with 26 bins describing a range from -1,025 to 275 HU (50 HU·bin−1). Thoracic air volumes were calculated by determining the air volume in each bin based on the HU value, followed by summation of the total amount of air in each density bin for the entire thoracic volume.

Computed tomography (CT) volume segmentation and analysis methods. CT-derived histogram analysis obtained with two segmentation methods. a, c and e) Volume selection by thoracic segmentation (Method 1). b, d and f) Volume selection by lung segmentation (Method 2). For each volume selection method, volume-standardised histograms (c and d) and change from baseline histograms (e and f) are shown. HU: Hounsfield Units. ·····: animals exposed to vehicle control; –––: animals exposed to 150 μg of house dust mite extract for 10 days. n = 4 in each group. Error bars represent sem.
All histogram data (ungated and gated) were expressed as a percentage of the total lung volume for standardisation purposes. This total represents all voxels in Method 2 but only the calculated number of air voxels in Method 1. For a given animal and exposure, baseline histograms were subtracted from exposure time-point histograms to produce data demonstrating the difference from baseline. Axial distribution histograms were produced in Amira using the “volume-by-slice” component, based on a threshold of -350 HU. These histograms were expressed as the percentage of volumes greater than -350 HU in each slice, divided by the total volume of that slice (to account for varying slice volumes throughout the lung). These axial density curves contain ∼5% error in lung length due to the averaging of data between animals. Group averages were obtained and a scale based on percentage of average lung length produced. Mean lung density values (ρlung) were obtained for ungated data with the method described by Simon 13. Maximal HU (HUmax) values for histograms of gated images were determined by use of Minitab software (Minitab, Inc., State College, PA, USA). Tidal volumes were calculated by subtracting expiratory state air volume from inspiratory state air volume, after determining the total air volume for each image.
Data analysis
Data are expressed as the mean or the mean±sem. Results were interpreted using an unpaired t-test or one-way ANOVA with Dunnett’s post hoc test. All statistical analysis was performed in Graphpad Prism software (Graphpad Software Inc., La Jolla, CA, USA). For ANOVA tests, repeated criteria were used for longitudinal CT data, while nonpaired criteria were used for comparisons between groups.
RESULTS
BAL, tissue histology and serum were collected for comparison with CT scanning after the 10 days’ exposure time-point. Exposure for 10 days to vehicle control, or 0.15, 15 or 150 μg of HDM, demonstrated a significant increase in total cell numbers in the groups exposed to 15 and 150 μg of HDM (fig. 2a⇓). Similarly, increases were seen in eosinophils and mononuclear cells for the 15 and 150 μg groups (fig. 2b⇓ and c) but not in neutrophils (data not shown); a statistically significant increase in mononuclear cells was observed only in animals exposed to 150 μg of HDM. Total serum IgE, as a marker of systemic sensitisation, was significantly elevated in animals exposed to 150 μg but the response did not reach statistical significance in those exposed to 15 μg (fig. 2d⇓). HE-stained histological sections from animals exposed to 15 and 150 μg depicted increased inflammatory infiltrate around blood vessels as well as both major and peripheral airways; these changes were particularly robust in the 150 μg HDM group (fig. 2e–l⇓).

Biological data pertaining to the 10-day house dust mite (HDM) model in Brown Norway rats. Samples from animals exposed to vehicle control (Veh), or 0.15, 15 or 150 μg of HDM, were collected 48 h after the final HDM exposure. a) Total cells, b) total mononuclear cells and c) total eosinophils in the bronchoalveolar lavage from each dose group after 10 days’ HDM exposure. d) Total immunoglobulin (Ig)E measured by ELISA indicating systemic sensitisation. Sample size is indicated in the dot plots. e–l) Representative images from histological sections stained with haematoxylin and eosin for each dose group; major (e–h) and peripheral (i–l) airways are shown for each dose. **: p<0.01 versus Veh; ***: p<0.001 versus Veh. Scale bars = 1 mm.
Two methods of image volume segmentation were employed to analyse the data obtained from CT scanning (fig. 1a⇑ and b). Based on ungated CT images, histograms were produced and displayed as the percentage of total lung-associated volume for a given density bin. Representative curves for 10 days’ exposure to vehicle control and 150 μg of HDM are shown (fig. 1c⇑ and d). For each method, histograms from baseline images were then subtracted from 10 days’ exposure histograms in order to illustrate the change from baseline (fig. 1e⇑ and f). For Method 1, histograms represented the density distribution of air volume, whereas histograms produced from Method 2 described the density distribution of the entire segmented volume, which included densities greater than 0 HU, i.e. voxels containing no component of air. Given that ∼95% of the segmentation volume from Method 2, describing both normal lung tissue and inflammation, was associated with density values less than 0 HU, and based on the similarities between histogram curves from both methods, it is possible to conclude that both Method 1 and Method 2 produce similar results for this model if the change from baseline is established (fig. 1e⇑ and f).
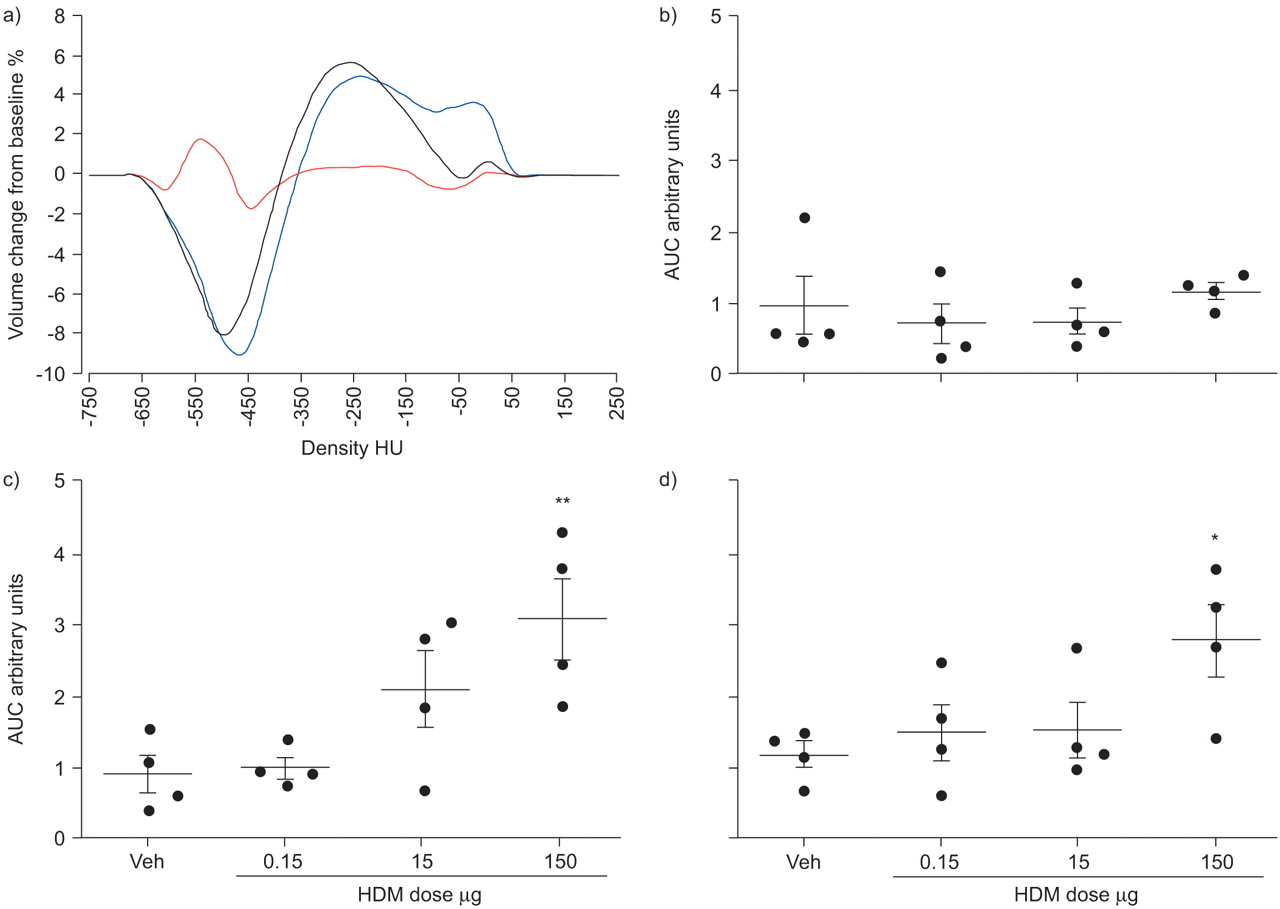
The ability to take measurements across multiple time-points allowed for a longitudinal assessment of the state of the lung in the same subject animal. Histograms depicting change from baseline for the group exposed to 150 μg of HDM, after 3, 7 and 10 days of exposure, indicated that increased densities were greatest after 7 days, particularly in the highest density bins (fig. 3a⇓). The magnitudes of these density changes were quantified by finding the integral (area under the curve) of the absolute values of the curve for each animal and at each time-point (fig. 3b–d⇓). Only the group exposed to 150 μg of HDM showed a significant difference versus the vehicle control; however, a dose-dependent response was observed at the 7 days’ exposure time-point in the group exposed to 15 μg of HDM.

Ungated computed tomography data for house dust mite (HDM) extract dose groups during the 10-day exposure protocol. a) Difference from baseline histogram curves for the group exposed to 150 μg of HDM, detailing volume-density changes taking place after 3 days (red line), 7 days (blue line) and 10 days (black line) of HDM exposure. Curves represent group averages. HU: Hounsfield Units. b–d) Values produced by integration of the change from baseline histogram curves. The integrals of the absolute values of the curve were calculated for each animal at b) 3 days, c) 7 days and d) 10 days for all HDM doses; these values represent total change as defined by area under the curve (AUC). Veh: vehicle control. n = 4 in each group. *: p<0.05 versus Veh; **: p<0.01 versus Veh.
CT slice images from representative animals, at the 10-day time-point, allowed for an anatomical assessment of the inflammatory response. The images in figure 4a⇓ and b describe various attributes associated with CT images, slice acquisition and lung morphology. Comparison of change-from-baseline histograms for the dose groups, after 10 days’ exposure, illustrated the density differences observed in the whole lung and reflected those seen in the representative images (fig. 4c⇓). These curves indicated that, while lower doses of HDM appeared to have some effect on overall lung densities, 150 μg elicited a dramatic decrease in densities less than -350 HU and a reciprocal increase in densities greater than -350 HU. For the purpose of understanding the morphological and spatial significance of different densities, a threshold of -350 HU was found to be useful for distinguishing between normal, air-filled volumes (-1,000– −350 HU) and volumes associated with inflammation as well as structural and functional components (-350–100 HU), as seen in two-colour density maps (fig. 4h–k⇓). Low-density volumes, i.e. those volumes associated with high air content, were largely diminished in animals exposed to 150 μg of HDM. In addition to a single threshold (two-colour), the volumes with values greater than -350 HU were further divided to provide a more detailed map of densities, seen in four-colour density maps (fig. 4l–o⇓). The changes in density due to HDM exposure appeared to extend from major blood vessels, enveloping nearby airways and forming a decreasing gradient towards the lung periphery, indicating that inflammation was primarily associated with the major airways and vessels.

Representative axial computed tomography (CT) slices and whole lung histograms from house dust mite (HDM) extract dose groups at 10 days’ exposure. a and b) CT image features. a) The method used to ensure images from separate animals were acquired from approximately the same position in the lung. b) Representative CT slice. Arrows: large blood vessels; arrowheads: large airways; #: heart; ¶: water-filled tube for the calibration of images into Hounsfield Units (HU); +: animal support platform. c) Difference from baseline histogram curves for all dose groups after 10 days of HDM exposure. Blue line: vehicle control; red line: 0.15 μg HDM; green line: 15 μg HDM; black line: 150 μg HDM. The colour scales featured below the graph indicate HU thresholds as shown in the two- and four-colour density-mapped duplicates in (d–o). d–o) Representative images for each dose group with colour-mapped duplicate images illustrating d–g) original, and h–k) two or l–o) four thresholds. d, h and l) vehicle control (Veh); e, i and m) 0.15 μg HDM; f, j and n) 15 μg HDM; g, k and o) 150 μg HDM.
The distribution of increased lung densities after 10 days in rats exposed to 150 μg of HDM was assessed by several approaches. To determine the location of increased densities, the percentage of high-density volume, based on a threshold of -350 HU, was calculated from each axial slice and plotted against the percentage of lung length for both baseline and 10-day exposure scans in the same group of animals (fig. 5a⇓). From these data it was apparent that increased densities, due to HDM exposure, were relatively consistent throughout the lung, from apex to diaphragm. Representative CT slices depicted increased densities throughout the central lung; position was indicated by noting the percentage of the distance from the trachea to the base of the lung (fig. 5b–d⇓). Representative three-dimensional modelling, again using a threshold of -350 HU, illustrated the widespread loss of low-density volumes and the association of these losses with central lung structures (fig. 5e⇓ and f). Total lung density values, ρlung, provided whole lung density means, and were compared with baseline values for all time-points investigated (fig. 6⇓). These values reinforced the appraisal that both 15 and 150 μg of HDM were capable of causing increased lung densities over the course of the protocol.
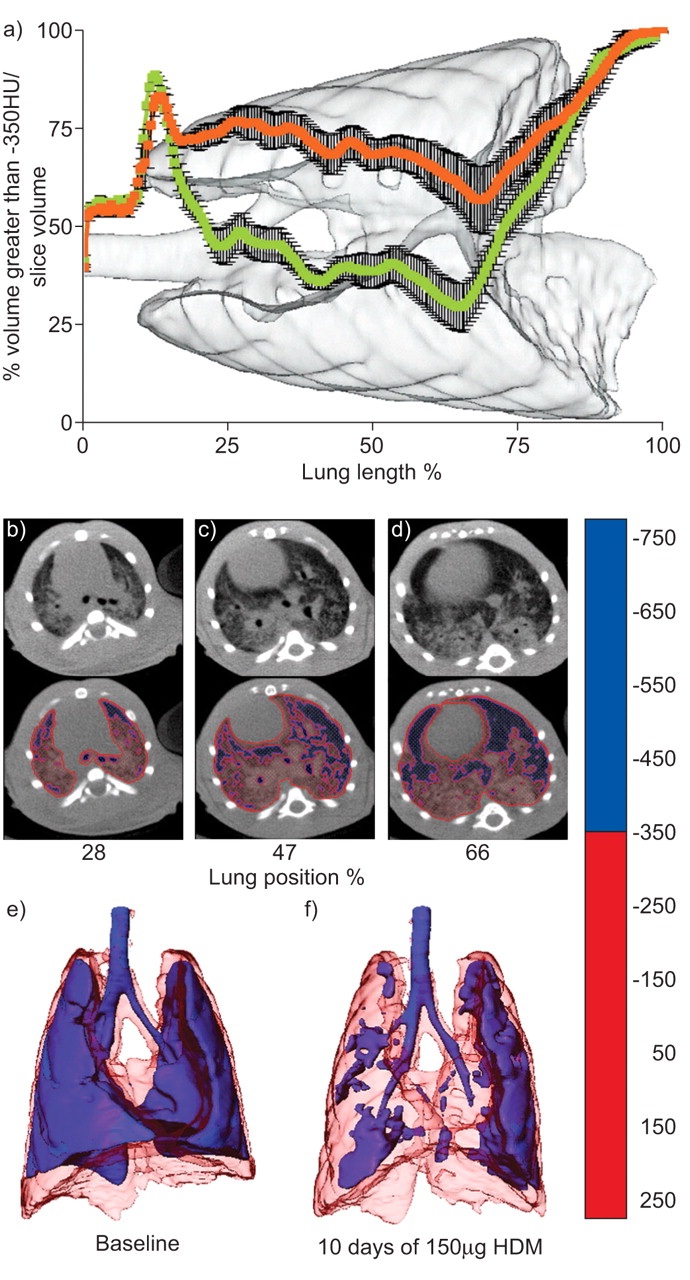
Distribution of increased density volumes in ungated data. a) Measurement of the axial location of density values greater than -350 Hounsfield Units (HU). Curves represent the percentage of volume with values greater than -350 HU in each slice, standardised by the total volume of the slice from which they were obtained, for the same group of rats (n = 4) at baseline (green) and 10 days’ exposure to 150 μg of house dust mite (HDM) extract (orange). The background image is from one representative animal. Error bars represent sem. b–d) Evenly spaced axial slices denoted by their relative positioning in the lung, with two-colour density-mapped duplicates, from a representative animal. b) 28%, c) 47% and d) 66% of the distance from the trachea to the base of the lung. The colour scale featured on the right indicates HU thresholds used. Three-dimensional lung images from one representative animal at e) baseline and f) after 10 days of exposure to 150 μg of HDM. Refer to the colour scale for HU mapping thresholds.

The difference in mean density values (ρlung) from baseline after 3, 7 and 10 days of house dust mite (HDM) extract exposure for all dose groups. a) vehicle control; b) 0.15 μg HDM; c) 15 μg HDM; d) 150 μg HDM. These values indicate the extent and timing of the inflammatory response. Distinct animals in each group are represented by different symbols. Statistics are not shown as baseline values were used in the standardisation of data, and no between-groups comparison is presented.
Post-acquisition respiratory gating was performed on CT projections to provide inspiratory and expiratory images. Gated images then underwent thoracic volume segmentation (Method 1), as described in the Materials and Methods section. Histograms, displayed as percentage of total thoracic air volume, indicated both a broadening of the curve and a shift in the peak density value (HUmax) towards higher densities in animals exposed to 150 μg HDM for 10 days (fig. 7c and d⇓). HUmax, as a measure of overall density change in air-containing compartments, was not significantly altered between the vehicle control group and the group exposed to 150 μg of HDM for the expiratory state; however, the difference between these groups became highly significant for the inspiratory state (fig. 7e⇓). Tidal volumes, calculated by subtracting total expiratory air volume from total inspiratory air volume, revealed results in the dose–response and scanning time-points not easily observed by other means. The groups exposed to both 15 and 150 μg of HDM displayed significantly decreased tidal volume after 10 days of exposure when compared with baseline values (fig. 7f⇓). In addition, 7 days of exposure to 150 μg of HDM also significantly decreased the tidal volume, while 15 μg HDM showed a similar response. Furthermore, exposure to 0.15 μg of HDM seemed to affect the tidal volume, although this change did not reach statistical significance and only appeared after 10 days of exposure. Notably, these tidal volume changes coincided with a substantial loss of both inspiratory and expiratory volume in groups exposed to 15 and 150 μg of HDM for 7 days, whereas at 10 days’ exposure lung volumes resembled those seen at baseline (data not shown) but still displayed a large loss of tidal volume indicating a more complicated pathology, possibly including airway closure and gas trapping.

Tidal computed tomography data from respiratory gating. Data were obtained using thoracic segmentation (Method 1). a and c) Expiratory and b and d) inspiratory volume-standardised histograms at baseline (·····) and after 10 days of exposure to house dust mite (HDM) extract (–––). a and b) vehicle control (Veh) group; c and d) group exposed to 150 μg of HDM. HU: Hounsfield Units. e) Comparison of peak histogram density value (HUmax) for expiratory and inspiratory states between Veh and 150 μg of HDM groups. #: p = 0.144; ¶: p = 0.002; p-values were calculated by two-tailed t-test. f) Tidal volumes for each dose group at each scanning time-point. □: baseline; ░: 3 days; ▒: 7 days; ▪: 10 days *: p<0.05 versus baseline; **: p<0.01 versus baseline; p-values were calculated by repeated measures ANOVA, n = 4.
DISCUSSION
The ability to noninvasively evaluate pulmonary inflammation is of great interest in experimental asthma as it would facilitate the investigation of issues concerning the onset, evolution and treatment of this disease. A number of imaging technologies are currently available to evaluate lung inflammation but the application of these techniques to allergic inflammation is limited. For example, 18F-fluorodeoxyglucose, in conjunction with positron emission tomography (PET), is commonly used to assess increased glucose uptake, and therefore metabolism, as a surrogate of inflammatory cell activity 14. Unfortunately, this technique has not been shown to be a useful assessment of airway inflammation in asthmatics 15, unless under conditions of a segmental allergen challenge 16, 17, most likely because neutrophils, a cell-type with a debatable association to allergic asthma, use more glucose than other cell types when activated 18, 19. Magnetic resonance imaging has also been used to detect inflammatory changes 20–22 as well as functional disruption after allergen exposure 23 in experimental models of asthma. Although this modality provides superior soft tissue contrast with no known deposition of radiation, CT is more widely available and is more commonly associated with PET and single photon emission CT (SPECT) radio-imaging technologies. These attributes, along with its ability to evaluate anatomical and functional processes by density measurements, make CT a promising technology for assessing inflammatory processes in the lung for at least preclinical and possibly clinical research.
CT has been used in several small animal models of lung disease to date, but there has been little agreement in the methods used to segment and present CT data. Methodological differences could be minimised by employing standardisation techniques, thus allowing for inter-study comparisons. For example, CT histogram data can be standardised by expressing bin volumes as the percentage of total volume, as shown by Froese et al. 2, and, furthermore, by subtracting baseline values for each animal. As demonstrated in figure 1⇑, the results obtained by Methods 1 and 2 were extremely similar in nature once the suggested standardisation methodologies were applied. These practices also allow for greater agreement within a data set, as differences between animals, such as total volume or baseline state of the lung, are partially resolved, thus facilitating longitudinal studies with a relatively small sample size.
The two methods of segmentation used for the current study, namely thoracic and lung segmentation, have both been reported previously in the literature. Thoracic volume segmentation (Method 1) has several advantages, when using basic software for analysis, in that it is considerably faster than lung segmentation, requires minimal user-defined manipulation, and can be used with relatively low-quality CT images. However, this method relies on the principle that all unit volumes (voxels) belonging to lung tissues must have an associated content of air, i.e. they belong to density values less than 0 HU. Lung tissues with values equal to or greater than water are therefore lost. Lung segmentation (Method 2) has its own benefits, principally associated with analysis of regions of high density within the lung. Removal of bone, heart and other irrelevant tissues from the region of interest allows for the determination of average lung values (ρlung), slice density maps, and three-dimensional volume maps. However, in comparison with thoracic segmentation, the time required for lung segmentation, the amount of user-defined manipulation required (especially in regions of robust inflammation) and the quality of CT image needed limit its accessibility. We suggest that, for the purposes of assessing pulmonary inflammation in any CT image, thoracic segmentation should always be performed, so that the more user-reliant lung segmentation method can be double checked.
Based on the change from baseline histogram curves, the current data indicated that the airspace in a BN rat lung was primarily associated with density values less than -350 HU and inflammatory processes with values above -350 HU. It is also important to note the gradient of this inflammation-associated range in relation to pulmonary structure. It appeared that the highest densities (greater than -50 HU) were directly associated with major blood vessels, middle-range densities (-50– -200 HU) were predominantly associated with major airways, and the lowest inflammation-related densities (-200– -350 HU) were peripheral to all higher densities. This distribution, in the context of allergen-induced inflammation of the lung, would seem to indicate that densities decrease with increasing distance from the major blood vessels. Furthermore, histograms produced through the transaxial axis of CT images indicated that densities greater than -350 HU were consistent throughout the lung, from apex to base. These data, in conjunction with representative axial slices and histological sections, indicate that the major conducting airways, and their associated vessels, are the focal point of inflammation in the lung. Thus, it is likely that the localisation and extent of both cellular and oedematous inflammation is determined by the site of interaction of the allergen with the airway mucosa and the proximity to a conducting vessel.
As it pertains to ungated data, exposure to 150 μg of HDM for 7 days resulted in a statistically significant increase in lung densities. Very suggestive changes were also observed in CT images after exposure to 15 μg of HDM for 7 days, although these changes did not reach statistical significance. Interestingly, after 10 days, only the group exposed to 150 μg of HDM continued to show overt and statistically significant change. Appraisal of histogram curves indicated that the difference between days 7 and 10, in groups exposed to both 15 (data not shown) and 150 μg (fig. 3a⇑), was caused by a reduction in volumes with densities in the range -100–100 HU (water is 0 HU). Thus, the comparatively greater increases in density observed at day 7 may reflect a greater contribution of oedematous infiltrate, rather than cellular inflammation, at this time.
When comparing CT data with biological outcomes, we observed a direct relationship between CT images and histological evidence of inflammation. Conversely, BAL findings, if viewed as a measure of the entire lung, were more pronounced than the equivalent CT-derived values, such as integrals of the absolute change from baseline or ρlung values. Since the CT-derived values were produced from data incorporating the entire lung, this comparison may suggest that results from BAL primarily evaluate processes surrounding the major airways and do not necessarily reflect the overall status of the periphery. A means of CT image airway segmentation could be developed to limit the diluting effect of peripheral density values, potentially providing a noninvasive BAL-equivalent measurement in allergic airway inflammation models. The divergence between BAL- and CT-derived findings is also probably affected by the relatively small density changes seen in vehicle control animals over the protocol (figs 3b–d⇑, 4d, h and l, 6⇑a and 7a and b⇑). This reaction does not appear to be caused by any immunopathology but could be a result of the accumulation of liquid in the alveoli over the course of the protocol or limited pulmonary inflammation, occurring spontaneously, common to BN rats.⇑
While the majority of the work presented was acquired from ungated CT images, post-acquisition respiratory gating was performed to determine the potential value of this methodology in this model of pulmonary inflammation. We found that peak values (HUmax) for histogram curves were significantly different between vehicle control and 150 μg of HDM for inspiratory but not expiratory CT images. This result indicates that the additional air volume at tidal inspiration provides an increased capability to determine the impact of inflammation on lung volumes, potentially improving the sensitivity of all measurement techniques reported. Unfortunately, segmentation procedures for gated images were restricted to Method 1, as the number of projections acquired in this study did not provide the image quality necessary for Method 2 to be used for further analysis. Projections were limited, especially for the inspiratory gate, because subject animals had a tendency towards a long expiratory phase and short inspiratory phase under anaesthetic. This scenario also skewed ungated images towards expiratory volumes. Therefore, future studies would benefit from an increased projection count so that the measurement methods described for ungated images could be applied to gated data sets. Intriguingly, tidal volumes, also derived from gated images, revealed altered breathing patterns in rats exposed to 15 and 150 μg of HDM, as well as an apparent response after 10 days in rats exposed to 0.15 μg of HDM. The rate of breathing could be determined in further work, in order to shed light on the physiological consequences of this result. Nonetheless, the current findings suggest that tidal volume may directly relate to the extent of inflammatory processes around major airways.
The research presented here was performed to determine the value and sensitivity of CT measurements in assessment of inflammatory events occurring in the lung as a result of exposure to HDM, a common and complex aeroallergen. In summary, we have shown that differences in the extent of inflammation can be extracted from CT images, and that this noninvasive modality is suitable for longitudinal evaluation of allergic airway inflammation. We suggest that future in vivo studies of pulmonary inflammation utilise standardisation practices, respiratory gating and thoracic segmentation in addition to lung segmentation. Our findings provide a platform for further studies to evaluate intervention strategies and other asthma-related processes such as airway remodelling, and for investigations of existing or novel radiolabelled molecular markers for use with PET or SPECT. We propose that the noninvasive assessment of asthma in humans will directly benefit from advances in imaging methods and molecules tested in disease models.
Support statement
This research was partially funded by the Canadian Institutes of Health Research (CIHR; Ottawa, ON, Canada). M. Jordana holds a Senior Canada Research Chair on the “Immunobiology or Respiratory Diseases and Allergy” and J.R. Johnson was a holder of a CIHR doctoral award.
Statement of interest
None declared.
Acknowledgments
The authors gratefully thank C. Saab and R. Rhem for their expertise in and contribution towards all imaging aspects of experimentation; K. Ask, G. Martin, N. Stieber and E. Archer for their technical assistance; M. Kiriakopoulos and M. Colbert for secretarial support; and D.R. Boreham and N. Phan for dosimetry calculations (all McMaster University, Hamilton, ON, Canada).
- Received June 9, 2008.
- Accepted January 4, 2009.
- © ERS Journals Ltd
References


