


Abstract
The aim of the present study was to calculate reference equations for carbon monoxide and nitric oxide transfer, measured in two distinct populations.
The transfer factor of the lung for nitric oxide (TL,NO) and carbon monoxide (TL,CO) were measured in 303 people aged 18–94 yrs. Measurements were similarly made in two distant cities, using the single-breath technique. Capillary lung volume (Vc) and membrane conductance, the diffusing capacity of the membrane (Dm), for carbon monoxide (Dm,CO) were derived.
The transfer of both gases appeared to depend upon age, height, sex and localisation. The rate of decrease in both transfers increased after the age of 59 yrs. TL,NO/alveolar volume (VA) and TL,CO/VA were only age-dependent. The mean TL,NO/TL,CO was 4.75 and the mean Dm/Vc was 6.17 min−1·kPa−1; these parameters were independent of any covariate. Vc and Dm,CO calculations depend upon the choice of coefficients included in the Roughton–Forster equation. Values of 1.97 for Dm,NO/Dm,CO ratio and 12.86 min·kPa−1 for 1/red cell CO conductance are recommended.
The scatter of transfer reference values in the literature, including the current study, is wide. The present results suggest that differences might be due to the populations themselves and not the methods alone.
The measurement of the transfer of gases through the lung is one of the few tests aimed at investigating alveolar function. The 1957 model and equation of Roughton and Forster 1 permitted the transfer of carbon monoxide through the aveolocapillary structure to be split into two resistances, one for the alveolar membrane (1/membrane conductance, the diffusing capacity of the membrane (Dm), for carbon monoxide (Dm,CO)) and the other for the blood reacting with the gas (1/ΘCOVc), where ΘCO is the red cell conductance at a concentration, set by the pioneers of the method, of 14.9 g·dL−1 2 and Vc the capillary lung volume:
1/TL,CO = (1/Dm) + (1/ΘCOVc) (1)
where TL,CO is the transfer factor of the lung for carbon monoxide. The first technique used to solve this equation with two unknowns, Dm and Vc, was to measure two transfers of CO, one under conditions of normoxia the other under hyperoxia. Breathing O2, by reducing ΘCO, lowers the TL,CO. Guenard et al. 3 first published measurements of Dm and Vc using transfer factor of the lung for nitric oxide (TL,NO) and TL,CO and assuming ΘNO to be infinity, i.e. TL,NO = Dm,NO. The transfer of CO is dependant upon both Dm and Vc with ΘCO as a finite value.
The relationship between Dm for nitric oxide (Dm,NO) and Dm,CO introduces a constant a: Dm,NO = aDm,CO. Therefore, the measurement of NO transfer alone permits the calculation of Dm,CO and, by introducing the latter into the CO transfer equation, of Vc.
Most published reference values for Dm and Vc have been derived from the first two-step technique; one used the NO/CO method in a population of 127 healthy adults with a mean±sd age of ∼40±12 yrs 4 and another focused on NO transfer in a population of 130 adults, including 17 subjects aged >60 yrs 5. In the present study, the reference values for NO and CO transfer are derived from a larger population with a broad age range. Forster and co-workers’ 6, 7 1983 values for ΘCO, rather than the 1957 values, are used here, and an a of 1.97.
METHODS
Subjects
Nonsmoking persons (n = 303) without cardiovascular, pulmonary or systemic diseases, aged >18 yrs and of both sexes (142 females and 161 males) were included. The subjects were from two French cities; the main cohort was from Grenoble, in the Alps (altitude ∼300 m), and comprised 233 subjects aged 18–94 yrs; the other was from Bordeaux, near the Atlantic Ocean (altitude ∼30 m), and comprised 70 subjects, aged 20–70 yrs. These distant locations were chosen to check the reproducibility of the reference equations between different places. All of the subjects were middle-class workers, the youngest were students and the oldest retired. All were advised of the aim of the protocol and gave their informed consent. The protocol was approved by the ethics committee of the University Hospital of Bordeaux (Bordeaux, France). Ex-smokers were not included if aged <40 yrs. Subjects aged >40 yrs were included if they had stopped smoking for ≥10 yrs and had had a cigarette consumption of <5 packs·yr−1. They were either sedentary or practised a sports activity (or heavy work) for >3 h·week−1 (32% in Bordeaux and 28% in Grenoble). Individuals that were classified as obese class I (30<body mass index (BMI)<34.9 kg·m−2) and without disease were also included. Obesity class II (34.9<BMI<39.9 kg·m−2) and III (BMI >40 kg·m−2) individuals were excluded from participating in the present study.
Measurement of NO and CO transfer
The procedures and materials used were similar in both cities. TL,NO and TL,CO were measured simultaneously during a single-breath manoeuvre using an automated apparatus (Medisoft, Dinant, Belgium). Subjects were in the sitting position and wore a nose-clip. A mixture containing 0.28% CO, 14% He and 21% O2 balanced with N2 was mixed with an NO/N2 mixture (450 ppm NO in N2; Air Liquide Santé, Paris, France). The final concentration of NO in the bag inspired was 40 ppm and that of O2 was 19.1%. The apparatus was calibrated for gas fractions using automated procedures. The linearity of the analysers was factory checked. Linearity on site could be checked by dilution procedures, i.e. dilution of the NO mixture with the CO/He/O2 mixture to check NO analyser linearity, or dilution of the CO/He/O2 mixture with air to check CO analyser linearity. The screen pneumotachograph was calibrated daily using a 2-L syringe. The subject breathed through a mouthpiece and a filter connected to the pneumotachograph. When needed, they were requested to make a deep expiration. Then, at the onset of the following inspiration, a valve opened, allowing the subject to inspire the mixture during a rapid deep inspiration. A breath-hold of 4 s was then requested, followed by a rapid expiration. The first 0.8 L of expired gas was rejected and the following 0.6 L was sampled in a bag, which was automatically analysed for NO, CO and He. The delay in analysis of the sample of expired gas was constant at 35 s. Alveolar volume (VA) during the apnoea was calculated using the He-dilution technique.
The measurements of TL,NO and TL,CO were accepted if two successive measurements of TL,NO and TL,CO were within 10% of each other. A third measurement was made if the two measurements were not within 10%. If this last measurement did not fit with one of the two previous measurements, the subject was considered unable to perform reproducible measurements and excluded from the cohort. The set of values from the NO and CO transfers with the greater TL,CO was retained. Dm and Vc were calculated according to the equation of Roughton and Forster 1:
1/TL,CO = 1/Dm,CO+1/ΘCOVc (2)
1/ΘNO was assumed to be negligible 3, i.e. TL,NO = Dm,NO. Dm,CO was calculated as Dm,NO/a, where a = 1.97 following Graham’s law. In order to calculate Vc, the ΘCO reference values of Forster and co-workers 6, 7 were selected. These choices are considered in more detail in the Discussion section. The mean capillary oxygen tension was estimated to be 13.3 kPa (100 mmHg), taking into account the slightly lower than normal oxygen fraction of the inspired mixture. The haemoglobin concentration was not measured 8 but set at 13.4 g·dL−1 for females and 14.6 g·dL−1 for males 9, i.e. 1/ΘCO was multiplied by 14.9/13.4 and 14.9/14.6, respectively, since 14.9 g·dL−1 was the haemoglobin concentration in the work of Roughton et al. 2, in agreement with the maximal O2 concentration in the oxyhaemoglobin form of 0.2 mL·mL blood−1 cited in the associated article 1. 1/ΘCO was 14.29 min−1·kPa−1 for females and 13.16 min−1·kPa−1 for males. As suggested by Stam et al. 8, the slight differences in haemoglobin concentration in a healthy population did not justify its measurement, since the recovered mean Vc was not significantly altered by the introduction of pre-set values for females and males. The total breath-holding time was calculated according to the method of Graham et al. 10, i.e. from the beginning of inspiration less the first 30% of the inspiratory time to the middle of the expiratory sample time.
Statistical analysis
A linear multiple regression model for each of the variables was tested for Vc, TL,CO, TL,NO (or Dm,CO), Vc/VA, Dm/VA and TL,CO/VA. TL,NO and Dm,CO were proportional; both values are nevertheless reported in order to compare the present Dm,CO with others. The independent variables were sex (zero female, one male), age (in yrs), height (in m) and weight (in kg) or BMI (kg per m squared), which takes into account both of the previous variables. This analysis was performed on the whole population (Grenoble and Bordeaux). A further analysis was performed taking into account the city of origin of the subjects as an independent variable. The variables whose significance levels were >0.05 were rejected from the model. For a new observation of the independent variables, an interval of prediction at the level of 1–α for the dependent variables was introduced. The prediction was directly obtained using the regression equation and estimates of its parameters.
RESULTS
The age distributions of females and males are shown in figure 1⇓. The number of people included per decade was steady in the age range 20–70 yrs, and decreased in older people. The mean (range) total breath-hold time was 5.5 (4.9–6.1) s.
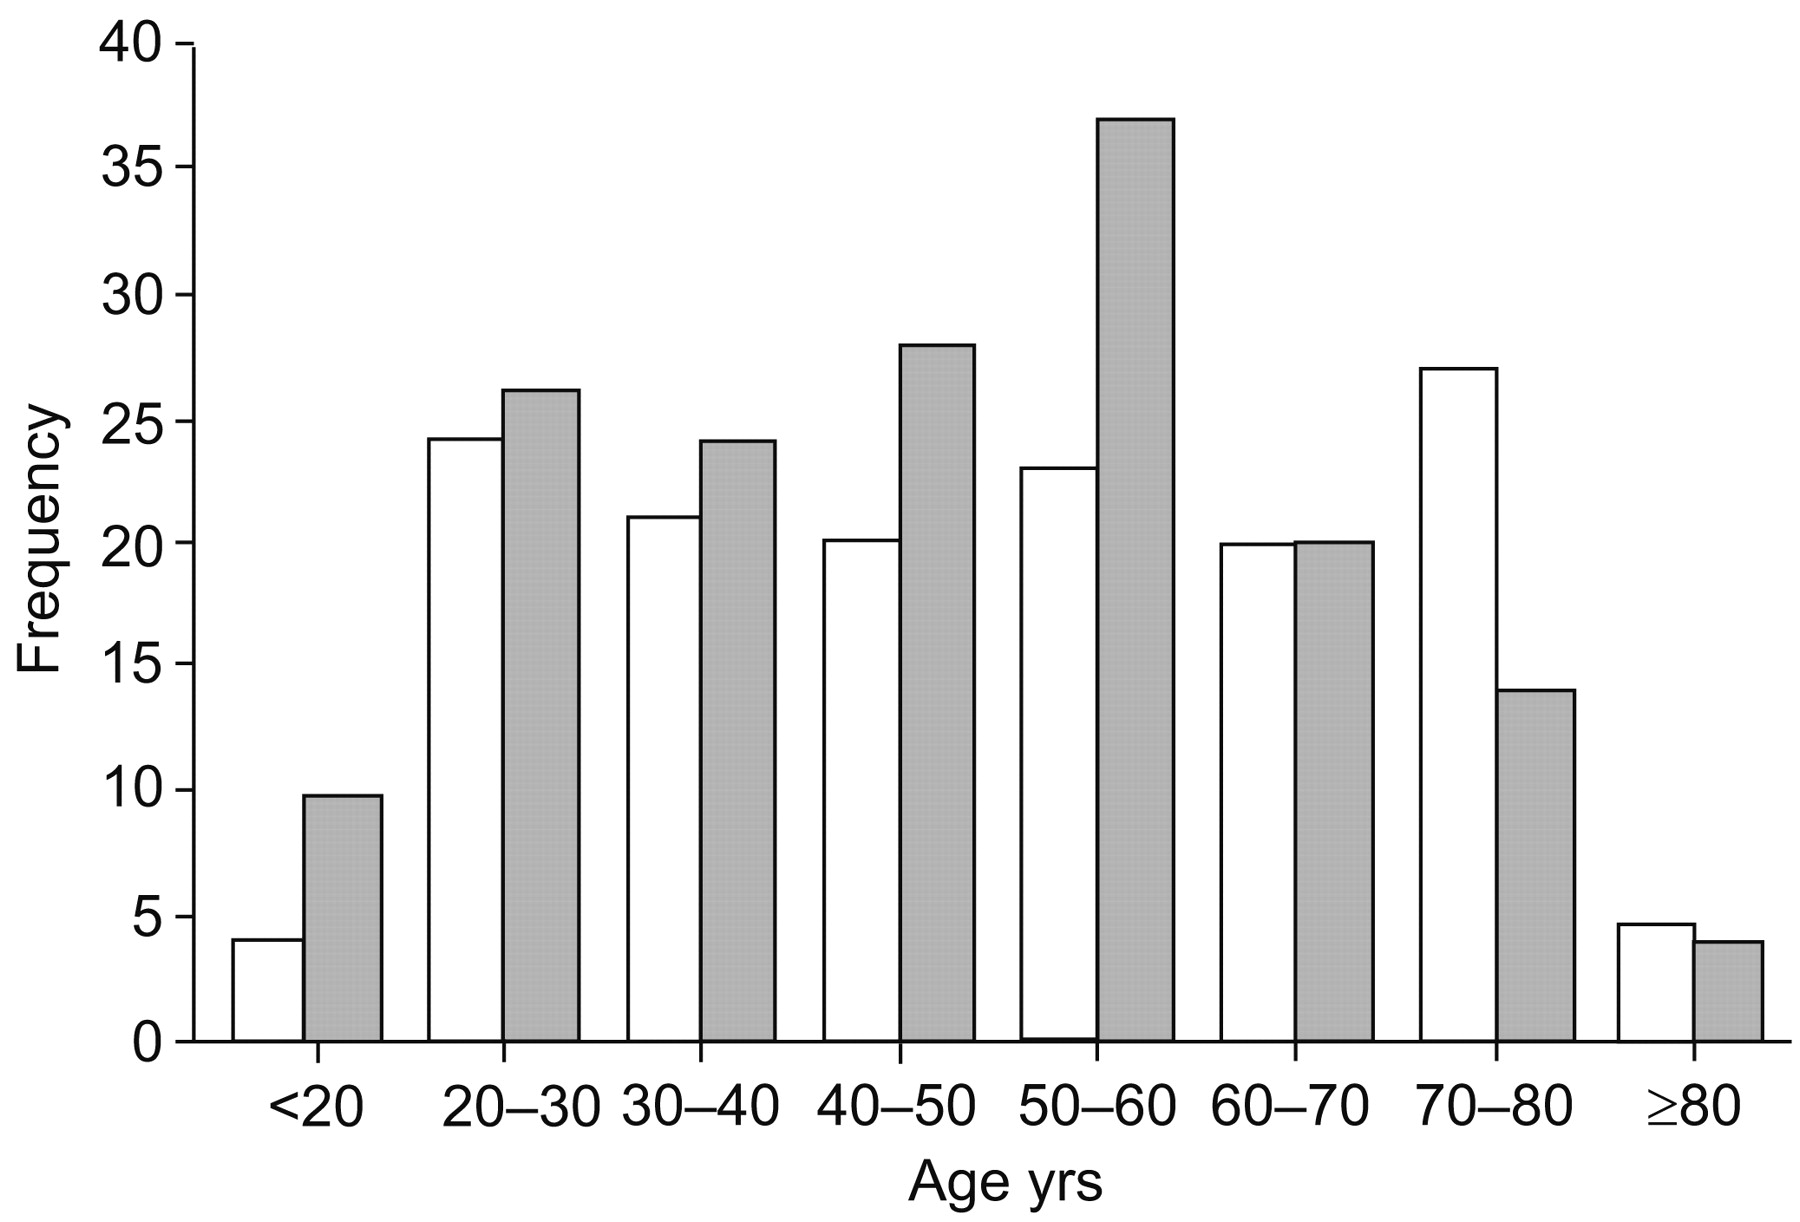
Age distributions of females (□) and males (▓) in the sample population. The youngest subjects were ≥18 yrs of age; the ≥80-yrs category included a few subjects aged >90 yrs.
TL,CO, TL,NO, Dm,CO and Vc were each best fitted for age using two linear equations. The first one, for young adults, had a shallow slope, and the second, for older adults, had a steep slope. The slope for people aged >59 yrs (βo) was derived from the addition of the slope of the young population (βy) and an additive value (βad) multiplied by the difference between the effective age in yrs (A) and 59:
βo = βy+βad(A–59) (3)
The age threshold between the young and old populations was chosen to maximise the F-statistic of the model. BMI and weight were rejected as significant covariates; age, height and sex were retained. Males gave greater values than females of the same age and height. The three selected independent variables explained ∼70% of the variability. Figure 2⇓ illustrates the biphasic effect of age on Vc in males. Table 1⇓ gives the coefficient estimates of the bilinear age relationship for all variables in the whole population, and table 2⇓ gives the estimates, taking the city of origin of the subjects into account. The city of origin exerted slight but significant effects on TL,CO and TL,NO, which were lower in Grenoble than Bordeaux (mean differences 8.5 and 13.2%, respectively). The intervals of prediction can be calculated taking into account all of the covariates (see Appendix; an Excel program for the calculation of these intervals is available on request).
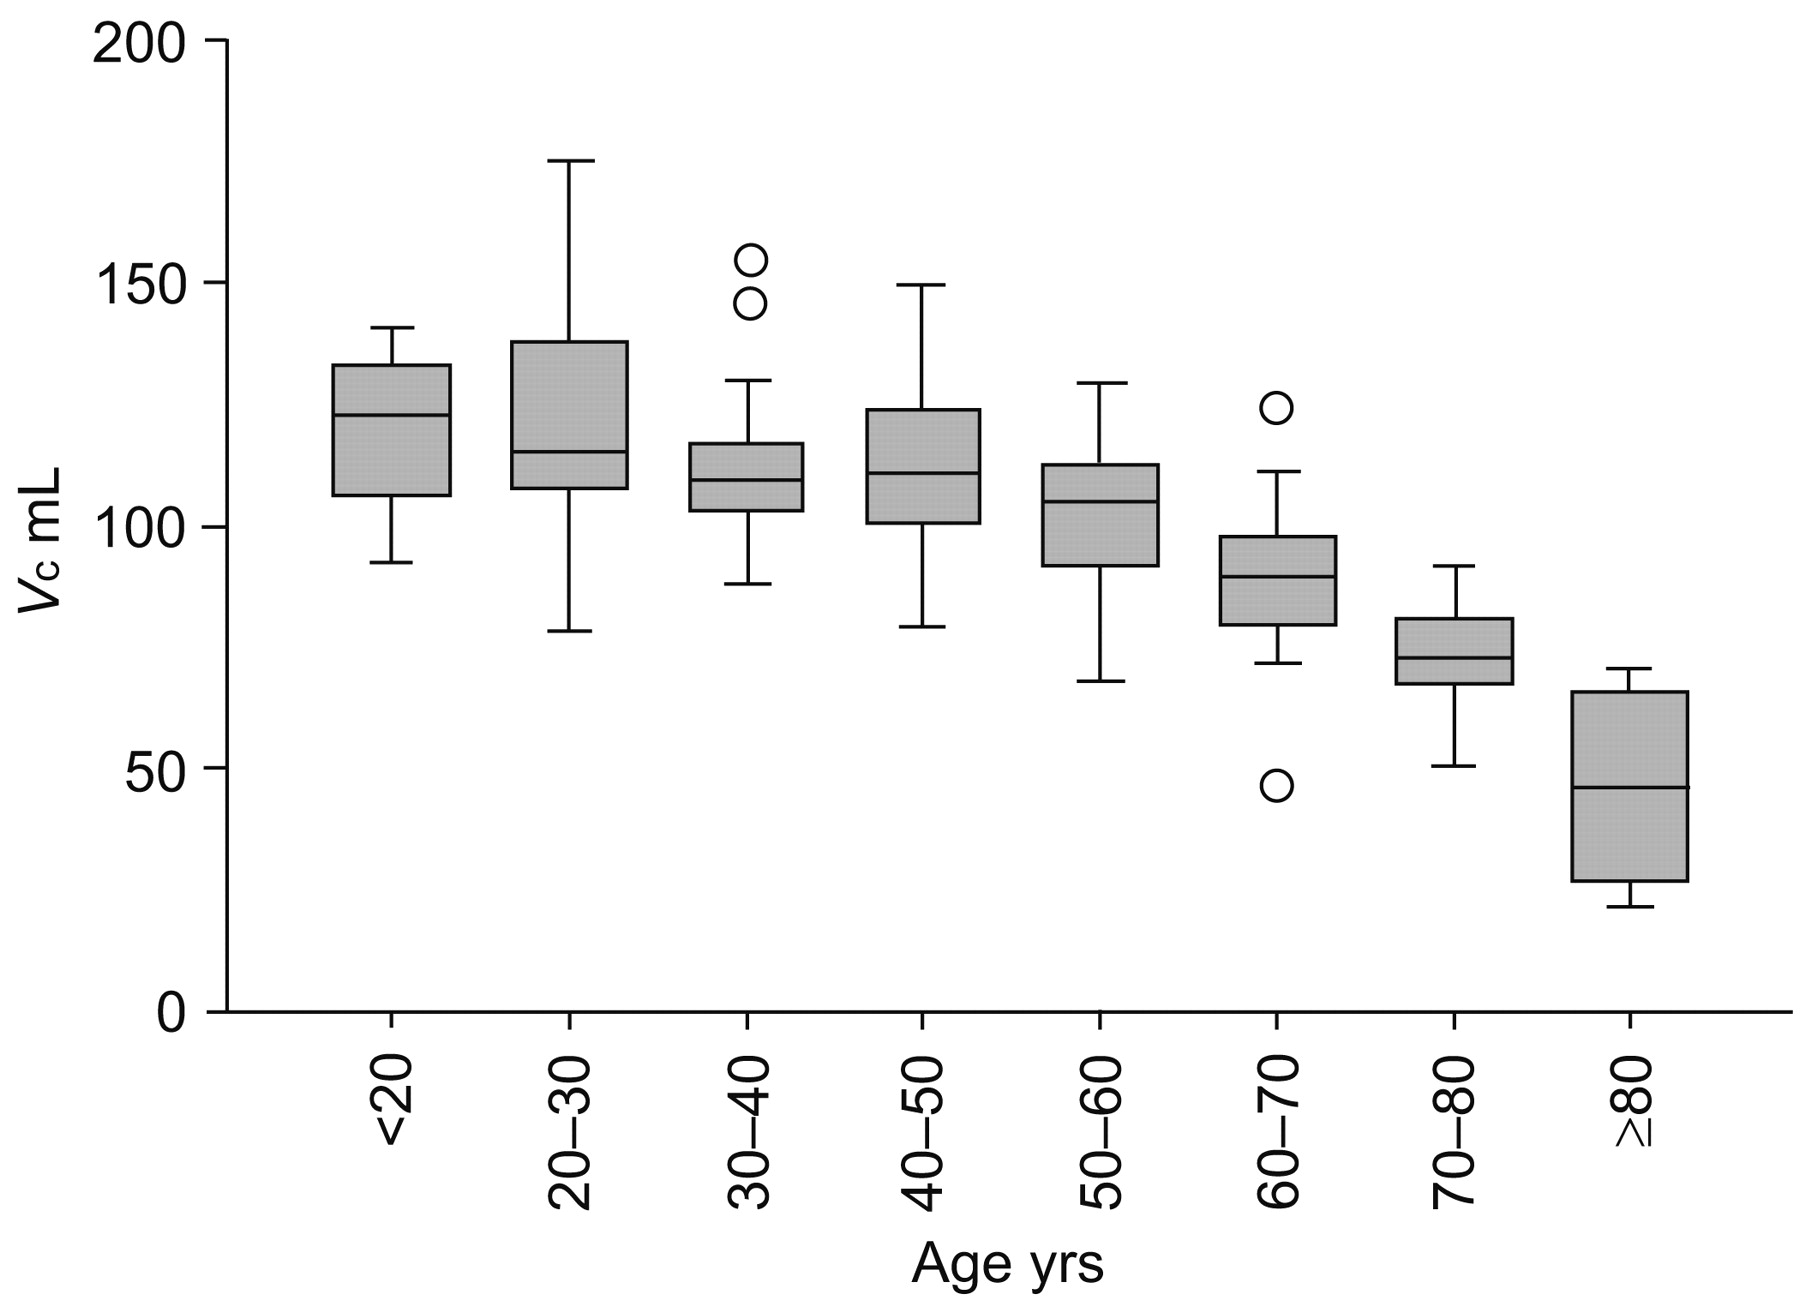
Boxplot showing capillary lung volume (Vc) as a function of age in males. Boxes represent median and interquartile range; vertical bars represent range (○: outliers). There is a biphasic decrease in Vc as a function of age.
Estimates of the regression equation parameters for dependent variables for the entire population
Estimates of the regression equation parameters for dependent variables taking city into account
The regression equations for the variables TL,CO/VA, Dm,CO/VA and Vc/VA are given in table 3⇓. The models for TL,CO/VA and Dm,CO/VA involve only the covariate age. Height, weight and BMI increased r2 by no more than 2%. The computation of the 95% confidence interval involved the covariance matrix of the estimates. No difference in TL,CO/VA between underweight (17<BMI<20 kg·m−2; n = 29) and class I obese people (35>BMI>30 kg·m−2; n = 10) was observed (41.4±5.3 and 39.8±7.5 mL·min−1·kPa−1·L−1, respectively). It is worth noting that the models explain ∼50% of the variability in TL,CO/VA and Dm,CO/VA, but only 37% in Vc/VA. Dm/Vc and TL,NO/TL,CO were independent of any covariate (age, weight, height, VA, BMI and sex). Their means were 0.82 min−1·mmHg−1 and 4.75, respectively. The intervals between 5th and 95th percentiles of their univariate distributions were 0.63–1.04 min−1·mmHg−1 and 4.10–5.44, respectively. Dm was linearly related to Vc: Dm = 7.3+0.73Vc (units as in tables 1⇑ and 2⇑). The constant 7.3, however small, was significantly different from 0.
Estimates of the linear model parameters for dependent variables
DISCUSSION
Apart from providing reference values for TL,NO, TL,CO and their derived variables, the present data show that variables divided by VA produce figures dependent on age alone, and that Dm,CO/Vc and TL,NO/TL,CO are independent variables.
TL,NO, TL,CO, Vc and Dm,CO are strongly dependent upon anthropometric variables; among them, age appears to be the most important. The changes in these variables are by-products of lung ageing. It is noteworthy that the loss in membrane conductance is nearly proportionate to that in Vc, since the ratio Dm,CO/Vc is independent of age.
Ageing decreases the performance of all organs and functions. The decay in lung transfer of both NO and CO appeared biphasic, relatively slow in young adults and then faster in the elderly, suggesting a reduction in the surface of the lung available for gas exchange. This biphasic decline was described by Georges et al. 11. The loss of lung surface is due to the coalescence of alveoli along with loss of alveolar walls 12. This loss is suggested to be accompanied by loss of pulmonary capillaries. Morphometric evidence on this point is scarce, apart from a study showing a 15% decrease in capillary density between the ages of 20 and 57 yrs 13.
The variables TL,NO, TL,CO, Vc and Dm,CO divided by VA are independent of anthropometric variables except age. Large lungs at a given age have a greater exchange surface and a greater number of capillaries than small ones; thus, ratios of TL,NO, TL,CO, Vc and Dm,CO to VA reduce the link to sized anthropometric variables. For example, Vc/VA ratio decreases from 15 mL·L VA−1 at 26 yrs to 10 mL·L VA−1 at 73 yrs. Another advantage of relating the variables to VA is to avoid sex differences, which are not related to lung tissue structural differences but to differences in the size of the lung for a given height and age.
Several studies have dealt with the subject of transfer coefficient of the lung for carbon monoxide (KCO) and nitric oxide (KNO) and their interpretation 14, 15. It would be beyond the scope of the present study to comment in detail on this subject; however, one point is that the basic assumption in obtaining reference values using the single-breath method is that subjects, or patients, perform a full inspiration and reach their maximal VA (VA,max). VA,max depends upon the performance of inspiratory muscles and chest–lung mechanics. Subjects with the same anthropometric characteristics could have differing VA,max. As a consequence, calculation of KCO and KNO by dividing TL,CO and TL,NO by VA,max introduces an additive relative scatter, as observed in the present study. For example, the confidence interval (2sd) of TL,CO for a male of 1.70 m in height and aged 50 yrs is 27%, whereas the mean TL,CO/VA is 35%. Conversely, it seems logical to divide the TL,CO by a variable related to the amount of parenchyma in the lungs. Perhaps VA,max is not a good choice.
What would happen if a subject with healthy lungs did not reach VA,max? Several authors have performed measurements at various percentages of VA,max 4, 8, 14–18. In brief, KNO and KCO decrease as a function of percentage of VA,max, i.e. both variables increase at low VA. On the one hand, Dm,CO and percentage VA,max are linearly related in the range 60–100% VA,max 4, and Dm,CO reaches a maximum at 100% VA,max. On the other hand, Vc decreases negligibly between VA,max and 60–80% VA,max 16, 18. Therefore, the TL,CO versus VA relationship, which takes into account both Dm,CO and Vc, cannot be linear. If, nevertheless, a linear equation is fitted in a restricted range of percentages of VA,max, a constant must be introduced into the equation 14, which is, in mathematics, an affine, not linear, function, i.e. for VA = 0, TL,CO>0. An exponential fit has also been proposed 15. Interpretation of KCO and KNO in patients unable to reach their VA,max should be cautious, taking into account the percentage of the predicted reduction in VA,max 14, 17.
Obese class I individuals with no significant medical history were included in the present study. Following this classification, the maximum BMI accepted was 34.9 kg·m−2. Removing all obese class I individuals from the present study did not affect the results. Morbid (class III) obesity (BMI >40 kg·m−2) consistently alters lung diffusion by increasing Vc and decreasing Dm 19. In moderate obesity, the alteration seems due to changes in VA; the ratio TL,CO/VA can be elevated in people with a BMI of >30 kg·m−2 20. In the present study, subjects with abnormal VA were not included. Furthermore, there was no difference in TL,CO/VA ratio between underweight (BMI <18 kg·m−2) and obese class I individuals (30<BMI<35 kg·m−2); therefore, there was no objective reason for rejecting this population from the analysis. It is worth noting that these subjects, if clear from restrictive lung disease and sleep disturbances 21, should show normal TL,CO and KCO. This point is of interest since class I obesity has a high prevalence in many countries.
The independence of the Dm,CO/Vc and TL,NO/TL,CO ratios from any variable is noteworthy. The ratios TL,NO/TL,CO and Dm,CO/Vc are related:
TL,NO/TL,CO = a+(Dm,CO/VcΘCO) (4)
This independence is not unexpected since morphometric analysis of human lung has shown that the alveolar and endothelial surfaces are related 22, with their reported ratio being 0.88. From a theoretical point of view, the Dm,CO to Vc relationship should intercept the axes at 0 as a significant value of 54.9 mL·min−1·kPa−1 was found, but not in a previous work from the same group 16. However significant, this intercept value is small compared to Dm,CO in adults and is probably due to the various assumptions made in the model (ΘCO and haemoglobin concentration). Glénet et al. 16, in a theoretical and experimental study, gave an interpretation of the TL,NO/TL,CO ratio, whose value would be inversely related to the product of the thicknesses of the alveolar membrane and blood capillary sheet. This ratio, being independent of anthropometric variables, itself appears as a morphometric characteristic of an individual. TL,NO/TL,CO looks easier to interpret than Dm,CO/Vc since it is dimensionless and does not require the introduction of the debatable values ΘCO and a. It would be of interest to know whether the TL,NO/TL,CO ratio remains stable throughout the life of a person.
As suggested by Zavorsky and Murias 23, two measurements of NO and CO transfer are sufficient to give reliable values. Since they calculate the mean of these two measurements, the results provided by the test with the greater TL,CO were kept in the present study. The reference values for TL,CO in the literature are scattered; equations from Chinn et al. 15 give lower values than those from Van der Lee et al. 4, which, in turn, give lower values than those of the present study. Zanen et al. 24 did not find a decrease in TL,CO with age, probably because their study was restricted to adults aged <60 yrs. Looking at KCO and KNO, the differences between studies appear maximal in young adults for KNO. Compared with the results of Van der Lee et al. 4, the present study gave results 21 and 14% higher in females and males, respectively. KCO differences are much less than for NO, 9 and 6% for females and males, respectively.
These differences could be due to the method used, as well as differences in the populations studied. Van der Lee et al. 4 used low inspiratory NO fractions (7–9 ppm) along with long breath-holding periods, leading to NO concentrations in the range 200 ppb, requiring a high-resolution chemiluminescent apparatus. As this technique is feasible in healthy nonallergic patients, it seems preferable to use high fractions of NO and short breath-holds in patients in whom the endogenous NO fraction can be elevated. If a fraction of 5% is taken as the maximum participation of endogenous NO to the expired concentration, it could be proposed as a safe procedure that the expiratory NO fraction in patients should be not less than 1 ppm in order to avoid contamination by endogenous NO. The NO transfer values reported by Zavorsky et al. 5 in a healthy population using the same material and protocol as in the present study, are close to those reported here; however, the rate decrease with age was considered constant in the work of Zavorsky et al. 5. This slight difference could be due to the reduced number of old subjects in the latter study 5.
It has been shown, in healthy volunteers, that TL,CO 9, 24 and TL,NO 24 decrease slightly with breath-hold duration. In patients with distension, either chronic obstructive pulmonary disease or asthmatic, TL,CO increased with breath-hold duration 9, 25. It is not proven that, even with a 10-s breath-hold, the TL,CO reached its maximal value 9. Therefore, whatever the breath-hold duration, this fact should be integrated into the interpretation of TL,CO or TL,NO data in patients with distension. This lack of a stable value is probably due to a limitation of gas transport in the gas phase. Distension associated with poor ventilation in some part of the lung shifts the transition front between convection and diffusion of gases toward the mouth 26, increasing the path length for diffusion of CO and NO. It is worth noting that the ratio TL,NO/TL,CO is not altered by limitation of gas phase diffusion since both gases are involved in this limitation. In brief, it seems that a 40-ppm inspiratory NO fraction with a 4-s true breath-hold, i.e. a total breath-hold duration of 5–6 s, is a good compromise for routine applications, taking in to account the fact that pulmonary distension and/or heterogeneity in the distribution of ventilation might intervene, should be integrated into the interpretation of CO or NO transfer.
Methodological factors are often put forward to justify discrepancies between reference values; however, in the present study, the material and protocols used were the same in the two centres involved in the study. The differences in TL,CO and TL,NO between the two sites were, nevertheless, significant and permitted a partial reduction in the unexplained variability of the variables. Altitude might play a role as Grenoble is situated at an altitude of ∼300 m and the altitude of Bordeaux is close to sea level. The effect of 300 m of altitude on pulmonary diffusing capacity measurements is slight as there is only a minor difference in arterial oxygen tension between Grenoble and Bordeaux.
Another factor causing discrepancy between reference values is heterogeneity in the physical activity status of the subjects. At rest, trained subjects exhibit Dm,CO and Vc that are 20 and 25%, respectively, greater than in untrained subjects 27. Therefore, mean reference values are higher in populations with a high prevalence of physically active subjects. Patients are supposed, in the main, to be sedentary; therefore, the lower limit of the reference values should be used. There was no difference in anthropometric characteristics or the physical activity status of the subjects between the two cities; therefore, these factors were not responsible for the location being a significant determinant of pulmonary diffusion.
The level of chronic air pollution could affect lung function; Grenoble is located in an industrial valley in the Alps, whereas Bordeaux is situated in a flat environment near the Atlantic Ocean. It has been shown that air pollution in areas in which people are living is a determining factor in cardiovascular disease 28. Before reaching the blood, pollutants might damage the lung.
Before using reference values in a given city or place, it would be recommended to check the agreement of measurements made in some healthy representatives of that place with published reference values.
Vc and Dm were calculated using the Roughton–Forster model, with red cell CO conductance taken not from the early work of Roughton et al. 2 but from the more recent work of Forster and co-workers 6, 7. The reasons for this choice were two-fold. First, according to Forster and co-workers 6, 7, the latter work was performed at pH 7.4, whereas the former was performed at pH 8; therefore, R.E Forster, who was involved in both studies, recommends the equation of the latter work 7. Secondly, choosing the more recent equation gives Dm,CO in agreement with the theoretical value of the coefficient a, i.e. a ratio of Dm,NO (or TL,NO) to Dm,CO of ∼2 16, whereas using the early equation 2 requires empirically changing a to ∼2.4–2.5 29. As pointed out by Hughes and Bates 30, the use of this more recent value for haemoglobin CO conductance leads to 15–20% smaller Vc and 15–20% greater Dm,CO. If consensus can be reached regarding the choice of a and haemoglobin CO conductance, all published reference values of Vc and Dm,CO could be compared after appropriate correction.
A mean capillary oxygen tension of 13.3 kPa (100 mmHg) was chosen in both centres, leading to the hypothesis that the alveolar oxygen tension was 14.6 kPa (110 mmHg) and the mean difference between alveolar and capillary tension 1.33 kPa (10 mmHg). A small change in this oxygen tension has only a small effect on Vc, e.g. a capillary oxygen tension of 12.6 kPa (95 mmHg) instead of 13.3 kPa (100 mmHg) would reduce Vc by 1.2 mL.
In conclusion, simultaneous measurement of the transfer factor of the lung for nitric oxide and carbon monoxide permits calculation of the diffusing capacity of the membrane for carbon monoxide and capillary lung volume. The present study determined regression equations for the transfer factor of the lung for nitric oxide and carbon monoxide in normal subjects, as well as for the derived variables diffusing capacity of the membrane for carbon monoxide and capillary lung volume. All values decreased nonlinearly with age, and also varied with sex and height, but continued to fall with increased age. There were differences between the two populations tested. The role of chronic pollution in alveolar function requires further study.
APPENDIX
The interval of prediction of TL,CO for a new subject, based on their sex (S), age and height (H), is given by the formula:
E[TL,CO|S;A;H]±t(303;1–α/2)·√(C+CAA+CHH+CA2A2+CH2H2+CAHAH) (5)
where E[TL,CO is the predicted value for TL,CO, t(303;1–α/2) is the (1–α/2) quantile of the distribution with 303 degrees of freedom and C is the constants associated with age and height. For instance, for α = 0.05, t = 1.968. The values of C differ for males and females (table 4⇓).
Coefficients for the computation of the interval of prediction of dependent variables for the entire population
As for the previous variables, the interval of prediction for variables divided by VA can be computed using the following equation:
Y*(A)±t(303;1–α/2)·√(C+CAA+CA2A2) (6)
where Y*(A) is the predicted value and t(303;1–α/2) is the interval of prediction for the variables shown in table 5⇓.
Coefficients for the computation of the interval of prediction of dependent variables divided by alveolar volume(VA)
Support statement
S. Glénet is the recipient of a Pneumologie Développement (Paris, France) scholarship.
Statement of interest
None declared.
Footnotes
-
For editorial comments see page 918.
- Received May 24, 2007.
- Accepted January 7, 2008.
- © ERS Journals Ltd


