


Abstract
The purpose of the present study was to quantify the mechanical effect of genioglossus stimulation on flow mechanics and pharyngeal cross-sectional area in patients with obstructive sleep apnoea, and to identify variables that determine the magnitude of the respiratory effect of tongue protrusion.
The pressure/flow and pressure/cross-sectional area relationships of the velo- and oropharynx were assessed in spontaneously breathing propofol-anaesthetised subjects before and during genioglossus stimulation.
Genioglossus contraction decreased the critical pressure significantly from 1.2±3.3 to -0.7±3.8 cmH2O, with individual decreases ranging -0.6–5.9 cmH2O. Pharyngeal compliance was not affected by genioglossus contraction. The pharyngeal response to genioglossus stimulation was related to the magnitude of advancement of the posterior side of the tongue, but not to the severity of sleep apnoea, critical pressure, compliance or the shape and other characteristics of the velopharynx.
Genioglossus contraction enlarges both the velo- and the oropharynx and lowers the critical pressure without affecting pharyngeal stiffness. The response to genioglossus stimulation depends upon the magnitude of tongue protrusion achieved rather than on inherent characteristics of the patient and their airway.
Upper airway dilator muscle activity is crucial to the counteraction of the negative intraluminal pressure generated in the pharynx during inspiration. Diminution of this activity during sleep is thought to lead to pharyngeal collapse and obstruction in patients with obstructive sleep apnoea (OSA) 1–3. Activation of the genioglossus (GG), the main tongue protrusor, has been shown, in animal studies, to reduce pharyngeal resistance and collapsibility by far more than all other upper airway dilators 4, 5. As electrically induced 6 and volitional 7 tongue protrusion enlarge the pharynx and prevent pharyngeal obstruction during wakefulness, it appears conceivable that this muscle is the main pharyngeal dilator. Prevention of pharyngeal obstruction in patients with OSA by electrical stimulation (ES) of the GG (GG-ES) during sleep may both prove the dominant respiratory role of this muscle and provide a potential treatment modality.
Unfortunately, multiple trials attempting to relieve OSA by stimulating upper airway dilators during sleep resulted in modest and/or inconsistent results 7–13. In order to better understand the physiological effects of GG-ES on pharyngeal flow dynamics in OSA patients during sleep, a study 14 was recently conducted based on concepts of flow through a collapsible tube 15, 16. In this work, it was found that GG-ES resulted in a moderate decrease in the critical (closing) pressure (Pcrit), with similar results obtained using intramuscular and unilateral hypoglossal electrodes 14. Insufficient intensity of stimulation possible during sleep, failure to stimulate the relevant muscle(s) or hypotony of the nonstimulated upper airway muscles could all be part of the explanation for the lower response in humans, as compared with animals used in upper airway research.
The present study was designed to further evaluate the mechanical effects of electrically induced tongue protrusion on the pharynx. It was hypothesised that, if the GG is the main pharyngeal dilator, i.e. pharyngeal patency during wakefulness depends largely upon GG activity, GG contraction should prevent pharyngeal obstruction despite profound sleep- or anaesthesia-related hypotony of pharyngeal dilators. Therefore, studies were performed under propofol anaesthesia in order to establish stable muscle relaxation, ascertain adequate GG-ES without arousal, and enable undisturbed instrumentation and visualisation of the pharynx.
METHODS
Subjects
Letters were sent to all patients who had undertaken a full sleep study in the Technion Sleep Laboratory (Technion, Haifa, Israel) during the year prior to the present study requesting that they participate in this research and all volunteers were recruited. Patients with any disease that could pose a risk during anaesthesia, including ischaemic heart disease, any lung disease, severe or uncontrolled hypertension, and a body mass index (BMI) of >35 kg·m−2, as well as subjects with known side-effects to any previous anaesthesia, were excluded. All studies were performed in the respiratory research laboratory of Bnai Zion Medical Center (Technion). The aims and potential risks of the study were explained, and informed consent was obtained from all subjects. The study was approved by the Human Investigations Review Board of Bnai Zion Medical Center.
Recording procedures
The instrumentation used in the present study is shown in figure 1⇓. Standard polysomnographic techniques, including right and left electro-oculography (EOG), submental surface electromyography (EMG), C3/O1 and C3/A2 electroenephalography (EEG), ECG and oxygen saturation measurement, were employed in order to monitor anaesthesia and exclude arousal. Subjects breathed through a tight-fitting nasal mask and pneumotachometer, connected to a Validyne ±2 cmH2O pressure transducer (Validyne, Los Angeles, CA, USA), with the mouth carefully and tightly sealed. The pneumotachometer was connected to a digitised variable pressure source at the inflow port, enabling variation of nasal pressure (Pn) in the range 20– -10 cmH2O. Pn was monitored with a catheter connected to a side port of the mask. Intrathoracic pressure was measured with an oesophageal balloon catheter (Ackrad Laboratories, Cranford, NJ, USA), and used to recognise upper airway airflow limitation, as well as to distinguish between inspiration and expiration during complete apnoeas. Analogue-to-digital acquisition of all parameters was performed at 1,000 Hz for monitoring and data storage on a digital polygraphic data acquisition system (LabVIEW; National Instruments, Austin, TX, USA).

Schematic illustration of the experimental instrumentation. Patients were prepared as is customary in the sleep laboratory. In addition, an oesophageal balloon was used (placed more distally than shown) to measure intrathoracic pressure (Poes), and a pneumotachometer was connected to a digitised continuous positive airway pressure device. Pn: nasal pressure; EMG: electromyography; EOG: electro-oculography; EEG: electroenephalography.
Pharyngoscopy
A flexible fibreoptic endoscope (Olympus BF-3C40; Olympus, Tokyo, Japan; outside diameter 3.3 mm) was inserted through an adequately sealed port in the nose mask and positioned in the pharynx. The image was recorded on videotape, accompanied by audio explanations.
Anaesthesia
Propofol anaesthesia was delivered by an anaesthetist, using a loading dose of 2.5 mg·kg body weight−1 and continuous drip of 6–12 mg·kg body weight−1·h−1. Using levels of continuous positive airway pressure (CPAP) that enabled breathing without flow limitation, the aim was to maintain the patient under stable anaesthesia that eliminated any reaction to pain, ES and other manipulations, while maintaining adequate ventilation, as monitored by the pneumotachometer and pulse oximetry.
Electrical stimulation
GG-ES was applied via Teflon-coated 0.18-mm-diameter hook-wire electrodes with bared ends, inserted sublingually, bilaterally and 10–15 mm deep into the anterior retromandibular body of the GG, as previously described 13, 14. Four to six electrodes were inserted into each subject. Using a neuromuscular stimulator (Dynex III; Medtronic, Inc., Minneapolis, MN, USA), 40 Hz bursts of 2–6 s, with biphasic pulses of 100-μs width, were applied. Pharyngoscopic observation enabled selection of the electrodes and stimulation intensity that provided the best pharyngeal dilatory response. The intensity of stimulation was limited to levels that were well tolerated during wakefulness in previous and preliminary experiments.
Experimental procedure
Patients were prepared with EEG, EOG, submental EMG, venous access and an oesophageal balloon, and placed in the supine position. Following induction of anaesthesia, the Pn was raised to the level that abolished flow limitation (holding pressure), the endoscope and GG electrodes were positioned, optimal ES characteristics were determined and the mouth was sealed. The sites of velopharyngeal (VP) and oropharyngeal (OP) collapse were determined visually by lowering the Pn, also permitting determination of the primary site of pharyngeal collapse 17. Thereafter, the endoscope was placed first above the area of VP collapse. Flow/Pn and cross-sectional area (CSA)/Pn relationships before and during GG-ES were determined quasi-simultaneously. With the patient maintained at the holding pressure, Pn was lowered randomly for a few breaths, encompassing four to six levels associated with inspiratory flow limitation and the level below which airflow ceased and the VP occluded. At each Pn, after the fourth breath, GG-ES was performed for two or three consecutive breaths, and, after an additional two or three unstimulated breaths, the Pn was raised back to the holding pressure until stable baseline ventilation was observed. The same protocol was repeated after the endoscope was lowered below the VP site of collapse, to determine the OP CSA/Pn relationship.
In order to assess the effect of GG-ES on the OP flow/Pn and CSA/Pn relationships independently of the occlusion at the level of the VP, nasopharyngeal intubation was performed in six subjects. A No. 6.5 tube was inserted through the nose and placed, under endoscopic guidance, at the level of the lower rim of the soft palate, thereby preventing VP collapse. The outer end of the tube was cut and secured under the nasal mask.
Data analysis
The flow/Pn relationship data were analysed using digital software. Maximal inspiratory flow was measured at the level at which inspiratory flow was maximal and plateaued while oesophageal pressure fell progressively, indicating the presence of flow limitation. The flow/Pn relationship was determined using least-squares linear regression. This relationship was used to calculate the Pcrit as the Pn below which airflow became zero, as well as the flow/Pn slope. ΔPcrit (baseline Pcrit minus Pcrit during GG-ES) was used to quantify the mechanical effect of GG-ES. The lowest Pn at which no flow limitation occurred was derived from the flow/Pn curve.
The video images of the pharyngeal lumen, recorded during evaluation of the flow/Pn relationship before and during GG-ES, were digitised and viewed, and single images from the end-expiratory pause were captured and stored. The respiratory frequency of all of the patients was relatively low (always <20 breaths·min−1) due to the state of anaesthesia and high Pn preventing flow limitation, resulting in a sufficiently long end-expiratory pause (always >0.5 s). The computerised system extracted 10 images·s−1, and several equally sized pre-inspiratory pharyngeal CSAs were always available, indicating that this time was sufficient for pressure and CSA equilibration, and that pharyngeal intraluminal pressure, after this period without flow, was stable, i.e. equal to the Pn. The pharyngeal CSA in each digitised frame was outlined manually and calculated digitally using computer software. The oesophageal pressure tube, marked at regular levels, was used as a landmark, in addition to pharyngeal structures, to aid in measuring the CSA perpendicular to the pharyngeal axis, at the same distance from the endoscope before and during ES, and as a reference for calculating the CSA in absolute units. The CSA/Pn relationship (i.e. pharyngeal compliance) was determined for the close-to-linear portion of this relationship only, using least-squares linear regression, as the Pn range over which flow limitation occurs is always within this range (see Discussion section). In order to assess the effect of GG-ES on the OP Pcrit (which was often below the VP Pcrit, i.e. at Pn without airflow), the Pcrit was calculated from the CSA/Pn relationship.
In addition to the CSA/Pn relationships of the VP and OP, visualisation of the pharynx enabled determination of several other parameters considered potentially relevant to understanding the effect of GG-ES on pharyngeal patency: primary site of collapse (VP or OP, before and during GG-ES); effect of GG-ES on the posterior side of the tongue; presence of visible oscillations of the pharyngeal walls; and changes in the shape of the VP during both lowering of Pn and GG-ES. In patients in whom the OP was studied, the retroepiglottal CSA, as well as the magnitude of forward movement of the posterior side of the tongue during GG-ES, was determined by measuring the anteroposterior diameter of the OP at the level of the epiglottis crest.
Paired and unpaired t-tests were used to assess the effect of GG-ES and compare groups, respectively. ANOVA was used for comparison of results over the range of OSA severity groups. Correlations were assessed by least-squares methods. Chi-squared logistic regression analysis was used to compare the categorical variables.
RESULTS
The anthropometric and polysomnographic characteristics of the study subjects (n = 32; all male) are given in table 1⇓. Patients were predominantly middle-aged, and only 10 had a BMI of >30 kg·m−2. Five patients were hypertensive, one had mild diabetes and none exhibited any other significant disease. The subjects had a wide range of apnoea/hypopnoea index (AHI), and could be divided into four OSA severity groups: five subjects with an AHI of 4–5 events·h−1, defined as a borderline disorder; 11 subjects with mild OSA (AHI of 6–20 events·h−1); eight subjects with moderate OSA (AHI of 21–40 events·h−1); and eight subjects with severe OSA (AHI of >40 events·h−1). The mean age of the four groups was not significantly different. The AHI tended to increase with increasing BMI (R = 0.44; p<0.05). None of the patients showed only rapid eye movement (REM) OSA, and, with increasing OSA severity, the percentage of apnoeas and hypopnoeas observed during REM sleep declined significantly (R = -0.61; p<0.001). The percentage of complete apnoeas and the sleep time with an arterial oxygen saturation of <90%, as well as the lowest arterial oxygen saturation recorded during sleep, increased with increasing OSA severity (R = 0.72, 0.56 and -0.48, respectively; p<0.01).
Anthropometric and polysomnographic characteristics of the obstructive sleep apnoea subjects by severity
Flow
Baseline findings
The VP was the primary site of collapse in all of the present subjects, based on the simultaneously observed occlusion of the VP and cessation of airflow; however, in six patients, almost simultaneous occlusion at the OP level could be noted. At all Pn above Pcrit, OP CSA was larger than VP CSA, including in patients who showed occlusion at approximately the same Pn at both levels. Therefore, the magnitude of flow limitation was always determined by the VP. Data derived from the flow/Pn relationship measurements of the upper airway, over the range of flow limitation, are given in table 2⇓. In the baseline condition, without GG-ES, the mean Pcrit increased significantly with increasing OSA severity. As shown in figure 2⇓, the Pcrit correlated significantly with the AHI (R = 0.45; p<0.01). With the exception of one patient, only subjects without or with mild OSA exhibited a Pcrit below atmospheric pressure, and all patients with severe OSA exhibited Pcrit of ≥0 cmH2O. No correlation was found between the slope of the flow/Pn relationship and Pcrit or AHI. At atmospheric pressure (i.e. without CPAP; Pn of 0 cmH2O), airflow was present, by definition, only in subjects with a Pcrit of <0 cmH2O.
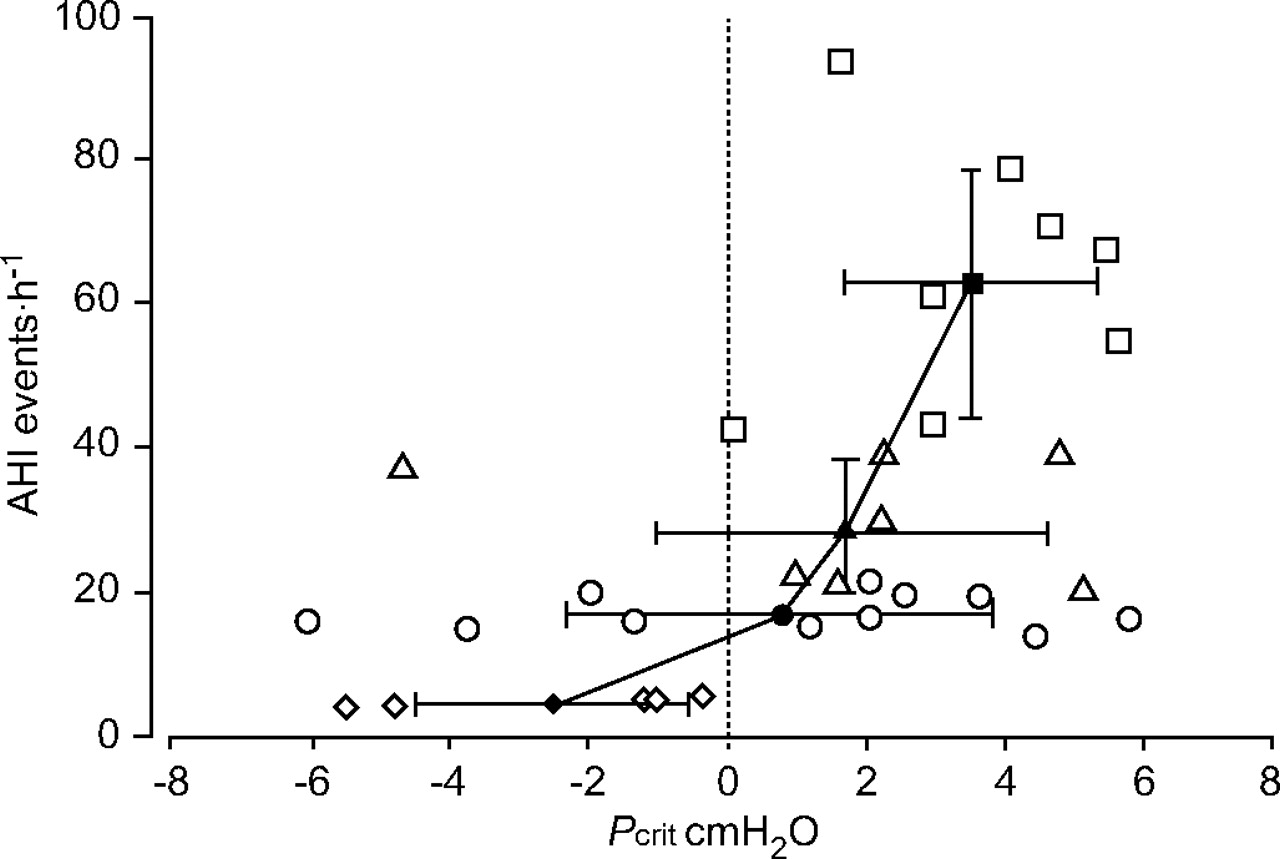
Relationship between apnoea/hypopnoea index (AHI) during sleep and critical pressure (Pcrit) obtained under anaesthesia in all study participants. ⋄ and ♦; normal (AHI <6 events·h−1); ○ and •: mild obstructive sleep apnoea (OSA; AHI 6–20 events·h−1); ▵ and ▴: moderate OSA (AHI 21–40 events·h−1); □ and ▪: severe OSA (AHI >40 events·h−1). Open symbols represent single individuals and closed symbols represent group mean±sd.
Effect of electrical stimulation of the genioglossus(GG-ES) on upper airway flow/pressure relationship parameters by obstructive sleep apnoea (OSA) severity
Effect of ES on the VP
GG-ES reduced the Pcrit and the Pn below which flow limitation occurred significantly (table 2⇑). The ΔPcrit was positive in all but one subject, ranging -0.6–5.9 cmH2O (mean±sd 2.0±1.8 cmH2O), and was similar in all subgroups. It was independent of baseline Pcrit (fig. 3⇓), and did not correlate with any of the anthropometric, polysomnographic or flow mechanical parameters evaluated in the present study. Increases in airflow at atmospheric pressure (without CPAP), during GG-ES, occurred in five of the patients with mild OSA, but only in two patients in each of the other OSA subgroups, resulting in small mean flows in the OSA subgroups compared with the healthy subjects (table 2⇑). The GG-ES-induced increase in airflow at atmospheric pressure correlated significantly with the baseline Pcrit and ΔPcrit (R = -0.66 and 0.55, respectively; p<0.01). The flow/Pn slope was not affected by GG-ES, i.e. GG-ES shifted the flow/Pn relationship to the left similarly in all subgroups (table 2⇑).

Relationship between critical pressure (Pcrit) before (BL) and during electrical stimulation (ES) of the genioglossus (GG-ES). ♦: normal (apnoea/hypopnoea index (AHI) <6 events·h−1); •: mild obstructive sleep apnoea (OSA; AHI 6–20 events·h−1); ▴: moderate OSA (AHI 21–40 events·h−1); ▪: severe OSA (AHI >40 events·h−1). Points represent individual subjects. -----: line of abscissa and ordinate equality. The almost parallel shift of the relationship between BL and ES Pcrit demonstrates that the GG-ES-induced decrease in Pcrit was independent of BL Pcrit.
Effect of ES on the OP
The effects of GG-ES on the flow/Pn relationship of the OP were evaluated in the six patients with nasopharyngeal intubation. In these patients, GG-ES reduced the Pcrit from a mean±sd baseline of -5.7±3.2 to -9.9±3.9 cmH2O (p<0.01). Their mean ΔPcrit (3.9±1.1 cmH2O) was significantly higher than their ΔPcrit assessed without nasopharyngeal tube, i.e. determined by the VP (1.9±1.3 cmH2O; p<0.05). The flow/Pn slope of the OP was not affected by GG-ES. The OP ΔPcrit of these subjects was similar to the ΔPcrit of the subjects whose OP was studied without nasopharyngeal intubation, and their Pcrit was determined from the CSA/Pn relationship (4.2±2.9 cmH2O; p>0.7).
Effect of the endoscope on upper airway assessment
In order to evaluate the possible effect that the endoscope could exert upon the present results, the flow/Pn relationships obtained while the endoscope was positioned above the VP were compared to those obtained while the endoscope was positioned below the VP, to observe the OP. No significant difference was observed between the two sets of measurements. The baseline Pcrit was 0.2±3.3 and 0.6±3.3 cmH2O with the endoscope above and below the area of VP collapse, respectively, and decreased to -1.7±3.9 and -1.3±3.2 cmH2O during ES (p>0.2 for comparison of measurements performed with the endoscope above and below the VP). Similarly, the position of the endoscope did not affect the flow/Pn slope (p>0.7 for comparison of the two measurement sets). In three other patients, the flow/Pn relationship was also evaluated before insertion of the endoscope. In these patients too, the endoscope had only negligible effects on the Pcrit and flow/Pn slope. The baseline Pcrit was 2.9±1.7 and 3.3±0.8 cmH2O without and with the endoscope, respectively, and GG-ES reduced the Pcrit to 0.5±1.0 and 0.4±0.9 cmH2O.
Pharyngoscopy
VP compliance
VP compliance (CSA/Pn) varied considerably between patients. It correlated significantly with the patients’ BMI (R = 0.45; p<0.05), but not with their Pcrit, flow/Pn relationship or AHI. Endoscopic images depicting the effect of GG-ES on the VP at three different Pn in one of the patients are shown in figure 4⇓. GG-ES enlarged the VP at all Pn above the Pcrit, but had, on average, no effect on VP compliance (16.4±11.2 and 14.9±10.0 mm2·cmH2O−1 before and during GG-ES, respectively; p>0.6). As pharyngeal occlusion is recognised by both zero CSA and flow, the Pcrit derived from the flow/Pn and CSA/Pn were very close (1.2±3.3 versus 1.4±2.8 cmH2O at baseline; -0.7±3.8 versus -0.5±2.9 cmH2O during GG-ES, respectively). Therefore, GG-ES shifted the CSA/Pn relationship to the left, towards lower Pn (fig. 5⇓). In addition, VP compliance did not affect the Pcrit response to GG-ES (R = -0.09 for correlation between VP compliance and ΔPcrit), neither did changes in compliance correlate with changes in the Pcrit (R = -0.29, p>0.2).

Velopharynx images at various nasal pressures (continuous positive airway pressure (CPAP)): a, b) 10 cmH2O, c, d) 6 cmH2O and e, f) 4 cmH2O, before (a, c and e) and during (b, d and f) electrical stimulation of the genioglossus (GG-ES). In this patient, GG-ES had a similar effect on the velopharynx as the application of CPAP of ∼4 cmH2O. Arrows indicate: b) velopharyngeal orifice; d) oesophageal tube; and f) anterior side.

Relationship between velopharyngeal (VP) cross-sectional area (CSA) and nasal pressure (Pn), i.e. VP compliance, over the range of flow limitation. Data are given for each apnoea/hypopnoea index (AHI) subgroup before (⋄, ○, ▵, □) and during (♦, •, ▴, ▪) electrical stimulation of the genioglossus (GG-ES). ⋄ and ♦: normal (AHI <6 events·h−1); ○ and •: mild obstructive sleep apnoea (OSA; AHI 6–20 events·h−1); ▵ and ▴: moderate OSA (AHI 21–40 events·h−1); □ and ▪: severe OSA (AHI >40 events·h−1). Each line represents the mean CSA/Pn relationship of all subjects of the subgroup. Arrows indicate the direction and magnitude of the GG-ES-induced shift in the CSA/Pn relationship. VP compliance was not affected by GG-ES. On average, GG-ES enlarged the VP CSA (upshift at any given Pn) similarly over the whole range of Pn associated with flow limitation, and independently of the baseline critical pressure.
Determinants of the response to ES of the GG
Since the primary goal of pharyngoscopy was assessment of parameters that may affect the response to GG-ES, the patients were divided into two equal groups with ΔPcrit of <1.5 and >1.5 cmH2O, i.e. nonresponders (ΔPcrit of 0.7±0.6 cmH2O; n = 16) and responders (ΔPcrit of 3.3±1.5 cmH2O; n = 16), respectively. The two groups were compared for the incidence of nonparametric pharyngoscopic data expected to affect the response to GG-ES (fig. 6⇓).

Comparison between subjects with larger (□; >1.5 cmH2O) and smaller (░; <1.5 cmH2O) responses to electrical stimulation of the genioglossus (GG-ES), undertaken to assess relationships between pharyngoscopic findings and the critical pressure (Pcrit) response to GG-ES (ΔPcrit). Only anterior movement of the posterior side of the tongue was significantly related to a substantial reduction in velopharynx (VP) collapsibility, i.e. more prevalent in the group with a larger ΔPcrit. VPoccl: primary site of occlusion in the VP; VPAP: occlusion of the VP mainly in the anteroposterior direction with decreasing nasal pressure; FLvib: visible oscillations/vibrations of the pharyngeal walls during flow limitation; Tdown: downward movement (depression) of the posterior part of the tongue during GG-ES; Tfwd: forward movement (protrusion) of the posterior part of the tongue during GG-ES. #: p<0.04.
The primary site of occlusion was similar in the two groups of patients, i.e. the six patients with simultaneous VP and OP occlusion responded to GG-ES similarly to the other patients. GG-ES had no effect on the site of occlusion in most subjects, changing it variably in five of the patients (three from simultaneous VP and OP to primary VP occlusion, and two from VP to simultaneous VP and OP occlusion).
The shape of the VP orifice was variable (mainly elliptical, rectangular or crescent-like), but, at Pn at which no flow limitation occurred, the transverse diameter always exceeded the sagittal diameter. With decreasing Pn, two patterns of narrowing could be distinguished, with the shape of the orifice just before occlusion becoming either a transverse slit (i.e. predominant sagittal narrowing of the VP), suggesting that the main occluding force was the weight of the tongue, or a round orifice (i.e. transverse narrowing exceeding sagittal narrowing), suggesting larger forces from the lateral walls. The two patterns of occlusion were present similarly in patients with lower and higher ΔPcrit (fig. 6⇑), indicating that this parameter did not affect the ΔPcrit, and suggesting that GG contraction may exert a mechanical effect on the lateral walls of the pharynx.
Oscillation or vibration of the VP walls was observed in 14 of the subjects, almost exclusively at lower Pn during inspiratory flow limitation. In all other subjects, flow limitation occurred without visible vibrations. Although visible vibrations may be a marker of increased wall pliability, no significant relationship was found between their presence and ΔPcrit.
Placing the endoscope above the area of VP collapse gave sufficient overview of the OP to recognise the direction of tongue movement during GG-ES in all patients, including those in whom no separate OP studies were performed. Two patterns of movements of the posterior side of the tongue during GG-ES could be distinguished: 1) a descent or depression of the tongue, occasionally associated with mild posterior bulging; and 2) forward displacement of the tongue. Descent of the tongue could be expected to unload the VP anterior wall (soft palate), but this pattern of tongue movement was not more common in subjects with a high ΔPcrit. Similarly, the combination of forward displacement and descent of the tongue during GG-ES was not associated with a higher ΔPcrit, and was observed in two and three patients in the low and high ΔPcrit groups, respectively. However, visible forward displacement of the posterior part of the tongue during GG-ES was more common in the high ΔPcrit group (fig. 6⇑). When the effect of each of the five parameters evaluated in this section was assessed using a forward stepwise regression model for categorical variables, only visible forward displacement of the tongue was found to be significant (p<0.04).
The oropharynx
Endoscopic images depicting the effect of GG-ES on the OP at three different Pn in one of the patients are shown in figure 7⇓. OP studies (without nasopharyngeal intubation) were performed in 14 subjects, and their data are shown in table 3⇓, compared to the VP data of the same patients. Although the baseline OP Pcrit tended to be higher in patients with moderate and severe OSA (as compared to those with no and mild OSA), the difference was nonsignificant (p>0.5). The baseline OP Pcrit was significantly lower than that of the VP (-2.6±3.9 and 0.3±3.4 cmH2O, respectively; p<0.03). Patients with higher OP Pcrit tended also to show higher VP Pcrit, but this correlation was nonsignificant (R = 0.34; p>0.3). GG-ES had a greater effect on the OP than on the VP (ΔPcrit of 4.2±2.9 and 2.3±1.9 cmH2O, respectively; p<0.03). There was a significant correlation between OP and VP ΔPcrit (R = 0.55; p<0.05). OP compliance was significantly larger than VP compliance (p<0.03), and there was no correlation between OP and VP compliance (R = 0.09). GG-ES did not affect OP compliance.

Oropharyngeal images at various nasal pressures (continuous positive airway pressure (CPAP)): a, b) 8 cmH2O, c, d) 4 cmH2O and e, f) 0 cmH2O, before (a, c and e) and during (b, d and f) electrical stimulation of the genioglossus (GG-ES). In this patient, GG-ES had a greater effect on the oropharynx than the application of CPAP of >4 cmH2O. Arrows indicate: b) epiglottis (white) and tongue (black); d) oesophageal tube; and f) anterior side.
Comparison of the effects of electrical stimulation of the genioglossus(GG-ES) on oropharyngeal (OP) and velopharyngeal (VP) characteristics
The significant relationship between GG-ES-induced advancement of the tongue and the ΔPcrit, presented qualitatively for the whole group in figure 6⇑, could be assessed more accurately in this subgroup of patients with OP studies, by measuring their OP sagittal diameter and its change during GG-ES. A significant correlation was found between the GG-ES-induced increase in OP sagittal diameter and the increase in the CSA of both the OP and VP (R = 0.60 and 0.62, respectively, assessed at atmospheric pressure; p<0.01; fig. 8⇓).

Relationship between the magnitude of electrical stimulation of the genioglossus (GG-ES)-induced protrusion of the posterior side of the tongue (ΔOPAP) and the concomitant increase in cross-sectional area (ΔCSA) of the velopharyngeal (VP; ♦; ––––) and oropharyngeal (OP; ⋄; -----) in the subgroup of patients in whom OP anteroposterior diameter was measured. Points represent individual subjects (n = 14). The data were measured at atmospheric pressure (nasal pressure of 0 cmH2O). The GG-ES-induced OP ΔCSA was greater than VP ΔCSA in all subjects. ΔOPAP correlates significantly with ΔCSA at both levels (p<0.01).
The position of the epiglottis, assessed by separate measurements of the retroglottal CSA, varied substantially between subjects, since the epiglottis sometimes leaned on the posterior OP wall even at high Pn with the OP widely open. This position did not cause flow limitation. Similarly, the response of the epiglottis to GG-ES was variable, and did not correlate with the change in OP CSA.
DISCUSSION
The present study evaluated the effect of electrically induced GG contraction on pharyngeal lumen, mechanics and flow dynamics in anaesthetised subjects with a wide range of AHI. The main findings were as follows. 1) On average, GG-ES exerted a moderate effect on pharyngeal airflow, but the range of mechanical response was wide, and substantial improvement in pharyngeal patency was observed in half of the patients. 2) Improved response to GG-ES was related primarily to the magnitude of forward displacement of the tongue, rather than to the inherent characteristics of the patients and airways evaluated in this study. 3) GG-ES decreased collapsibility primarily by enlarging the pharynx rather than changing its compliance.
ES of striated muscle is an important tool for the assessment of its mechanical effect and has been largely employed for the study of upper airway dilator muscles. Understanding the response to isolated contraction of these muscles provides insight into their effect when activated physiologically in conjunction with other muscles. In the case of GG-ES, evaluation of its mechanical effects on the pharynx may also reveal physiological findings of direct clinical relevance, enabling the development of new treatment modalities for OSA, based on electrical activation of the GG during sleep. In the present study, it was decided to use anaesthesia for the assessment of the mechanical effect of GG-ES in OSA patients, to enable endoscopic evaluation of the effect of contraction of this muscle over a broad range of Pn, a task that could not be performed during normal sleep. It is important to note that the use of anaesthesia poses substantial limitations to extrapolation of the present findings to conditions occurring during sleep. Anaesthesia may produce more muscle relaxation than sleep, rendering the upper airway more passive and more collapsible 18. Drug-induced depression of neural output to the GG could affect its response to ES, although propofol does not influence involuntary isometric skeletal muscle strength 19. In addition, changes in lung volume are known to affect pharyngeal stability, lung volume may change differently during anaesthesia and sleep, and changes in lung volume were not measured in the present study.
However, in the present study, a similar baseline Pcrit and decrease in Pcrit during GG-ES to that obtained in previous work, performed using very similar stimulation and flow/Pn evaluation techniques, was found during sleep 14. This finding indicates that the magnitude of response in the previous study was not due to the limited intensity of stimulation feasible during sleep (to prevent arousal), but that the intensity of stimulation required to obtain adequate GG contraction with optimal mechanical effect is rather low. In addition, this finding also suggests that the effect of anaesthesia on the response to GG-ES was not substantial. This was probably due to the technique used to assess Pcrit during sleep (repetitive Pn drops from a high Pn), designed to assess pharyngeal collapsibility in the presence of maximal upper airway dilator muscle relaxation 16, 20. Moreover, 19 OSA patients from the current study independently underwent clinical sleep studies for the titration and adjustment of CPAP. In these patients, the mean recommended CPAP was very close to the mean pressure under which flow limitation was observed during anaesthesia (7.89±2.40 and 7.97±2.92 cmH2O, respectively). These findings support previous observations suggesting that the mechanical properties of the pharynx during propofol anaesthesia correlate with those observed during sleep 21.
Another concern related to the use of anaesthesia was that, although an attempt was made to obtain stable anaesthesia by administering propofol by continuous infusion, using a dose sufficient to abolish responses to pain and prevent arousal in each subject while maintaining stable breathing, the depth of anaesthesia was not monitored. Therefore, depth of anaesthesia varied between subjects, and could change slightly during the few minutes required to evaluate the pharynx at several Pn. However, Pn drops were performed in random order, and, at each Pn, a stimulated breath followed the unstimulated one. Therefore, it is thought that instability of anaesthesia is unlikely to have systematically affected the response to GG-ES. For the same reasons, it is thought that the subtle unintended changes in neck position, which could have occurred during the study since the heads of the patients were not fixed firmly to the bed, were unlikely to cause systematic errors. Interestingly, the presence and position of the endoscope had a negligible effect on the present results. All this suggests, therefore, that the experimental conditions did not cause significant distortion of the results, and that the present findings are likely also to be relevant during sleep. Conversely, more caution is warranted in predicting the potential therapeutic effect of GG-ES during sleep from mechanical findings. The severity of AHI is only partially explained by mechanical properties 22. Sleep is characterised by oscillations in the control of pharyngeal patency, a phenomenon suggested as being the most important for the occurrence and severity of OSA, and such oscillations did not occur under the conditions of the present study.
The use of pharyngoscopy permitted the assessment of several parameters that could aid understanding of the mechanical action of GG contraction, as well as evaluation of their effect on the response to GG-ES. This includes the end-expiratory CSA/Pn relationship at the VP and OP level used, as in previous studies 23, 24, as a measure of wall compliance in the area in which collapse occurs at low Pn. Several limitations of this method of assessing compliance, as well as the specific methodology used in the present study, need to be addressed. Anatomical structures and markings on the oesophageal tube, but no specific methodology, were used to ensure that the CSA plane measured was and remained perpendicular to the axis of the pharynx, and that the distance from the endoscope remained unchanged during ES. However, as stimulated breaths followed nonstimulated ones, and ES-induced changes were rather modest, it is thought that the possible inaccuracies were small and did not introduce any systematic error. An unavoidable confounder is the unknown change in lung volume caused by changes in Pn, causing the CSA/Pn relationship to include the mechanical effects of changing lung volume 23. Also, changes in CSA over the range of Pn evaluated may also change the resting length of the GG and, therefore, its shortening during ES 25, and could affect the CSA/Pn slope during ES. In addition, the overall CSA/Pn relationship of the pharynx is typically exponential, initially rising steeply and almost linearly from the Pcrit with increasing Pn, up to near-maximal distension, after which increasing Pn produces only minor dilation 23.
In the present patients, as in previous studies 26, flow limitation occurred only in the lower Pn range of the steep part of the CSA/Pn curve. As only this Pn range was considered relevant to flow mechanics, CSA/Pn measurements in most patients were limited to the steeper quasi-linear portion, as previously suggested 27. This caused a loss of additional information relevant to overall pharyngeal tube law. Therefore, the present study provides information regarding the interaction between the CSA/Pn slope and GG-ES only over the range of flow limitation, whereas the complete curve, which could provide information on the effect of GG-ES on the maximal segmental CSA and the estimated external pressure, remains to be evaluated.
Although pharyngeal compliance is expected to have a major impact on pharyngeal collapsibility, no significant correlation was found between the baseline CSA/Pn slope and AHI or Pcrit. Similarly, although it was expected that low compliance (i.e. a stiffer pharynx) would enhance the flow mechanical effect of tongue protrusion, no correlation was found between VP compliance and ΔPcrit. These findings suggest that other baseline parameters and forces acting on the pharynx mask the mechanical effects of pharyngeal compliance. For example, VP compliance was much lower than OP compliance, but VP Pcrit was usually higher, due to the smaller maximal distension size of the VP. Interestingly, although the lack of GG-ES effect on VP compliance may have been expected 27, since forward displacement of the tongue mainly unloads the soft palate, GG-ES also failed to change OP compliance, at variance with the previous findings of Isono et al. 27. However, in the latter study, the whole tongue (i.e. including retractors) was stimulated, and, in four out of the five patients in whom compliance decreased, this decrease was associated partially or totally with a reduction in maximal CSA, as observed in the present study, which evaluated the effects of ES of tongue retractors 28.
The current findings suggest that GG-ES applied near the mandible fails to stiffen the posterior side of the tongue, or that stiffening of the GG without a similar change in other parts of the tongue and/or the lateral OP walls has no effect on overall OP compliance. Either way, GG-ES-induced forward displacement of the tongue, under the present experimental conditions, enlarged the pharynx and reduced Pcrit, primarily by mechanisms not related to changes in CSA/Pn. With compliance remaining unchanged, GG-ES seems to reduce Pcrit primarily by unloading (i.e. reducing external pressure) of the collapsible segment, a parameter known to be a most prominent mechanism determining pharyngeal patency 29. The finding that GG-ES-induced forward displacement of the tongue enlarged the VP in both the sagittal and lateral direction suggests that GG contraction also affects the lateral pharyngeal walls, as described during medial hypoglossus branch stimulation in rats 30, and probably involves mechanical coupling of the base of the tongue and soft palate via the fauces 31.
Attempts have been made to stimulate upper airway dilator muscles in OSA patients ever since the physiological importance of these muscles’ action began to be appreciated, but preliminary attempts were unsuccessful 11. Miki et al. 8 later reported successful amelioration of OSA with submental ES, thought to activate the GG, but these results could not be reproduced by other investigators 7, 9, 11. Attempts to use computed tomographic guidance for the implantation of fine-wire electrodes in close proximity to anterior branches of the hypoglossus nerves in OSA patients resulted in partial responses that were not reproducible in a systematic fashion 9. Similarly, flow increased when ES was applied via fine-wire electrodes implanted into the GG in OSA patients 13, but apnoeas could not be prevented without the use of CPAP. Sublingual ES with surface electrodes produced mechanical improvements 6, but insufficient to be clinically useful 12. More recently, hypoglossus nerve stimulation with cuff electrodes has been shown to be effective 10, and a multicentre study, evaluating the effect of cuff electrodes implanted unilaterally on the anterior branch of the hypoglossus nerve, demonstrated a significant, but only partial, improvement in OSA 32.
In continuation of previous work, the present study was undertaken in order to further evaluate the respiratory action of the GG and the magnitude of improvement in pharyngeal patency expected to be achieved by this muscle, considered to be the main pharyngeal dilator. Both parameters associated with the pattern of response to GG-ES and others related to the patients and the mechanical characteristics of their pharynx were evaluated. Unsurprisingly, it was found that the GG-ES-induced pharyngeal enlargement and reduction in Pcrit correlated with the magnitude of forward displacement of the tongue, assessed by either observation (fig. 6⇑) or measurement (increase in OP sagittal diameter; fig. 8⇑). GG-ES successfully advanced the posterior wall of the tongue in this study in only a proportion of the subjects, and these subjects benefited most from this intervention. As seen in figure 1⇑, the unique fibre orientation of the GG implies that contraction of the GG as a whole may not be adequate, since only horizontally and diagonally oriented fibres can advance the posterior part of the tongue and are expected to be responsible for the respiratory function of this muscle. Indeed with the mouth closed, contraction of vertically oriented fibres, which depress the tongue, may cause posterior bulging and obstruction. Conversely, responses to GG-ES were not related to severity of OSA (either AHI or baseline Pcrit), site of collapse and pattern of VP closure, or compliance of the pharynx. Hence, the present findings suggest that improving stimulation methods in order to focus on relevant GG fibres 33, rather than patient selection, is the most promising step expected to improve the results of GG-ES. However, patients with an OP primary site of occlusion were not studied. It may be speculated that, in patients in whom OP Pcrit is substantially higher than VP Pcrit, GG-ES may be more effective, since the OP response to GG-ES was significantly greater than that of the VP. Also, considering the large number of parameters that could affect the response to GG-ES, it is possible that parameters not evaluated in this study may have affected the results. For example, specific facial/skeletal morphometry and inherent physiological characteristics may affect the GG response to ES, and therefore the magnitude of forward displacement of the tongue. In addition, based on the maximal ΔPcrit observed in the present patients, GG contraction, as produced in the present study, is unlikely to stabilise the pharynx to the level present during wakefulness, or to completely prevent OSA in patients who have a Pcrit of >4–5 cmH2O. The fact that the pharynx is maintained patent during wakefulness, although the GG is only partially active 34, indicates that physiological activation of the GG differs from that produced by ES, and/or that forces other than those produced by GG contraction play a dominant role in the maintenance of pharyngeal patency, and also affect the response to GG contraction 25.
The present study was undertaken in order to quantify the mechanical respiratory function of the genioglossus and factors that affect pharyngeal response to electrical stimulation of the genioglossus, rather than to assess the clinical usefulness of this method. Nevertheless, several conclusions may be relevant and important in the further pursuit of a treatment modality based upon upper airway muscle stimulation during sleep. First, the field of electrical stimulation of the genioglossus should be narrowed and focus on specific fibre bundles of the genioglossus acting to advance the posterior part of the tongue. Secondly, although the magnitude of response to electrical stimulation of the genioglossus seems to be independent of the inherent characteristics of the patients evaluated in the present study, the responses obtained suggest that this treatment modality alone is unlikely to be sufficient in patients with a very high critical pressure, even if an adequate mode of stimulation can be found. In addition, pharyngeal compliance is not affected by electrical stimulation of the genioglossus, and other means should be pursued in order to reduce (mainly velopharyngeal) compliance during sleep. Nevertheless, although the genioglossus is only one of many muscles that act in concert to prevent flow limitation in the pharynx, it may substantially improve pharyngeal patency when activated adequately to obtain optimal anterior displacement of the tongue.
- Received October 7, 2006.
- Accepted May 23, 2007.
- © ERS Journals Ltd
References


