


Abstract
A recent American Thoracic Society and European Respiratory Society joint Task Force report recommends using a lower limit of normal (LLN) of forced expiratory volume in one second/forced vital capacity as opposed to a fixed ratio of <0.7 to diagnose airflow obstruction, in order to reduce false positive diagnoses of chronic obstructive pulmonary disease (COPD) as defined by the Global Initiative for Obstructive Lung Disease (GOLD). To date, there is no reliable spirometry-based prevalence data for COPD in New Zealand and the effect of different definitions of airflow obstruction based on post-bronchodilator spirometry is not known.
Detailed written questionnaires, full pulmonary function tests (including pre- and post-bronchodilator flow–volume loops) and atopy testing were completed in 749 subjects recruited from a random population sample.
The GOLD-defined, age-adjusted prevalence (95% confidence interval) for adults aged ≥40 yrs was 14.2 (11.0–17.0)% compared with an LLN-defined, age-adjusted, post-bronchodilator prevalence in the same group of 9.0 (6.7–11.3)%.
The prevalence of chronic obstructive pulmonary disease varied markedly depending on the definition used. Further research using longitudinal rather than cross-sectional data will help decide the preferred approach in chronic obstructive pulmonary disease prevalence surveys.
The significance of chronic obstructive pulmonary disease (COPD) as a cause of global morbidity and mortality is undisputed. Within the next 20 yrs, COPD is projected to move from the sixth to the third most common cause of death worldwide, while rising from fourth to third in terms of morbidity within the same time-frame 1.
For such a significant condition, there is a relative dearth of accurate prevalence information, a major difficulty being a lack of consensus about the definition of COPD 2. A number of different approaches have been used, including self-reporting, doctor diagnosis, diagnosis based on the presence of respiratory symptoms and diagnosis based on the presence of various definitions of airflow limitation (pre- or post-bronchodilator). The Global Initiative for Chronic Obstructive Lung Disease (GOLD), first published in 2001 and at present updated yearly, has resulted in an agreement on spirometry thresholds for diagnosis and severity and has become the gold standard, at least for epidemiological purposes. GOLD defines COPD as a post-bronchodilator ratio of forced expiratory volume in one second (FEV1) to forced vital capacity (FVC) of <0.7 3. A very similar definition (post-bronchodilator FEV1/FVC ≤0.7) has been agreed on by the American Thoracic Society (ATS) and the European Respiratory Society (ERS) 4.
While it is generally accepted that the FEV1/FVC ratio is the most important guide when identifying airflow obstruction, the practice of classifying values of FVC and FEV1 <80% predicted and a fixed FEV1/FVC ratio of <0.7 as abnormal has no statistical basis 5. Since FEV1/FVC ratios decrease with age, a fixed ratio results in an apparent increase in the prevalence of impairment associated with ageing or with age-confounded factors, such as cigarette smoking 5. However, one statistically acceptable approach for establishing lower limits for any spirometric measure is to define the lowest 5% of the reference population as below the lower limit of normal (LLN) 5. In contrast to the ATS, ERS and GOLD definitions of COPD, a recent joint ATS/ERS Task Force has proposed using a cut-off value for the FEV1/FVC ratio set at the fifth percentile of the normal distribution, rather than at a fixed value of 0.7, in an attempt to reduce the number of false positive diagnoses 6. It was also noted that a slow vital capacity (SVC) manoeuvre may be more accurate than using FVC to diagnose airflow obstruction. However, the two studies on which the LLN recommendation was made did not include post-bronchodilator spirometry 7, 8, which is a prerequisite for the definition of airflow limitation that is not fully reversible 3, 4, 9.
In the present study, the main aim was to establish the GOLD-defined prevalence of COPD in an adult urban New Zealand population for the first time. Additionally, the current authors aimed to compare the GOLD-defined prevalence rate with that obtained with the LLN definition of FEV1/SVC and FEV1/FVC using both pre- and post-bronchodilator values.
METHODS
Study subjects
A total population of 3,500 individuals, randomly selected and equally divided among five groups according to age at the time of selection (25–34, 35–44, 45–54, 55–64 and 65–74 yrs), were sent a postal screening questionnaire (SQ). Subjects were identified from the New Zealand electoral register for five electoral wards in the Greater Wellington region and the separate Maori (the main ethnic minority) electoral register constrained for the same geographical area. Subjects who completed the SQ were invited to attend the research centre to complete an interviewer-administered questionnaire (referred to as the main questionnaire (MQ)), followed by visits to undergo: detailed pulmonary function testing; exhaled nitric oxide measurements; peak flow recordings over a 1-week period; skin-prick testing; blood tests (full blood count, carboxyhaemoglobin level, total serum immunoglobulin E level, α1-antitrypsin level and DNA extraction); urinary cotinine; and a computed tomography scan of the chest. The Wellington Ethics Committee approved the study and written informed consent was obtained from each subject.
Questionnaire
All participants completed a detailed written questionnaire compiled from a series of validated questionnaires 10 and administered by a trained interviewer in a standardised manner. Data obtained by the questionnaire included: demographic information; respiratory history and symptoms; smoking history, including exposure to marijuana and environmental tobacco smoke; allergy; family history; occupation; medication; and use of health services. Smoking status was a calculated field based on smoking of tobacco cigarettes. The pack-yr field was based only on the tobacco cigarette history, with 1 pack-yr defined as equivalent to 20 cigarettes·day−1 for 1 yr.
Pulmonary function tests
These have been described in detail elsewhere 11, 12. In brief, pulmonary function tests (PFTs) were carried out on one site using two Jaeger Master Screen body volume constant plethysmography units with pneumotachograph and diffusion unit (Masterlab 4.5 and 4.6; Erich Jaeger, Wurzburg, Germany) by trained operators. All measurements were carried out in accordance with ATS and ERS guidelines 13–15. Measurements of lung volumes and spirometry were repeated 45 min after the administration of 400 μg of salbutamol (VentolinTM; GlaxoSmithKline (NZ) Ltd, Auckland, New Zealand) via a spacer (Space ChamberTM; Medical Developments International Ltd, Springvale, Australia). Results were corrected for body temperature, ambient pressure, water vapour saturation and expressed as per cent of predicted based on local formulae derived using linear regression techniques. The reference sample was taken from within the subject group of the survey and from a concurrent study investigating the pulmonary effects of marijuana smoking. This represented a convenience sample of adults aged 18–70 yrs recruited through newspaper and radio advertisements and informal contacts. Normal subjects from both studies were defined using ATS guidelines and were required to self-identify as “New Zealand European” and be never-smokers with no diagnosis of respiratory disease, no recent respiratory symptoms and no use of inhaled medication 12.
Skin-prick testing
All subjects received testing to the following nine locally relevant allergens: house dust mite (Dermatophagoides pteronyssinus 30,000 allergy units (AU)·mL−1); pine (lodge pole and Western yellow pine 1:20); birch (1:20); grass mix (10,000 bioequivalent allergy units (BAU)·mL−1); Aspergillus fumigatus (1:10); dog hair (1:10); feather mix (chicken, duck, goose 1:10); cat pelt (10,000 BAU·mL−1); and cockroach mix, plus a positive (histamine dihydrochoride) and a negative control (saline). The subject's arm was cleaned with soap and water. Following this, 10 numbered points were marked at 2-cm intervals on the anterior aspect of the forearm with a pen. A drop of each allergen extract was placed alongside the point and a sterile lancet was used to make a prick through the centre of the drop. A new lancet was used for each allergen. The forearm was blotted with tissue paper and the tests were read 15 min later. Reactions were assessed by the degree of erythema and the size of the weal produced. A positive result was defined as a weal ≥2 mm than that of the negative control.
Diagnostic criteria for COPD
In the present analyses, the definition of COPD proposed by GOLD (a post-bronchodilator ratio of FEV1/FVC <0.7) was used for primary outcome. Severity of disease was also defined according to the GOLD guidelines 3.
In the LLN definition, the cut-off value of the post-bronchodilator ratio was set at the fifth percentile of the normal distribution 5. The reference equation for the LLN defined by the FEV1/SVC ratio was:
(FEV1/SVC predicted)–(1.65×6.48) (1)
where FEV1/SVC predicted = 90.16–(0.271×age) for males and FEV1/SVC predicted = 92.55–(0.271×age) for females, with age in years at time of PFTs 12. The reference equation for LLN defined by the FEV1/FVC ratio was:
(FEV1/FVC predicted)–(1.65×5.94) (2)
where FEV1/FVC predicted = 108.1–(0.24×age)–(10.6×height), with age in years at time of PFTs and height in metres 12. Post-bronchodilator values for SVC were used in the LLN equations.
A doctor's diagnosis of COPD was based on positive answers to the questions “Did your doctor ever tell you that you had chronic bronchitis?”, “Did a doctor ever tell you that you had emphysema?” and “Have you ever been told by a doctor that you had chronic obstructive respiratory disease?” Individuals with bronchiectasis or sarcoidosis and airflow obstruction were not counted as having COPD.
Statistical analysis
Confidence limits for proportions were calculated by an exact method. The kappa coefficient was used to describe agreement between different methods to define COPD. The prevalence of COPD was adjusted to the age distribution of the Wellington population using the method cited in 16. Where appropriate, unpaired t-tests were used to compare continuous variables between groups. Differences between post- and pre-bronchodilator FEV1 values are expressed as the per cent change from pre-bronchodilator FEV1. The FEV1/FVC ratio is expressed as a percentage. Odds ratios (OR) in the univariate and multivariate analysis were calculated by logistic regression.
RESULTS
A total of 3,500 individuals were invited to complete an SQ between April 14, 2003 and June 3, 2004. A total of 2,319 out of 2,978 individuals with valid contact details returned the SQ, giving a response rate of 77.9%.
A total of 1,017 individuals of the group who completed the SQ (43.9% of the 2,319 subjects returning the SQ; 34.2% of the original 2,978 subjects with valid contact details) went on to complete the MQ. All 1,017 subjects were invited to undergo PFT, of whom 795 attended. A full set of completed pre- and post-bronchodilator flow–volume loops were obtained for the 749 individuals whose results are analysed in the present paper (fig. 1⇓).
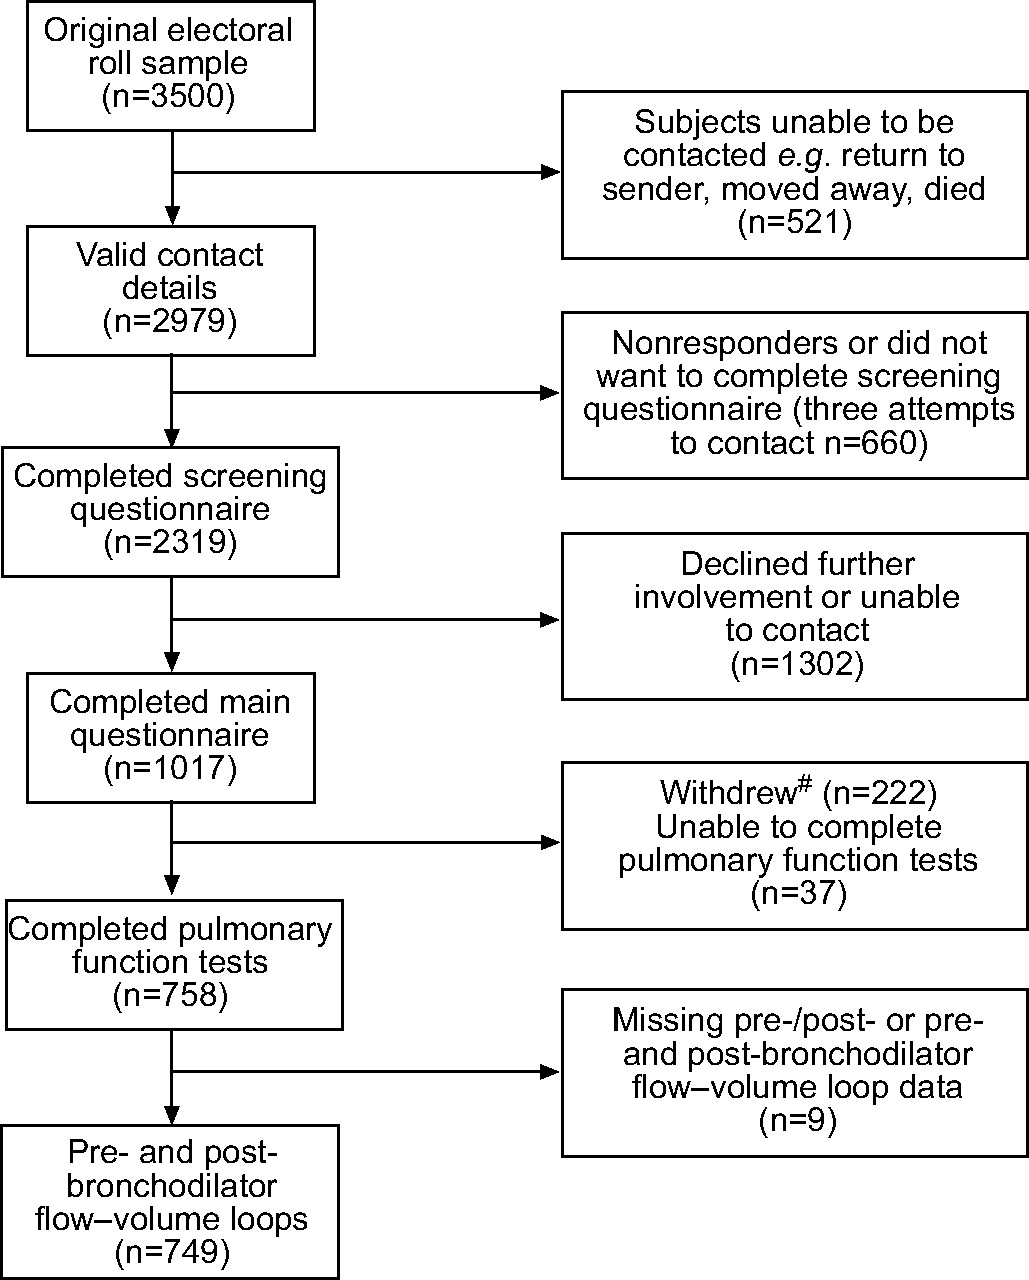
Flow-chart of participating subjects. #: due to a change of mind (n = 130), moving away (n = 51), being pregnant or presenting other medical conditions (n = 29), being deceased (n = 5), being obese (n = 4; individuals of >125 kg were excluded due to scanner weight limit) or needing an interpreter (n = 3).
Table 1⇓ compares respiratory symptoms and selected risk factors for individuals completing the SQ, the MQ and for those who underwent PFT. Generally, differences were small, but responders to the MQ were more likely to complain of ever having breathing trouble (35 versus 25.3%), were more likely to be ex-smokers (42 versus 36.1%), had a higher prevalence of doctor-diagnosed asthma (23.9 versus 19.1%) and had less wheeze in the previous 12 months (22.3 versus 26.0%) than those subjects in the SQ group. There were only small differences between the MQ group and those individuals with full PFTs.
Baseline characteristics of subjects completing the screening questionnaire(SQ), the main questionnaire (MQ) and pulmonary function tests (PFTs) to illustrate possible differences in subject characteristics by various phases of the study programme
Characteristics of the study population by age, sex, ethnicity, smoking status and pack-yrs are detailed in table 2⇓. More males than females participated in the study (54.2 versus 45.8%). The mean±sd age of the study population was 54.9±12.8 yrs. Less than half of the participants (46.2%) had never smoked tobacco cigarettes. Of the current or ex-smokers, 28.4% had a pack-yr history for tobacco cigarette smoking of ≥20 yrs. A total of 47.1% of the participants were atopic based on a positive result to one of nine locally relevant allergens and 9.2% had a diagnosis of childhood asthma.
Characteristics of the study population by age, sex, ethnicity, smoking status and pack-yrs
The overall raw and age-adjusted prevalence rates of COPD are presented in table 3⇓ and figure 2⇓. The GOLD-defined age-adjusted (to the age distribution of the Wellington population) prevalence (95% confidence interval (CI)) for adults aged ≥40 yrs was 14.2 (11.0–17.0)%. The LLN-defined age-adjusted prevalence for adults aged ≥40 yrs using SVC and FVC was 9.0 (6.7–11.3)% and 9.5 (7.1–11.8)%, respectively. An LLN definition using pre-bronchodilator values of FVC gave a prevalence of 15.2 (12.0–18.5)%. The estimate for COPD prevalence based on a doctor diagnosis in the same ≥40 yrs age group was 10.5 (7.8–13.2)%.

Prevalence of chronic obstructive pulmonary disease (COPD) by diagnostic definition and age group. ▪: Global Initiative for Chronic Obstructive Lung Disease; □: lower limit of normal (LLN) post-bronchodilator; ○: LLN pre-bronchodilator; •: doctor's diagnosis. Age group 25–29 yrs excluded due to small numbers (n = 15).
Overall raw and age-adjusted prevalence of chronic obstructive respiratory disease (COPD) by different criteria
Table 4⇓ shows the moderate degree of agreement between GOLD and the other definitions except for doctor diagnosis. The GOLD criteria classified more subjects as having COPD than the post-bronchodilator LLN for either FEV1/FVC or FEV1/SVC. The OR (95% CI) per decade older for a diagnosis of COPD by GOLD compared with the LLN (defined by post-bronchodilator FEV1/SVC) was 2.5 (1.8–3.6; p<0.0001). For the pre-bronchodilator LLN for FEV1/FVC there was a substantial proportion of subjects misclassified in both directions. For the post-bronchodilator LLN for FEV1/FVC, fewer subjects were classified as having COPD than by the pre-bronchodilator LLN for FEV1/FVC. With regards to doctor's diagnosis, only 17 (15%) out of 116 of those individuals who met the GOLD criteria had a doctor's diagnosis of COPD. In total, 99 (85%) out of 116 subjects met the GOLD criteria but did not report a doctor’s diagnosis of COPD. Of those subjects with GOLD-defined COPD and who were in the severe categories (n = 11), four (36%) had a doctor's diagnosis of COPD.
Agreement between various definitions of chronic obstructive pulmonary disease(COPD)
The prevalence of GOLD-defined COPD is presented by age, sex, ethnicity, smoking status and pack-yrs in table 5⇓. The prevalence was higher in males than in females and increased with increasing age. COPD was more frequent in current and ex-smokers and increased with increasing pack-yrs.
Prevalence of chronic obstructive pulmonary disease(COPD)# by age, sex, ethnicity, smoking status and pack-yrs
In the group of 749 individuals, the prevalence of COPD according to GOLD severity stages was as follows: 1) mild (FEV1 ≥80% pred), 53 (7.1%); 2) moderate (50%≤FEV1<80% pred), 52 (6.9%); 3) severe (30%≤FEV1<50% pred), 8 (1.1%); 4) very severe (FEV1 <30% pred), 3 (0.4%). Thus, 105 (14.0%) out of 749 subjects had GOLD-defined COPD in the mild or moderate categories.
Amongst the subjects with GOLD-defined COPD, the mean±sd percentage change in FEV1 from baseline after bronchodilator was 10.9±11.3%. There were 35 (30.2%) out of 116 COPD subjects who met the criteria for a positive bronchodilator response 6. This compares to a mean±sd change of 3.9±4.4% in the group without COPD, of whom only 23 (3.6%) out of 633 met the criteria for a positive bronchodilator response.
DISCUSSION
The present study found that the prevalence of GOLD-defined COPD in adults aged ≥40 yrs was 14.2%. To date, there is no reliable data for COPD from New Zealand population surveys based on either pre- or post-bronchodilator lung function criteria with which to compare this figure 17.
Previous prevalence studies in other countries have been summarised in two recent reviews of the literature 18, 19. In the first review 18, 32 studies were identified in the period 1962–2001, only 11 of which were based on spirometry, with just three clearly stating that post-bronchodilator values were measured. In the most recent review and meta-analysis of 37 prevalence studies in the period 1990–2004, a pooled prevalence estimate in adults aged ≥40 yrs was 9.0% 19. Only nine studies included post-bronchodilator lung function and only six were from the Western Pacific region 19. Since 2004, there have been two general population-based studies worldwide that have applied post-bronchodilator values. The Proyecto Latinoamericano de Investigación en Obstrucción Pulmonar (PLATINO) study 20 identified crude rates in adults aged ≥40 yrs of 7.8 and 19.7% in Mexico City (Mexico) and Montevideo (Uruguay), respectively, and a Scandinavian study reported a prevalence of 7% in individuals aged 26–82 yrs 21. The ongoing Burden of Lung Disease (BOLD) initiative is designed primarily as a COPD prevalence survey among noninstitutionalised adults aged ≥40 yrs, and should facilitate direct comparison of GOLD-defined COPD prevalence rates between countries 22.
The prevalence of COPD was also estimated by reference to the LLN for the FEV1/VC ratio as proposed by the ATS/ERS Task Force to reduce the number of false positive diagnoses that occurs as FEV1/FVC ratios decrease with age. In the same group of adults aged ≥40 yrs (using post-bronchodilator values), the estimate was only 9.0%, giving a discordant rate of 5.2%. Allocation by GOLD to COPD was more likely for males and older adults than by the LLN definition. Looking at this another way, the LLN for the FEV1/FVC in the present study was 0.65 and 0.63 for a 70 and a 75 yr-old, respectively.
The present authors are not aware of any studies which specifically consider the difference between a fixed ratio of 0.7 and the LLN using post-bronchodilator values. Margolis et al. 23 performed a retrospective review of PFTs (no post-bronchodilator values) at a Veteran's Administration hospital comparing a fixed ratio of 0.7 with 95th percentile-based numeric criteria and found discordant readings in 7.2% of the 664 individual tests. Roberts et al. 24 found similar discordant rates of 6.9–7.5% depending on the reference range used, but again did not include post-bronchodilator values.
In contrast to the present findings, a study developing reference ranges for post-bronchodilator lung function by Johannessen et al. 25 found that the LLN FEV1/FVC for both males and females after reversibility testing exceeded 0.7 across all ages. This might suggest that the LLN would diagnose more people with COPD, but this finding is more likely to be a consequence of the small number of observations in elderly males. The findings could also suggest that the GOLD cut-off point is useful as long as post-bronchodilator values are used. In terms of the clinical impact of the difference between the two definitions, Mannino et al. 26 noted that elderly subjects classified as normal using the LLN but abnormal using the fixed ratio, died at a similar rate to the cohort classified as abnormal using the LLN criteria. It was concluded that the fixed ratio may identify at-risk patients. This analysis was, however, limited by the unavailability of post-bronchodilator values.
It is not surprising that the use of pre-bronchodilator values for the LLN definition gave a higher COPD prevalence of 15.2%. The present 31% reduction in the prevalence estimate using post-bronchodilator values is similar to the 27% difference noted by Johannessen et al. 21. The issue of whether FVC or SVC is used appears to make little difference, as the values for these variables were very similar for most subjects, although this difference may be greater in a population group with a higher proportion of subjects with more severe COPD.
The range of prevalence estimates depending on definition has been considered by other groups. All reported a wide range depending on definition, but none of these included post-bronchodilator testing 27–29. The importance of using post-bronchodilator lung function is debated and comes down to an attempt to distinguish between asthma and COPD. Both disease complexes share similar symptoms and demonstrate airflow obstruction. However, the variability of symptoms and changes in airflow limitation that occur spontaneously or in response to treatment has traditionally been ascribed to asthma. The degree of reversibility in FEV1 that indicates a diagnosis of asthma is generally accepted as ≥12% (or ≥200 mL) from the pre-bronchodilator value 30. However, the 1995 ATS official statement on COPD mentions that a significant increase in FEV1 after an inhaled β-adrenergic agonist has been observed in up to one third of COPD patients during single-testing sessions 31. The recent ERS/ATS Task Force did not achieve a consensus on the interpretation of bronchodilator responsiveness in subjects with airflow obstruction, although it was commented that values ≥12% and 200 mL are significant. It also states that even though asthmatics tend to show larger responses to bronchodilators, this response has never been shown to be capable of clearly separating the two classes of patients 6.
The prevalence estimates in the present study were based only on the results of spirometry. It is acknowledged that a clinical diagnosis of COPD requires a history of chronic progressive symptoms, possible abnormalities on physical examination and a consideration of risk factors; however, objective evidence of airflow obstruction determined by forced expiratory spirometry is the standard for demonstrating and quantifying airflow obstruction 3, 26, 32. It is well recognised that COPD is under-diagnosed in the community, at least in part because it is clinically silent until the disease process is well advanced. In the third National Health and Nutrition Examination Survey, 44% of individuals with an FEV1 <50% pred did not have a current diagnosis of COPD 33.
The main strength of the present study was the wide range of objective measures performed in individuals from a random population survey. The major problem with the present study was the large drop-out between those individuals selected from the electoral roll to those with full completion of tests. However, subjects completing the investigative modules were broadly similar to those completing the SQ. More detailed analysis by age band (results not shown) indicated a difference between the electoral roll sampling frame and the SQ, where response rate increased by age and this was accounted for by adjusting the prevalence rates to the age distribution of the Wellington population. However, there was little difference by age band in the proportions participating in the SQ versus MQ versus individuals completing PFT. The relatively small sample size and small number of subjects with COPD by any definition led to the wide CI for prevalence as illustrated in table 5⇑. It is acknowledged that the ongoing discussion around the topic of a fixed ratio versus a LLN definition is focused on the elderly patient with mild disease. The present sample has few individuals in this group. A limitation of performing such a study in New Zealand is that it is a country with a relatively young population, limiting the number of older adults accessible through the electoral roll.
In conclusion, the present study has provided a first estimate of the Global Initiative for Obstructive Lung Disease-defined prevalence of chronic obstructive pulmonary disease in an urban New Zealand population. This prevalence is broadly comparable with the few other studies worldwide that similarly report post-bronchodilator values. A range of prevalence rates from 9.0–15.2% for the same population group depending on definition has been shown. Longitudinal studies using post-bronchodilator spirometry are required to determine whether a lower-limit-of-normal approach would better estimate the true chronic obstructive pulmonary disease prevalence, albeit at the cost of simplicity.
Acknowledgments
The present authors would like to thank J. Soriano (Fundació Caubet-CIMERA Illes Balears, Bunyola, Spain) and H. Coxson (University of British Columbia, Vancouver, Canada) for their helpful comments in the design of the Wellington Respiratory Health Survey (WRHS) and interpretation of the results; D. Fabian and A. Pritchard for their help with the WRHS and in producing the manuscript; A. Holt, P. Heuser and E. Chambers for their help in conducting the questionnaires; M. Williams for his help in conducting the pulmonary function tests (all from Medical Research Institute of New Zealand, Wellington, Australia); and M. Nowitz, A. Kigzett-Taylor and the radiography and administrative staff of Pacific Radiology (Wellington, New Zealand).
Footnotes
-
For editorial comments see page 189.
- Received December 4, 2006.
- Accepted March 6, 2007.
- © ERS Journals Ltd
References


