


Abstract
Exhaled breath condensate (EBC) pH is considered to reflect the acid-base balance of the airways. Current pH measurements do not take into account the effect of CO2. The aim of the present study was to determine the effect of condensate CO2 partial pressure on pH and to provide a more precise mode of EBC pH determination.
Condensate pH and CO2 partial pressure were measured in parallel from 12 healthy volunteers and 12 asthmatics using a blood gas analyser in neat, argon de-aerated and CO2-loaded samples. The regression analysis was used to test the relationship between pH and CO2, and to calculate the pH at a CO2 level of 5.33 kPa (physiological alveolar CO2 partial pressure). Reproducibility of different pH readings was compared using the Bland–Altman test.
Condensate CO2 concentration was variable both in neat and argon de-aerated samples. There was a close negative logarithmic relationship between CO2 and pH. Calculation of pH at a CO2 level of 5.33 kPa provided reproducibility approximately six times as good as that of the currently used measurements.
Condensate CO2 partial pressure influences pH measurements. Determination of pH at a standard CO2 level provides the most reproducible condensate pH values to date.
Exhaled breath condensate (EBC) analysis is a promising method for the investigation of airway pathology 1. Ease of repeatability and its noninvasive nature make EBC collection attractive to clinicians. However, the measurement of different exhaled biomarkers, such as hydrogen peroxide, nitrogen oxides, cytokines and leukotrienes, yields greatly variable results. The pH is currently considered to be the most robust variable of EBC 2, 3. Measurement of EBC pH has already proven valuable in determining the degree of acidification of EBC in patients with various inflammatory lung diseases 4–7, individuals exposed to hypertonic saline solution inhalation 8 or acute lung injury 9.
It has been acknowledged by the American Thoracic Society (ATS)/European Respiratory Society (ERS) Task Force that the pH of neat EBC samples is unstable 1. Argon de-aeration was suggested as a method of improving the reproducibility of pH readings 1, 2 as, in theory, inert gas removes all volatile components of EBC allowing the measurement of nonvolatile acidity. When assayed continuously by a glass microelectrode, it has been observed that the pH of EBC stabilises after 8–10 min of bubbling with argon 2. It is generally assumed that a stable pH marks the complete removal of CO2 and other volatile components.
CO2 is the major volatile component of EBC. In an aqueous environment CO2 forms H+ and HCO3- and profoundly affects the pH of dilute solutions, such as EBC. Levels of CO2 have not yet been systematically tested in EBC. Although argon de-aeration causes a significant decrease in the CO2 partial pressure of the exhaled breath condensate (PEBC,CO2), the remaining CO2 could influence pH results 10. Furthermore, it is not clear whether NH3, another volatile component of EBC, is important in de-aeration-induced changes in EBC pH 11, 12.
The aim of the present study was to determine the effect of CO2 on breath condensate pH and to achieve better reproducibility of pH readings by considering PEBC,CO2 in both healthy subjects and asthmatic patients.
METHODS
Subjects
A total of 12 healthy nonsmokers without any disease in their medical history (eight females, four males, mean (range) age 41 (21–61) yrs, forced vital capacity (FVC) >90% predicted, forced expiratory volume in one second (FEV1)>80% pred, FEV1/FVC >70%) and 12 atopic asthmatic subjects without upper airway diseases in a clinically stable condition (seven females, five males, aged 43 (25–64) yrs, FVC >90% pred, FEV1 >80% pred, FEV1/FVC >70%, exhaled nitric oxide fraction <20 ppb), treated with short-acting β2-agonists and inhaled corticosteroids (400 μg·day−1 budesonide), were enrolled in the study. The study was approved by the local ethics committee and participants gave their written informed consent.
EBC collection
EBC was collected for 10 min with a commercially available condenser (EcoScreen; Jaeger, Würzburg, Germany). Nose-clips were not worn. Subjects were asked to inhale through the nose and exhale through the mouth in their normal rhythm of breathing. This sampling method provides a larger sample volume than that using a nose-clip 13. Furthermore, there is no difference in exhaled biomarker concentration between the two types of sampling in subjects without upper airways disease 13, 14.
From healthy subjects, two EBC samples were collected on two consecutive days between 07:00 and 08:00 h. pH and CO2 from both samples were determined in duplicate as follows: 1) from neat samples within 10 min after sampling; 2) after argon de-aeration for 2.5, 5, 7.5 and 10 min; and 3) after CO2 loading for 1, 2, 3 and 4 s.
Handling of EBC samples
Neat EBC samples
Neat EBC samples were used for measurement immediately after sampling (all measurements were made within 10 min after sampling).
De-aerated EBC samples
The generally used argon de-aeration method was chosen to obtain data comparable with published results.
Each EBC sample was divided into 250-μL aliquots in eight plastic tubes. Aliquots were simultaneously bubbled with argon (Argon 4.6; Messer Hungarogáz Kft, Budapest, Hungary) using a purpose-made bubbling device with eight arms. The device assured the same argon flow (300 mL·min−1) in each tube. Samples were de-aerated in duplicate for 2.5, 5, 7.5 and 10 min and aliquots were taken for pH and CO2 determination after each de-aeration period.
CO2-loaded EBC samples
CO2 loading was achieved by bubbling CO2 gas through the samples (CO2 4.5; Messer Hungarogáz Kft, Budapest, Hungary). Since this manoeuvre caused a rapid increase in PEBC,CO2, very short intervals of bubbling (1 s) were chosen to obtain a stepwise increase in PEBC,CO2. CO2 gas was bubbled through the EBC samples four times with a 1-s duration. After each 1-s bubbling period aliquots were taken for pH and CO2 measurements (i.e. each 1 s CO2 bubbling was followed by ∼10–15 s, as samples were taken, when no gas was bubbled through the sample).
pH and CO2 measurement
EBC samples were immediately transferred into glass capillaries. The closed capillaries were stored for no longer than 1 h at room temperature before measurements. pH and PEBC,CO2 measurements were performed by means of a blood gas analyser (ABL 520; Radiometer, Copenhagen, Denmark). The reliability of the blood gas analyser in determining EBC pH was tested before the study by comparing it with a glass microelectrode (Radelkis, Budapest, Hungary) and by 10 repeated measurements of a de-aerated EBC sample.
Calculation of EBC pH at predetermined PEBC,CO2
The pH value at 5.33 kPa PEBC,CO2 was calculated using data obtained from neat and CO2-loaded samples by regression analysis.
Comparison of CO2-normalised EBC pH with other pH readings
The repeatability of the three different types of EBC pH determination (in neat samples, in argon de-aerated samples and the CO2-normalised EBC pH) and the day-to-day variability of EBC pH in healthy individuals was tested. Furthermore, the EBC pH of healthy subjects was compared with that of stable asthmatic patients by using all three types of EBC pH determination.
The repeatability of EBC pH readings was tested in duplicate EBC samples from healthy participants. From both parts of given EBC samples the following six pH and CO2 measurements were taken: one from the neat sample; one after 10 min argon de-aeration and four from CO2-loaded samples following the four 1-s loading periods.
Day-to-day variability of EBC pH was tested for the three pH reading methods in healthy participants.
Comparison of EBC pH of healthy and asthmatic subjects was also performed with all three different pH reading methods.
Ammonia measurement
Ammonia was measured spectrophotometrically in neat EBC samples and after argon de-aeration for 10 min (Diagnostic ammonia assay kit; Randox®, Ardmore, UK) in the same healthy participants.
Statistical analysis
A pH–PEBC,CO2 plot was created for each sample using the data collected by the blood gas analyser. Logarithmic regression and coefficient of determination (r2) were calculated. The pH and CO2 values obtained in the neat sample and after CO2-loading periods were used to calculate pH at a standardised CO2 level (PEBC,CO2 of 5.33 kPa).
A Bland–Altman test was performed to compare the repeatability of pH assessment of neat and argon de-aerated samples with CO2-normalised pH values. Paired t-tests were applied for comparison of ammonia concentrations before and after de-aeration and also for comparison of mean of differences.
RESULTS
CO2 removal (argon de-aeration)
A broad range of CO2 level variation was seen in neat EBC samples: 4.31–0.67 kPa (mean±sd 2.20±0.65). The corresponding pH values in neat EBC samples were in the range 6.17–7.19 (6.89±0.31).
The time course of CO2 removal was not predictable. The PEBC,CO2 could not be reduced to a standard level at a given time point and the reduction of PEBC,CO2 was not proportional to time. Representative curves of the PEBC,CO2 reduction time course (fig. 1a⇓) with the corresponding pH increase (fig. 1b⇓) obtained from two parallel aliquots of the same EBC sample are shown in figure 1⇓.

Representative time course of a) CO2 partial pressure of the exhaled breath condensate (PEBC,CO2) and b) pH during parallel argon de-aeration in duplicates of the same exhaled breath condensate (EBC) sample.
In EBC samples de-aerated for 10 min PEBC,CO2 was variable between samples in the range 0.44–0.09 kPa (0.22±0.1) with corresponding pH of 7.39–8.36 (7.91±0.31).
CO2 loading
CO2 bubbling raised the PEBC,CO2 very quickly. Each 1-s CO2 bubbling period caused a ∼5–10 kPa increase in PEBC,CO2 and within 10 s, PEBC,CO2 reached 80–100 kPa and could not be further increased.
pH measurement and calculation
The blood gas analyser provided the same pH values as the glass microelectrode. The mean pH of argon de-aerated EBC samples after 10-min de-aeration was 8.04 (7.91–8.11).
Loading samples with CO2 revealed a close negative logarithmic correlation between pH and PEBC,CO2 (r2>0.99, p<0.01; fig. 2⇓). This correlation allows the calculation of EBC pH at any standardised PEBC,CO2. A value of 5.33 kPa was chosen as it is thought to be identical to the physiological CO2 level of the alveolar surface lining (ASL) fluid in healthy individuals. The mean EBC pH standardised to 5.33 kPa CO2 partial pressure was 6.54 (6.06–6.96).

Close negative logarithmic correlation between pH and partial pressure of carbon dioxide in the exhaled breath condensate (PEBC,CO2) upon CO2 load in a) healthy and b) asthmatic subjects. Samples were run in duplicate as indicated by red and blue symbols. Only one regression line is displayed per sample, as the regression lines of the duplicates run almost in parallel. ·····: 5.33 kPa PEBC,CO2. Coefficients of determination were as follows: ▪ blue: 0.9982; ▪ red: 0.9921; ▴ blue: 0.9965; ▴ red: 0.9970; ▾ blue: 0.9857; ▾ red: 0.9926; ♦ blue: 0.9993; ♦ red: 0.9970; • blue: 0.9958; • red: 0.9995; □ blue: 0.9991; □ red: 0.9967; ▵ blue: 0.9993; ▵ red: 0.9962; ▿ blue: 0.9969; ▿ red: 0.9955; ⋄ blue: 0.9956; ⋄ red: 0.9910; ○ blue: 0.9963; ○ red: 0.9981; × blue: 0.9986; × red: 0.9913; + blue: 0.9999; + red: 0.9996. EBC: exhaled breath condensate.
For de-aerated samples the correlation between pH and PEBC,CO2 was slightly lower (r2>0.98, p<0.01). As 5.33 kPa is outside of the measured interval in this setting, the de-aeration protocol is not appropriate for the estimation of EBC pH at 5.33 kPa PEBC,CO2.
Repeatability of pH readings
The limits of agreement for parallel samples determined by the Bland–Altman test were 0.27, 0.25 and 0.04 for the argon de-aerated, the neat samples and the CO2 standardisation, respectively (fig. 3⇓). These results demonstrate that EBC pH standardised to PEBC,CO2 is approximately six times as precise as pH measurement of either neat or de-aerated samples.
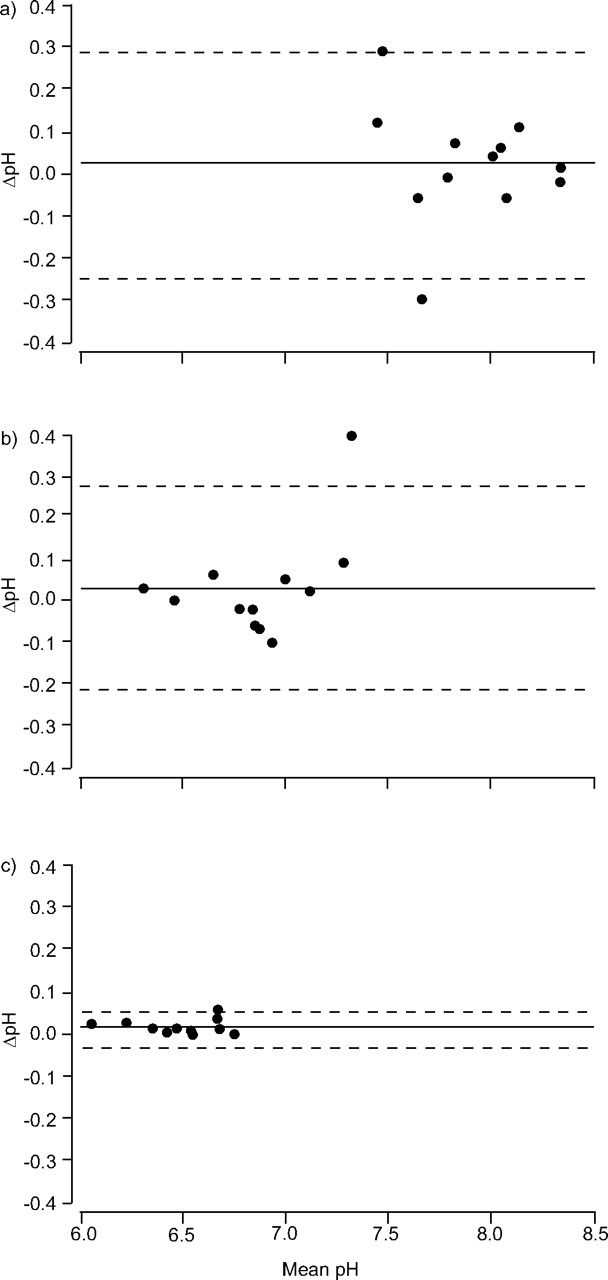
Repeatability of pH measurement. Comparison of two values obtained from the same sample by a) de-aeration, b) neat measurement and c) calculation according to the CO2 loading protocol by the Bland–Altman test. ——: mean; ––––: ±2 SD.
Although the coefficient of variation (CV) is not an appropriate statistical method with which to determine the reproducibility of a method, CVs were calculated for the purpose of comparison with other studies. The CVs were 3.9, 4.5 and 3.3% for the de-aerated, neat and calculated values, respectively.
Variability of EBC pH
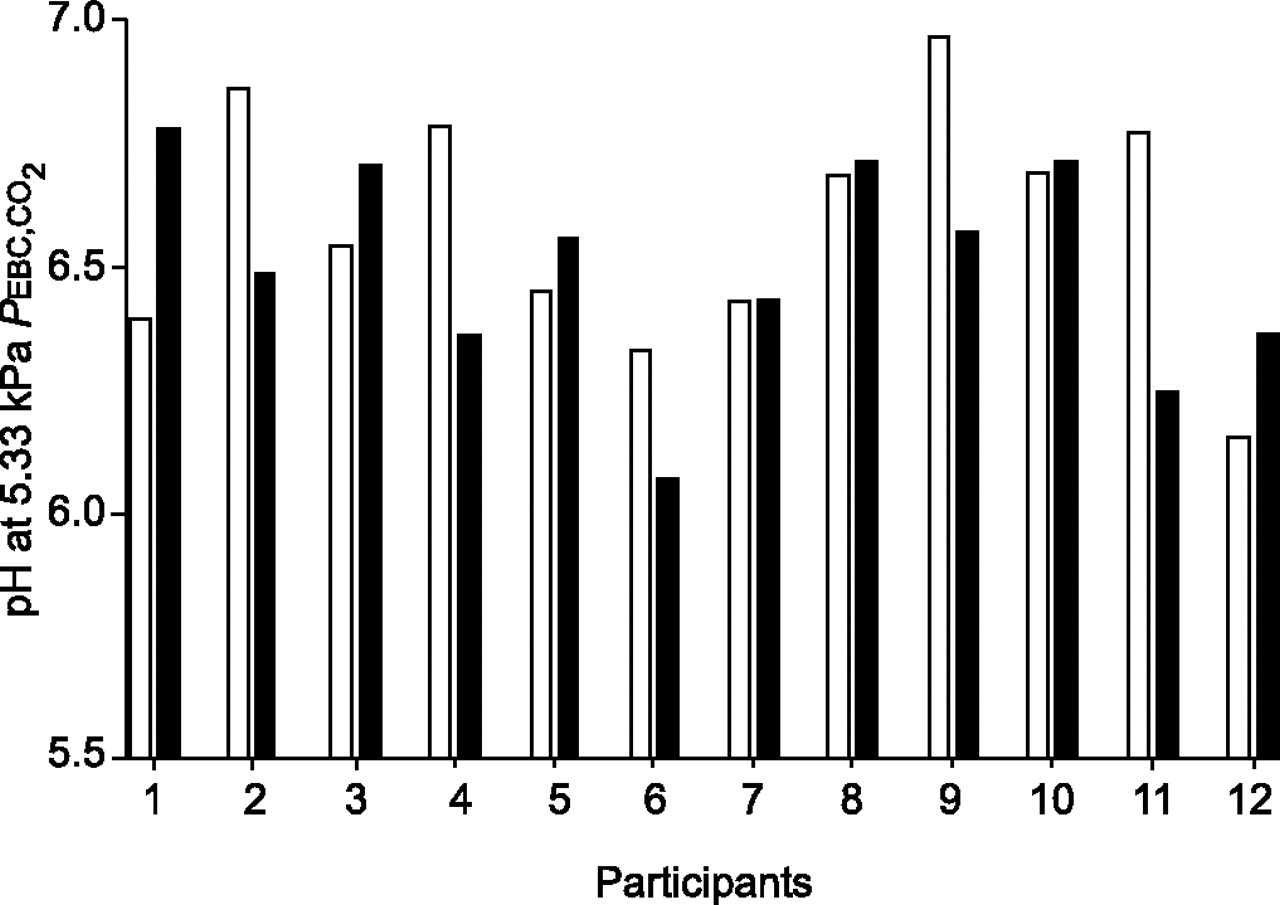
EBC pH showed daily variability when determined by either method. The mean difference of pH values between de-aerated samples was 0.359, between neat samples 0.376 and between standardised pH values 0.278. Variability of standardised values is demonstrated in figure 4⇓. Standardised pH values showed normal distribution.
Variability of exhaled breath condensate (EBC) pH. pH values standardised to 5.33 kPa partial pressure of carbon dioxide in the EBC (PEBC,CO2) of healthy participants on day 1 (□) and day 2 (▪).
EBC pH of asthmatic patients
The close negative logarithmic correlation between pH and PEBC,CO2 was also detected in asthmatic patients (fig. 2b⇑). The mean EBC pH of stable asthmatic subjects standardised to 5.33 kPa CO2 pressure was 6.41 (6.26–6.68). Calculated pH was as reproducible as that of healthy subjects and no significant difference was found between EBC pH of stable asthmatic patients and healthy participants by any of the used pH reading methods.
Ammonia measurement
There was no significant difference between ammonia concentrations before and after de-aeration by argon for 10 min (86±70 and 82±65 μM·L−1, respectively). There was no correlation between ammonia levels and pH, either before (r2 = 0.09) or after de-aeration (r2 = 0.01) or with the calculated values (r2 = 0.15).
DISCUSSION
EBC analysis is a promising topic of investigation; however, low reproducibility of measurements of different exhaled biomarkers limits its application. pH has been considered to be the most robust parameter of EBC 3. EBC pH is determined by volatile and nonvolatile components 11, 12, 15. Volatile components have been suspected of causing noise in EBC pH measurement. It was assumed that argon bubbling removes the volatile components of EBC almost completely; however, this assumption has never been tested.
Although the general suggestion of the ERS/ATS Task Force Report was to use a nose-clip for EBC sampling, it was acknowledged that samples could be collected without the use of one 1.
By measuring CO2 partial pressure in EBC the present authors found that CO2 influences EBC pH to a great extent. However, CO2 can neither be completely removed from EBC nor can it be decreased to a standard level by argon bubbling even if continued for as long as 20 min.
Quite high levels of PEBC,CO2 were achieved by repeated CO2 loading compared with CO2 within the physiological range and a substantial increase in PEBC,CO2 was caused by just 1 s of CO2 load. Lower PEBC,CO2 levels may be created if the sample is left after one episode of CO2 loading and aliquots for pH and CO2 measurements are taken every few minutes (as CO2 is diffusing out of the EBC). PEBC,CO2 curves were constructed from eight points in the range 2.5–15 kPa. The same close negative logarithmic correlation was found as in the case of higher CO2 levels. A repeated CO2-loading protocol was chosen in the present study because it was less time-consuming. A negative logarithmic correlation was found between pH and PEBC,CO2. The near-perfect logarithmic correlation between EBC pH and PEBC,CO2 found in the CO2-loading protocol is a consequence of the Henderson–Hasselbach equation. Similarly, the very strong logarithmic correlation in the de-aeration protocol means that argon bubbling mainly removes CO2 and does not influence other components of the condensate. According to the present findings, argon de-aeration does not change the ammonia concentration of EBC.
The close correlation allows the calculation of EBC pH at any standard PEBC,CO2. Standardisation to 5.33 kPa is justified as it is considered to correspond to the physiological ASL CO2 level. EBC pH calculation at 5.33 kPa PEBC,CO2 is six times as reproducible as pH measurements that do not take into account the CO2 level. The reason for the improved repeatability of the CO2 standardisation method is that in either de-aerated or neat pH measurements CO2 level may vary and thus cause a significant change in pH (visually, it means that the standardised pH is read at a fixed point of the CO2–pH regression line, while the neat and the de-aerated pH value moves along the regression line.)
Repeatability of standardised EBC pH is not increased at the expense of a loss of ability to detect differences between groups, as illustrated in figure 2⇑ where the regression lines run almost in parallel.
Although the present results allow the reliable calculation of EBC pH they do not provide information about the identity of components that determine EBC pH and this could be an area of further investigation.
The possibility that EBC is contaminated with saliva is debatable 1, 11–13. The results of salivary contamination would be that estimated EBC pH does not correspond to ASL pH. Even if this were true it would not weaken the good repeatability of the method itself. Nor does the variability of EBC pH contradict good reproducibility. In fact, reliable pH determination ensures that a change in pH corresponds to real variability instead of the uncertainty of the measurement.
The fact that the current stable asthmatic patients had an EBC pH statistically similar to that of healthy individuals does not exclude the possibility that patients in more severe state of disease or during exacerbations would have a lower EBC pH. Even though the statistical demonstration of EBC acidification in inflammatory airway diseases is interesting from a pathophysiological point of view, it only has clinical importance if a cut-off value between healthy and pathological pH values can be set.
A number of questions remain to be answered, including the reason for the variability of EBC pH and the potential of EBC pH determination in clinical routine.
In summary, by the parallel measurement of pH and CO2 partial pressure in EBC, CO2 was found to affect condensate pH to great extent and condensate CO2 level was unable to be standardised by the currently recommended de-aeration. A near-perfect negative logarithmic correlation was found between pH and CO2 partial pressure in EBC. This correlation allows the calculation of pH at CO2 partial pressure of 5.33 kPa. The calculated EBC pH of healthy adults shows variability in the interval of 6–7.
In conclusion, exhaled breath condensate CO2 partial pressure is an important confounding factor of pH measurements. Determination of exhaled breath condensate pH standardised to CO2 partial pressure of the exhaled breath condensate provides the most reproducible exhaled breath condensate pH values to date.
Acknowledgments
The authors would like to thank É. Huszár, laboratory assistants I. Kenéz and J. Csoszor, engineer V. Kuzniarsky and undergraduate students Á. Jendrék and A. Bikov for their important contribution to the study, as well as D. Byrne for English correction.
- Received June 27, 2006.
- Accepted October 23, 2006.
- © ERS Journals Ltd
References


