


Abstract
A high protein concentration in a pleural effusion makes it more likely to be a malignant than a transudative effusion. However, the variability in protein composition between these two forms of pleural effusion is not well understood.
In order to compare their protein compositions, the proteomic profiles of 14 malignant and 13 transudative pleural effusions were studied using two-dimensional gel electrophoresis. Protein spots with differential expression were identified by matrix-assisted laser desorption/ionisation quadrupole time-of-flight mass spectrometry and liquid chromatography/tandem mass spectrometry. Targeted proteins were further examined by ELISA and Western immunoassay in all samples.
Two-dimensional gel electrophoresis revealed seven spots whose expression was reduced in malignant pleural effusions. Four of the abnormal spots were identified as fibrinogen γ-chain precursor, two as fibrinogen β-chain precursor and one as pigment epithelium-derived factor. ELISA and Western immunoassay showed that pigment epithelium-derived factor levels were significantly lower in malignant than in transudative pleural effusions.
It has been demonstrated that proteomic technologies may help in the elucidation of variable expression of proteins with particular functions. By applying these technologies, the level of pigment epithelium-derived factor, a potent anti-angiogenic factor, was found to be significantly lower in malignant than in transudative pleural effusions. This finding allows for further exploration regarding how underexpression of pigment epithelium-derived factor may relate to the pathogenesis of malignant pleural effusions.
A pleural effusion is an abnormal accumulation of fluid in the pleural space resulting from the disruption of the homeostatic forces that control the flow into and out of the area 1. The clinical impact of a pleural effusion depends upon its volume and composition. Diagnostic thoracentesis is usually necessary in order to determine the cause of effusions 2. The development of malignant pleural effusions in patients with advanced neoplasms may result in serious symptoms, including cough, chest pain, shortness of breath and fatigue. Several mechanisms have been proposed for the formation of malignant pleural effusions. The spread of malignant cells to the visceral and parietal pleura may be associated with vascular invasion and lymphatic obstruction 3. This results in disruption of the normal resorptive flow of fluid from the parietal to the visceral surface. Increased capillary permeability due to the inflammatory process also contributes to the fluid accumulation.
Although the mechanisms underlying malignant pleural effusions have been investigated, little is yet known about the specific protein composition of these effusions. Information about this may help to enhance understanding of their pathogenesis, and perhaps in the development of tools for diagnosis and specific therapy. New technology is yielding a wealth of information, allowing the generation of enormous amounts of data from a single experiment. These new techniques, for instance, permit the identification of a wide range of proteins, even in a small sample. The aim of the present study was to compare the protein composition of malignant pleural effusions with that of normal pleural fluid. However, the latter is present in minute amounts, making it difficult to obtain. Transudative pleural effusions form because of increases in hydrostatic pressure or decreases in osmotic pressure across an intact pleural endothelial barrier with consequently low numbers of cells and small amounts of protein 4. For this reason, it seems likely that the protein composition of transudates approximates that of normal pleural fluid. The present study was, therefore, designed to identify major proteins differentially expressed in malignant and transudative pleural effusions, using a proteomic approach based on matrix-assisted laser desorption/ionisation quadrupole time-of-flight (MALDI-Q-TOF) mass spectrometry (MS).
MATERIAL AND METHODS
Patients
The present study was approved by the Institutional Review Board of Mackay Memorial Hospital (Taipei, Taiwan) and written informed consent was obtained from all participants. A total of 27 patients with pleural effusion were included, of whom 14 had a cytologically positive malignant pleural effusion and 13 a transudative effusion. The malignant effusions were due to lung cancer in nine patients (eight adenocarcinoma and one small cell carcinoma), metastatic tongue cancer in two, metastatic oesophageal cancer in one and metastatic breast cancer in two. The transudates were attributed to congestive heart failure in 10 patients, nephrotic syndrome in one and liver cirrhosis in two.
Pleural fluid (∼150–200 mL) was collected from each of the participants by echo-guided aspiration. The effusion was centrifuged for 10 min at 800×g at 4°C, and the supernatant stored in aliquots at -70°C until further analysis.
Protein preparation
Total protein was precipitated from each sample using a 2-D Clean-UP Kit (Amersham Biosciences, Uppsala, Sweden). Briefly, 100 μL pleural effusion was mixed with 300 μL precipitant and incubated on ice for 15 min. Then, 300 μL co-precipitant was added to the mixture, which was centrifuged for 10 min at 8,000×g. The pellet was resuspended in 500 μL co-precipitant and centrifuged for 5 min at 8,000×g. The final product was obtained from the pellet remaining after centrifugation for a further 10 min at 8,000×g.
Precipitated proteins were prepared for Sypro Ruby (Molecular Probes, Eugene, OR, USA) staining or fluorescence (CyDye; Amersham Biosciences) labelling before proceeding to two-dimensional gel electrophoresis (2-DE). For Sypro Ruby staining, 1 mg precipitated protein was resuspended in DeStreak Rehydration Solution (Amersham Biosciences) to 350 μL prior to isoelectric focusing (IEF). For CyDye labelling, precipitated proteins were resuspended in dissolving solution (4% 3-((3-cholamidopropyl)diethylammonio)-1-propane sulphonate (CHAPS), 30 mM tris(hydroxymethyl)aminomethane (Tris)–HCl (pH 8.5) and 7 M urea), and labelled with fluorescent cyanine dyes developed for fluorescence difference gel electrophoresis (Amersham Biosciences) according to the manufacturer’s protocol. Briefly, protein (50 μg) was labelled with 1 μL amine-reactive cyanine dye (400 pmol·µL-1) freshly dissolved in anhydrous dimethyl formamide. The labelling reaction was incubated in the dark for 30 min at 4°C. The reaction was terminated by addition of 10 nmol lysine. Immobiline DryStrip rehydration buffer (7 M urea, 2 M thiourea, 2 mg·mL-1 dithiothreitol and 1% pharmalytes) was added to make up the volume to 350 μL prior to IEF.
Two-dimensional gel electrophoresis
In order to identify proteins expressed differentially in malignant and transudative pleural effusions, the protein components of each sample were separated into a two-dimensional array using 2-DE. This was performed using IEF in the first direction (18-cm pH 3–10 and pH 4–7 Immobiline DryStrip (IPGphor; Amersham Biosciences)) and sodium dodecylsulphate (SDS)-polyacrylamide gel electophoresis (SDS-PAGE) in the second direction (Ettan DALTsix Large Vertical System; Amersham Biosciences). IEF was performed following a step-and-hold stepwise incremental voltage program: 30 V for 18 h, 500 V for 30 min, 1,000 V for 30 min, 1,500 V for 30 min, 2,000 V for 30 min, 3,000 V for 30 min, 6,000 V for 1 h, and 8,000 V for 10–13 h, giving a total power of 80,000 Vh. After IEF, the strips were subjected to two-step equilibration in buffers containing 6 M urea, 2% weight (w)/volume (v) SDS, 30% w/v glycerol and 50 mM Tris–HCl (pH 8.8), with 1% w/v dithiothreitol for the first step and 2.5% w/v iodoacetamide for the second step. The strips were then transferred on to SDS-PAGE gels (1.0 mm thick; 12% T, where T is the combined percentage (w/v) of acrylamide and bisacrylamide) and electrophoresed for 4 h at 17 W·gel-1 at 15°C. For samples with Sypro Ruby staining, the gel was washed in 10% methanol/7% acetic acid for ∼1 h and placed in Sypro Ruby for ≥3 h. Samples studied by difference gel electrophoresis were labelled with CyDyes before proceeding to 2-DE.
Image acquisition and analysis of two-dimensional electrophoresis gels
The pattern of protein expression in each 2-DE gel was studied using an image analyser following image acquisition by a scanner (TyphoonTM 9400 Imager; Amersham Biosciences). The density of each protein spot on the scanned image represented the level of protein expression. Quantification of spot density was performed using a specific image analyser.
For Sypro Ruby images, the gels were scanned at an excitation wavelength of 610–630 nm in order to visualise all protein spots present in the gel. Prior to analysis, images were cropped to remove areas extraneous to the gel image using ImageQuantTM V5.2 (Amersham Biosciences). The density of each differentially expressed spot was quantified by PDQuest Image Analysis software V7.0 (Bio-Rad Laboratories, Inc., Hercules, CA, USA).
For CyDye-labelled images, the Cy3 images (green fluorescence; malignant effusion) were scanned using a 532-nm laser and a 580-nm band-pass (BP) 30 emission filter, the Cy5 images (red fluorescence; transudative effusion) were scanned using a 633-nm laser and a 670-nm BP30 emission filter, and the Cy2 images (blue fluorescence; internal control) were scanned using a 488-nm laser and a 520-nm BP40 emission filter. The resolution was set to 100 μm for all gels. After acquisition, images were merged and analysed using DeCyderTM V5.0 (Amersham Biosciences) differential analysis software. In the merged image, yellow fluorescence (green plus red) indicated a protein present at similar levels in malignant and transudative effusions, light green fluorescence indicated a protein present at higher levels in malignant effusions and orange fluorescence indicated a protein present at higher levels in transudative effusions. The fluorescent intensity of each spot was digitalised and converted into a three-dimensional image, allowing both quantitative and visual comparison of different spots.
In-gel tryptic digestion
In order to identify proteins of interest, the protein spots showing differential expression were removed and digested into peptides by proteases using the following method. The protein spots on 2-DE were excised from the gel manually and cut into pieces. Each gel piece was dehydrated independently in acetonitrile for 10 min, vacuum dried, rehydrated in 55 mM dithioerythreitol in 25 mM ammonium bicarbonate (pH 8.5) for 1 h at 37°C, and then alkylated with 100 mM iodoacetamide in 25 mM ammonium bicarbonate (pH 8.5) for 1 h at room temperature. The pieces were then washed twice, for 15 min each time, in 50% acetonitrile in 25 mM ammonium bicarbonate (pH 8.5), dehydrated in acetonitrile for 5 min, dried, and rehydrated in a total of 100 ng sequencing-grade modified trypsin (Promega, Madison, WI, USA) in 25 mM ammonium bicarbonate (pH 8.5) for 16 h at 37°C. Following digestion, each sample of tryptic peptides was extracted in 50% acetonitrile containing 5% formic acid for 15 min with moderate sonication. For optimal extraction, the procedure was repeated once more, then the extracted solutions were pooled and evaporated to dryness under vacuum. For MALDI-MS analysis, dry peptide samples were redissolved in 0.1% trifluoroacetic acid and purified on a C18 Zip-Tip (Millipore, Billerica, MA, USA) according to the manufacturer’s instruction manual.
Protein mass fingerprinting analysis of protein spots and sequence database search
The final protein recognition and confirmation were performed by matching the peptides identified by MALDI-Q-TOF MS. The sequences of eluted peptides were first identified by subjecting the samples to MALDI-Q-TOF analysis 5. Briefly, tryptic peptides from 2-DE protein spots were subjected to protein mass fingerprinting using a MALDI-Q-TOF mass spectrometer (M@LDITM; Micromass, Manchester, UK) operated in positive ion reflectron mode. Samples were spotted into a 96-well MALDI target plate using a saturated matrix solution of α-cyano-4-hydroxycinnamic acid in 50% acetonitrile/1% trifluoroacetic acid. Mass spectra were acquired for the mass range 800–3,000 Da and automatically processed by the Mascot search engine for protein mass fingerprinting against the Swiss-Prot database. The ion masses were submitted to the NCBInr database using the Mascot ions search for mass matching and verification of protein identity. The identification of a protein based on MS/MS analysis of one peptide was considered sufficient if the Mascot score was above the significance level. Positive identification of proteins required at least five matching peptide masses with ≥50 parts per million mass accuracy.
Direct high-precision analysis for protein identification and sequence database search
If any of the proteins identified by MALDI-Q-TOF MS appeared to show potential for further study, they were subjected to reconfirmation using a higher-precision method employing nano-liquid chromatography (LC) combined with nano-electrospray ionisation tandem MS (LC-MS/MS), as adapted from a previous study 5. Briefly, LC-MS/MS analyses were performed using an integrated LC-MS/MS system (Micromass). After data acquisition, the individual MS/MS spectra acquired for each of the precursors within a single LC run were output as a single Mascot-searchable peak list (.pkl) file. The peak list files were used to query the Swiss-Prot database using the Mascot program. Only significant hits, as defined by Mascot probability analysis, were initially considered.
Western blot analysis and ELISA
The expression of any selected protein was further studied in each pleural effusion by Western blotting and ELISA. Each protein sample was mixed with an electrophoresis buffer containing 2% SDS and 5% β-mercaptoethanol and boiled for 10 min. In order to ensure equal loading of each sample, protein quantification was performed using the Bio-Rad protein assay (Bio-Rad Laboratories, Inc.). Briefly, 800 μL of each sample was added to 200 μL Bio-Rad protein assay dye reagent concentrate. All assays were performed in duplicate. After incubation for ≥5 min at room temperature, samples were quantified by measuring absorbance at 595 nm. Proteins (5 μg) were then separated on a 10% SDS-PAGE gel. The fractionated proteins were electroblotted on to a polyvinylidene difluoride membrane (Bio-Rad Laboratories, Inc.). The membranes were blocked using 5% bovine serum albumin in 0.1% Tween 20 in Tris-buffered saline (TBST) for ≥2 h and then incubated with a 1:1,000 dilution of primary antibody for 1 h. After washing in TBST, the membranes were incubated with peroxidase-conjugated secondary antibody for 1 h, and proteins were detected using an enhanced chemiluminescence detection system (PerkinElmer Life and Analytical Sciences, Boston, MA, USA). All protein bands were analysed densitometrically using Multi Gauge Ver. 2.2 software (Fujifilm, Tokyo, Japan).
Measurement of pigment epithelium-derived factor levels in pleural effusions
Pigment epithelium-derived factor (PEDF) levels were studied in all samples by Western blot analysis and ELISA. Briefly, PEDF concentrations were determined using a ChemikineTM PEDF sandwich ELISA kit (Chemicon International, Chandlers Ford, UK). In order to measure total PEDF, samples were treated with urea (8 M) and diluted 1:500 in assay diluents. PEDF levels were quantified by enzyme immunoassays according to the manufacturer’s protocol (Fuji Chemical Industries, Toyama, Japan). As there was substantial variation in protein quantities and fluid volumes among the different forms of pleural effusion, the concentration of PEDF measured by ELISA may not correctly reflect genuine loss or gain of PEDF in the effusions. Therefore, PEDF level was adjusted according to total protein in each pleural effusion.
RESULTS
Protein profiles of malignant and transudative pleural effusions
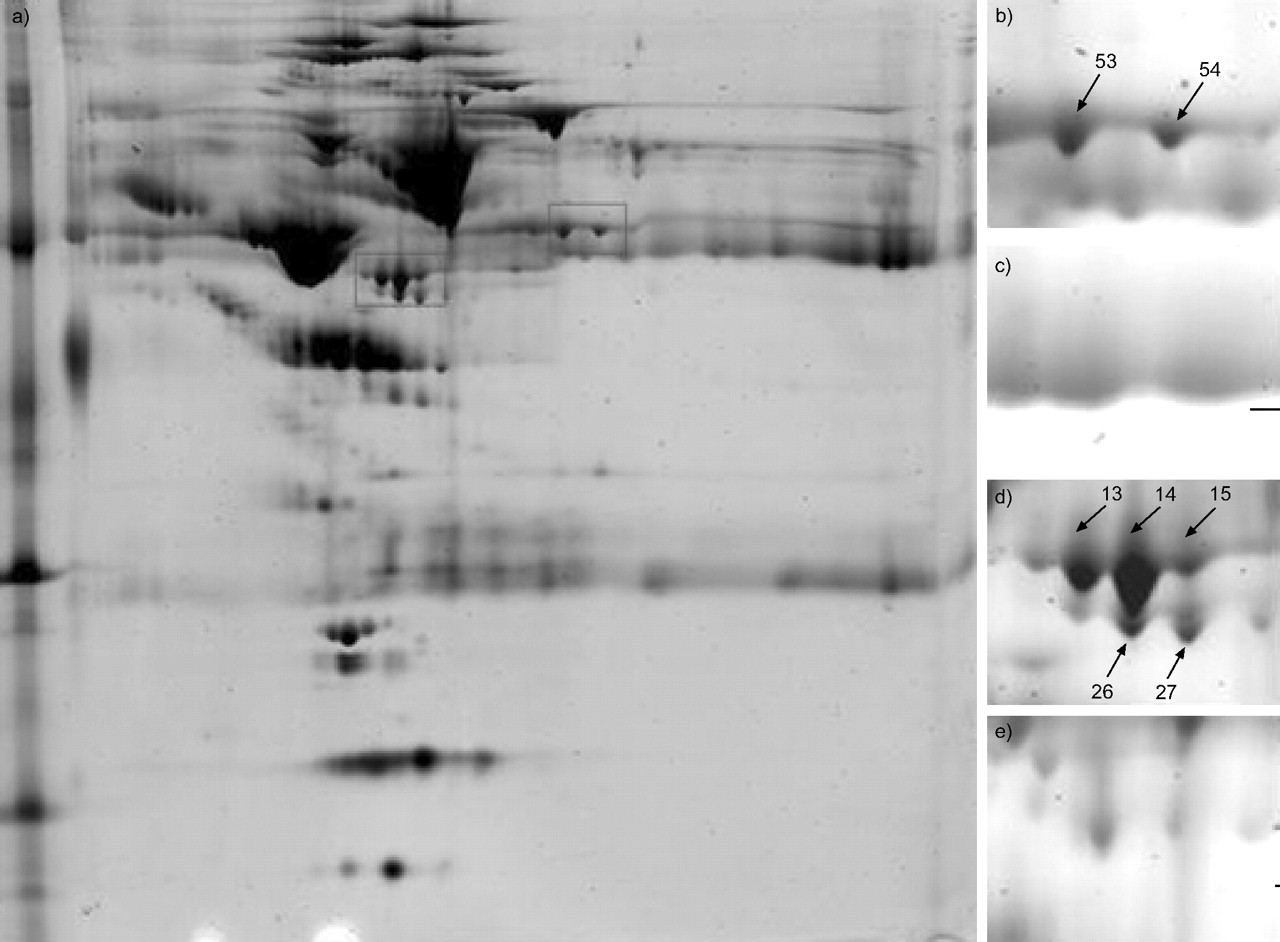
The laboratory characteristics of both types of pleural effusion are shown in table 1⇓. The protein profiles of 27 effusion samples were analysed by 2-DE with a pH range of 3–10 for greater protein separation. Figure 1a⇓ shows representative 2-DE images of proteins from one sample. In gels stained with Sypro Ruby, ∼643 spots were visualised using PDQuest image analysis software. By comparing the protein profiles of malignant and transudative effusions on 2-DE gels, seven protein spots were found showing a significant degree of differential expression (figs 1b–e⇓ and 2⇓).

a) Representative two-dimensional gel electrophoresis of transudative pleural effusion with Sypro Ruby staining; and b–e) corresponding enlarged detail in: b, d) transudative and c, e) malignant pleural effusions. Spots 13, 14, 15, 26 and 27 (lower box in a (d and e)) and 53 and 54 (upper box in a (b and c)) represent individual proteins showing differing expression between transudative and malignant pleural effusions. Each of the protein spots are identified in table 2⇓.

CyDye-stained two-dimensional electrophoresis (2-DE) gels showing selected proteins from a, d) transudative b, e) malignant effusions and c, f) merged images. The images were cropped from a representative 2-DE gel. g–l) Three-dimensional views of spots: g, h) 27; i, j) 15; and k, l) 54, from: g, i, k) transudative; and h, j, l) malignant effusions. The orange fluorescence in c) indicates greater expression of spots 13, 14, 15, 26 and 27 in the transudative effusion (Cy5). f). Similar results are seen for: spots 13, 14, 15 and 26, which correspond to fibrinogen γ-chain precursor; spots 53 and 54, which correspond to fibrinogen β-chain precursor; and spot 27, which corresponds to pigment epithelium-derived factor.
Laboratory characteristics of malignant and transudative pleural effusions
Identification of differentially expressed protein spots in malignant and transudative pleural effusions
The seven protein spots were excised and digested in gel with trypsin; this was followed by MALDI-Q-TOF analysis. The sequence coverage of the identified proteins, by peptide mass fingerprinting, ranged 3–15%, depending on the size of the proteins and the amount present. These spots were identified as fibrinogen β- and γ-chain precursors and PEDF (table 2⇓). The locations of these seven differentially expressed protein spots were marked with numbers in one representative gel, shown in figure 1⇑.
Selected electrophoretic spots identified by tandem mass spectrometry and SwissProt database searching
Pigment epithelium-derived factor levels in pleural effusions
The identification of spot 27 as PEDF was further confirmed by nanoflow LC-MS/MS. Since PEDF is the most potent natural anti-angiogenic factor, a decrease in PEDF concentration suggests that its low expression may play an essential role in mediating malignant effusion. In order to further evaluate the potential clinical significance of PEDF expression in pleural effusions, levels of PEDF were studied in all samples by Western blot analysis and ELISA. PEDF expression, as determined by Western blot analysis, was significantly lower in all malignant pleural effusions, irrespective of cancer type, than in transudative effusions (fig. 3⇓). The normalised concentration of PEDF was also significantly lower in malignant effusions (1.76±0.26 ng·mg protein -1; n = 14; p<0.0001) than in transudative effusions (4.33±0.52 ng·mg protein -1; n = 13) (fig. 4⇓).

Western blot analysis revealing higher level of expression of pigment epithelium-derived factor in transudative (a) than in malignant effusions (b). Lane numbers correspond to subject number. c) Densitometric analysis of the Western blots confirmed this result. Horizontal bars represent means. AU: arbitrary unit. #: p<0.0001.

Pigment pithelium-derived factor (PEDF) concentrations normalised to total protein were significantly higher in transudative (4.33±0.52 ng·mg protein -1; n = 13) than in malignant effusions (1.76±0.26 ng·mg protein -1; n = 14). Horizontal bars represent means. #: p<0.0001.
DISCUSSION
Although it might have been expected that global proteomic analysis would demonstrate novel proteins in malignant pleural effusions compared with transudates, the present study demonstrated decreased expression in malignant effusions of at least seven major spots, identified as PEDF and fibrinogen β- and γ-chain precursors. In a previous proteomic analysis using LC-MS, 44 proteins were identified from 242 spots in pleural effusions secondary to lung cancer 6. PEDF was not identified in that study. The present results suggest that it was not found in that study because PEDF is relatively underexpressed in malignant pleural effusions. Another study, using similar techniques, compared the proteomic profiles of exosomes isolated from different forms of malignant pleural effusions. PEDF was identified in effusions associated with breast cancer but not those associated with lung cancer or mesothelioma 7. The latter findings are compatible with the present results. Despite PEDF being found in exosomes of breast cancer-associated malignant pleural effusions, it was not determined whether the level of PEDF was increased or decreased compared to normal pleural fluid.
PEDF, cloned from a human eye complementary DNA (cDNA) library, shares sequence and structural homology with members of the serine protease inhibitor (serpin) gene family, but does not appear to inhibit any known proteases 8. The early population doubling level cDNA-1 (EPC-1) gene, widely expressed in mammalian tissues and cells, encodes PEDF 9. PEDF was initially identified as a neuronal differentiation factor produced by cultured human retinal pigment epithelial cells 10. Subsequently, it was discovered that it is, indeed, the most potent natural inhibitor of angiogenesis 11. It blocks the stimulatory activity of multiple inducers of angiogenesis 11, partly by inducing endothelial cell apoptosis 12. It is upregulated during the G0 cell cycle phase in young, but not senescent, cultured fibroblasts 13, inhibits microglial growth 14 and is neurotrophic for cerebellar granule cells 13.
A current direction in cancer research is the identification and modulation of specific events in tumorigenesis. Angiogenesis is one such event known to be fundamental to the development, growth and metastasis of cancers, and is one of the characteristics that differentiate tumour from host tissue 15, 16. Mounting evidence suggests that angiogenesis is regulated by a net balance between positive (angiogenic) and negative (angiostatic) factors produced by tumour and other cells 17–19. Tumours are capable of releasing angiogenic factors, such as vascular endothelial growth factor (VEGF) and basic fibroblast growth factor, which induce the growth of a capillary network surrounding the tumour 20. One of the mechanisms underlying the formation of pleural metastases and effusion is the induction, by angiogenic factors, of new more permeable vessels. Aside from its angiogenic function, VEGF is also a key mediator in the formation of pleural effusions by virtue of inducing vascular permeability 21. The level of VEGF in malignant pleural fluid has been shown to be significantly higher than in pleural effusions developing following coronary artery bypass grafting 22. In addition, blockage of VEGF activity has been shown to reduce the accumulation of malignant ascites and pleural effusion, indicating the important role of angiogenic factors in mediating malignant pleural effusion 23. Development of anti-angiogenic therapies is thus of great interest in research into the management of malignant pleural effusions.
By contrast, tumours also produce angiogenic inhibitors, including angiostatin, thrombospondin and endostatin 18, 24, 25. PEDF level has recently been reported to be a significant predictor of prognosis in various cancers, such as ductal pancreatic adenocarcinoma 26, hepatocellular carcinoma 27 and prostate tumours 28. However, unlike other anti-angiogenic factors whose serum and pleural levels are elevated in patients with cancer 29, 30, the level of PEDF is decreased in both pleural effusions and the blood of patients with cancer 26. This suggests that PEDF may be a possible candidate molecule in the treatment of cancer. Indeed, in vivo gene transfer of PEDF by adenovirus has been shown to inhibit tumour angiogenesis and growth in a syngeneic murine model of thoracic malignancies 31. The mechanism by which PEDF is downregulated in cancer patients remains undetermined. It can be postulated that the decrease is due to either degradation of the protein or suppression of the EPC-1 gene at the transcriptional level. PEDF was shown to be a substrate for matrix metalloproteinase types 2 and 9, both of which have been implicated in the abnormal accumulation of pleural effusions 32, 33.
It is also possible that other proteins found in effusions may be responsible for downregulation of PEDF at the transcriptional level. Two fibrinogen precursor monomers were also found to show significantly decreased expression in the present 2-DE analysis. Fibrinogen also exhibits potent anti-angiogenic activity in vitro and in vivo 34, 35. It is unclear whether there is any interaction between fibrinogen and PEDF in the course of their anti-angiogenic activity. Therefore, further studies are necessary in order to investigate the possibility of such an interaction. The present findings in this respect again demonstrate the potential of proteomic analysis for providing direction for subsequent investigations.
In conclusion, it has been demonstrated that pigment epithelium-derived factor and fibrinogen precursors are expressed at lower levels in malignant pleural effusions than in transudates. It is hoped that this finding, as well as the many others being generated by proteomic studies, will eventually lead to better diagnostic markers or therapeutic targets. However, much work remains to be done to determine which, if any, of the many substances found in this type of study will eventually prove to have clinical applicability.
Acknowledgments
Mass spectrometric analyses and bioinformatics consultation services were performed by the Core Facilities for Proteomics Research (Institute of Biological Chemistry, Academia Sinica, Taipei, Taiwan).
- Received November 16, 2005.
- Accepted July 31, 2006.
- © ERS Journals Ltd
References


