


Abstract
To contribute to evidence-based policy making, a dynamic Dutch population model of chronic obstructive pulmonary disease (COPD) progression was developed.
The model projects incidence, prevalence, mortality, progression and costs of diagnosed COPD by the Global Initiative for Chronic Obstructive Lung Disease-severity stage for 2000–2025, taking into account population dynamics and changes in smoking prevalence over time. It was estimated that of all diagnosed COPD patients in 2000, 27% had mild, 55% moderate, 15% severe and 3% very severe COPD. The severity distribution of COPD incidence was computed to be 40% mild, 55% moderate, 4% severe and 0.1% very severe COPD. Disease progression was modelled as decline in forced expiratory voume in one second (FEV1) % predicted depending on sex, age, smoking and FEV1 % pred. The relative mortality risk of a 10-unit decrease in FEV1 % pred was estimated at 1.2. Projections of current practice were compared with projections assuming that each year 25% of all COPD patients receive either minimal smoking cessation counselling or intensive counselling plus bupropion.
In the projections of current practice, prevalence rates between 2000–2025 changed from 5.1 to 11 per 1,000 inhabitants for mild, 11 to 14 per 1,000 for moderate, 3.0 to 3.9 per 1,000 for severe and from 0.5 to 1.3 per 1,000 for very severe COPD. Costs per inhabitant increased from \#8364;1.40 to 3.10 for mild, \#8364;6.50 to 9.00 for moderate, \#8364;6.20 to 8.50 for severe and from \#8364;3.40 to 9.40 for very severe COPD (price level 2000). Both smoking cessation scenarios were cost-effective with minimal counselling generating net savings.
In conclusion, the chronic obstructive pulmonary disease progression model is a useful instrument to give detailed information about the future burden of chronic obstructive pulmonary disease and to assess the long-term impact of interventions on this burden.
- Chronic obstructive pulmonary disease
- cost-effectiveness
- disease severity
- epidemiology
- model
- smoking cessation
Worldwide, the increase in the prevalence, morbidity, mortality and costs of chronic obstructive pulmonary disease (COPD) that has been projected for future decades 1–3 has drawn the attention of healthcare policy makers. They realise that slowing down disease progression is one way to reduce the increasing healthcare costs, as there is a strong association between use of healthcare services and disease severity 4–7. Currently the only available intervention proven to slow down disease progression before patients develop severe COPD is smoking cessation. The Lung Health Study (LHS) demonstrated that COPD patients who quit smoking had an improvement in lung function in the first year, and a subsequent rate of decline that was half the rate observed among continued smokers 8.
To project the future burden of COPD in The Netherlands by disease severity and to evaluate the impact of different smoking cessation interventions on the national burden of COPD, a population model has been developed that simulates COPD progression over four severity stages. The model builds further upon a dynamic multi-state life table model developed by the National Institute for Public Health and the Environment and described by Feenstra et al. 3, which models the Dutch prevalence, incidence and mortality of COPD as a single disease state. With this single-state model, the prevalence of COPD between 1994 and 2015 was projected to increase by 40% for males and 140% for females 3.
The objective of the present study was to describe the design of the dynamic population-based COPD model with severity stages. The reason for developing this model was to provide healthcare policy makers, insurers and care providers with detailed information about the future burden of COPD for the years 2000–2025, which can be used in planning public health strategies. The model is particularly suitable for comparing the impact of different interventions on the national burden of COPD in the long run. Therefore, the applicability of the model was illustrated by comparing two scenarios on increased use of smoking cessation interventions by COPD patients with current practice. Although the model is currently populated with Dutch data, it is likely that the trends represent other Western countries with an ageing population and a history of a relatively high smoking prevalence (currently ∼30% in The Netherlands).
METHODS
General structure of the model
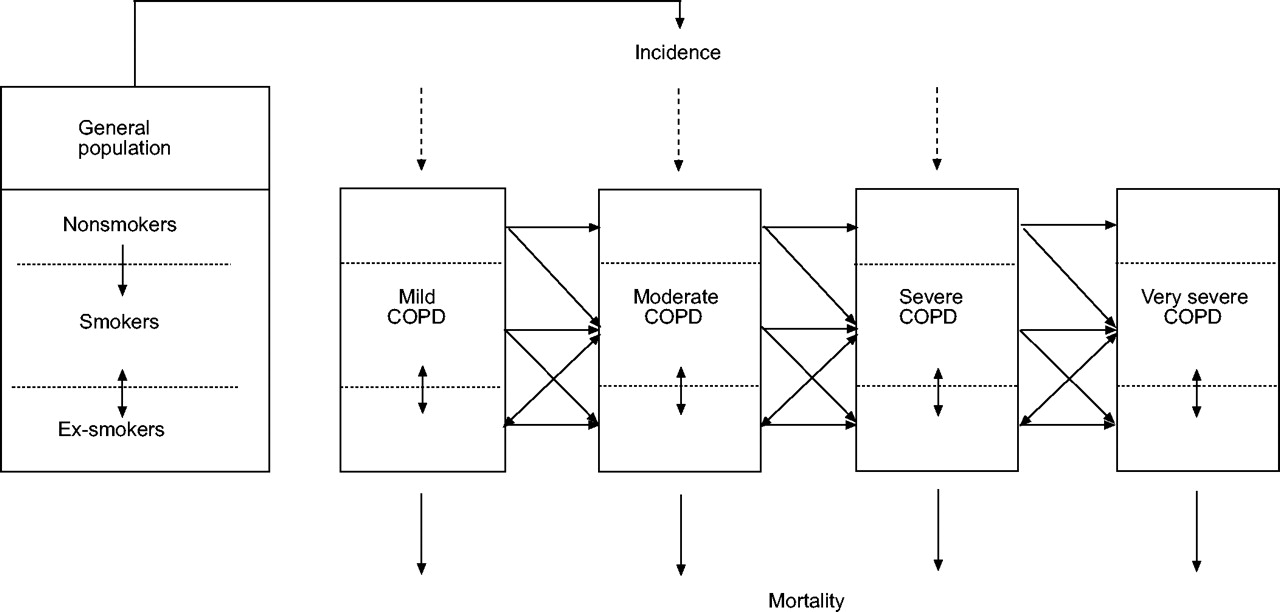
The COPD model is a dynamic population model that projects the incidence, prevalence, mortality, progression and healthcare costs of COPD per Global Initiative of Chronic Obstructive pulmonary Disease (GOLD) severity stage as well as changes in the healthy population, i.e. no COPD, as present in the entire Dutch population. The multi-state model is based on the life table method as it follows births cohorts over time. Each year a new birth cohort is added, while the existing birth cohorts age by 1 yr. Dynamics of the general population are taken into account using prognosis of birth, mortality and migration as obtained from Statistics Netherlands (Voorburg/Heerlen, The Netherlands). Within each birth cohort people can move between smoking classes, be diagnosed with COPD, move to another COPD severity stage or die, all with a certain annual probability. Changes in age and sex-specific smoking prevalence in the general population are computed by the model using the currently observed age and sex specific start, quit and restart rates that are based on data from the Dutch Foundation for Smoking and Health, and three Dutch cohort studies (table 1⇓) 9–13. Figure 1⇓ shows the basic structure of the COPD model. The prevalence and incidence of COPD are distributed over four severity stages (table 2⇓). COPD incidence and prevalence in the four severity stages are computed by sex and 5-yr age classes, starting at age 45 yrs and ending at an age >85 yrs. Incidence also depends on smoking status, defined as current smoker, nonsmoker or ex-smoker. Disease progression is modelled as annual decline in forced expiratory volume in one second (FEV1) % predicted, depending on sex, age, smoking status and FEV1 % pred. Disease progression is then transformed into an annual transition rate, i.e. the annual probability of moving to a worse COPD stage (table 1⇓). The effects of smoking cessation are modelled as a one-time increase in FEV1 % pred and a reduced disease progression. COPD mortality rates (table 2⇓) depend on FEV1 % pred, age, sex and smoking. Competing risks have been accounted for by including smoking-related causes of death as well as other unrelated causes of death in the model. The model assumes “conditional independence”, i.e. within one age, sex and smoking class mortality rates for different diseases are assumed to be mutually independent. This implies, for example, that given age and sex, the probability for a smoking COPD patient to die from lung cancer is the same as the probability for a smoking person without COPD. However, as there are more smokers and ex-smokers among COPD patients than among non-COPD patients, an average COPD patient has a higher risk of getting lung cancer and, consequently, a higher risk of dying from it. Costs are calculated by multiplying the number of patients per sex, age and COPD severity stage with the annual costs per patient in the corresponding class.
The structure, assumptions, input data and results of the model were discussed with an expert panel of scientists, including pulmonologists. All mathematical details of the model have been described previously 14. The main outcome parameters of the model were prevalence, mortality and costs specified by sex, age, smoking status, COPD severity and year.
Input data
Prevalence by severity
COPD prevalence by sex and age was obtained from general practitioner (GP) registrations 15–17, indicating that it refers to “physician-diagnosed COPD”. The mean prevalence rate for people aged >45 yrs was 67 per 1,000 for males and 37 per 1,000 for females.
To estimate the severity distribution of the prevalence of COPD in The Netherlands in the year 2000, two different sources of GP data were used 15, 18. The first database consisted of data from five general practices, which are part of an academic general practice network 15. In these practices all available spirometric test results were stored in electronic patient files. The second database contained the lung function data of asthma and COPD patients from 25 GP practices at baseline of a clinical trial 18. No specific criteria, other than having a physician diagnosis of asthma or COPD and not having another pulmonary or terminal disease, were used to allow patients to enter the trial. The FEV1 % pred of all patients with a physician diagnosis of COPD, ≥45 yrs of age and airflow limitation (FEV1/forced vital capacity <70%) from both data sources was used to distribute COPD over mild, moderate, severe or very severe COPD according to the lung function boundaries in the GOLD guidelines 1. Both sources together contained a total of 481 COPD patients. The frequency distribution of the FEV1 % pred did not significantly deviate from a normal distribution with a mean±sd = 68.3±19.9. From this distribution, truncated at 10 and 110 FEV1 % pred, it was estimated that 27% (95% confidence interval (CI) = 23–31%) of the patients had mild COPD, 55% (95% CI = 51–60%) moderate COPD, 15% (95% CI = 12–19%) severe COPD and 3% (95% CI = 1–4%) very severe COPD. This distribution was applied to each subgroup of COPD patients defined by sex, age and smoking status in the base year.
Incidence by severity
Total COPD incidence by age and sex was obtained from the same GP registrations as the prevalence data. The mean annual incidence rate for people aged >45 yrs was six per 1,000 for males and three per 1,000 for females. The distribution of the incidence over the severity stages was estimated mathematically, such that given the prevalence, disease progression and mortality in 2000, the distribution of FEV1 % pred in the entire COPD population in the year 2001 was not different from the distribution in the year 2000, when keeping smoking prevalence rates and population numbers constant. This resulted in a normal distribution for the incidence with a mean FEV1 % pred of 76.4±15.6. Using these normal distribution characteristics and the cut-off points of the COPD stages, the distribution of the incidence was estimated to be 40% in mild, 55% in moderate, 4% in severe and 0.1% in very severe COPD. This distribution was applied to the sex, age and smoking-specific incidence numbers in each year after 2000.
Decline in lung function by severity
Disease progression was modelled as annual decline in FEV1 % pred, which depended on sex, age, smoking and FEV1 % pred. Estimates of the decline in FEV1 % pred were based on the LHS 8. The original 5-yr follow-up data from the 5,887 COPD patients were re-analysed using a random effect model with year, smoking cessation, sex, age, age2 (i.e. age×age), baseline FEV1 % pred and all statistically significant second order interactions as explanatory variables (see Appendix 1). The increase in FEV1 % pred associated with smoking cessation was included in this same model. Increase and decline outside the range of the age and lung function values observed in the LHS were based on the equation given in Appendix 1. No data were available for nonsmoking COPD patients. Therefore, decline among nonsmoking COPD patients was assumed to be equal to the decline among the ex-smokers. Annual decline was transformed into stage transition rates indicating the probability of moving to a worse severity stage, from a given severity stage, e.g. from mild to moderate (table 1⇓). COPD patients who quit smoking could move to a less severe stage, but total remission from COPD was impossible. In the first year, 0.6% of the moderate smoking patients moved to mild COPD, 1.7% of the severe patients moved to moderate COPD and 1.8% of the very severe patients moved to severe COPD because of smoking cessation.
Mortality by severity
In the model, all cause mortality among COPD patients was divided into “excess mortality” and “mortality from other causes”. Excess mortality was defined as the difference in mortality between COPD patients and the general population, which includes the increased risk of dying from other smoking-related diseases.
In order to obtain a well-documented estimate of the relative risk for all-cause mortality per unit change in FEV1 % pred, a meta-analysis was performed on papers published between 1970 and 2002, which reported the association between FEV1 % pred and all-cause mortality in COPD patients (Appendix 2). Other selection criteria were papers with a follow-up of ≥3 yrs and a correction of the proportional hazard rate for at least age and smoking. The relative risks obtained from the different studies were combined into a weighted average, using the precision of the estimates in the study (i.e. the size of the 95% CI) as weights. Assuming a log-linear risk function, this meta-analysis resulted in an estimate of the relative risk (RR) per 10-unit decline of 1.20 (95% CI 1 = 16−1.23) for studies in COPD patients 19–23. Hence, for each 10-unit decline in FEV1 % pred, a 20% increase in excess mortality was modelled. As mortality increases with COPD severity, a 20% increase among patients with severe COPD has much more impact on absolute mortality than a 20% increase among patients with less severe COPD. Non-COPD related mortality was assumed not to depend on COPD severity, but only on sex, age and smoking.
COPD-related healthcare costs by severity
A Dutch prevalence-based cost of illness study for the year 2000 was performed. National and regional ongoing registrations or surveys were used from which the costs of GP visits, outpatient visits, home care, day-care treatment in hospital, inpatient hospital care, nursing home and residential care, influenza vaccination, medication, oxygen therapy and lung transplantation were estimated (Appendix 3). As there were no Dutch data on resource use per severity stage, a Swedish study was used to obtain ratios for the direct medical costs of a patient with moderate (2.22), severe (7.51) or very severe COPD (24.67) compared with the costs of a patient with mild COPD (1.0) 5. These ratios were used to assign total Dutch costs within each sex and age class to the different severity stages.
Projections
Running the model for the period 2000–2025 resulted in projections of the COPD population and its cost of care for current practice. Prevalence and mortality rates were expressed as rates per 1,000 inhabitants. The projections of current practice were an extrapolation of currently observed trends in smoking behaviour and disease progression. It was assumed that the age and sex specific incidence and mortality rates for each severity and smoking class remained constant. Throughout the projections, the costs per mild, moderate, severe and very severe patient were also assumed constant at the level of the year 2000.
Sensitivity analysis
To study the robustness of the projections of the model, extensive one-way sensitivity analyses were performed (SA1–SA8). In the first sensitivity analysis the severity distribution of the COPD prevalence was assumed to be age-dependent. For each year <66 yrs (mean age of the COPD patients the distribution was based on), the normal distribution shifted 0.5% pred to the less severe stages, while for each year >66 yrs it shifted 0.5% pred to the more severe stages. The second sensitivity analysis assumed the severity distribution of the incidence to be the same as the distribution of the prevalence, i.e. 27% of the incidence in mild COPD, 55% in moderate COPD, 15% in severe COPD and 3% in very severe COPD. The effect of the assumption that 60% of the incidence occurred in mild COPD and 40% in moderate COPD was investigated in the third sensitivity analysis. The fourth sensitivity analysis tested the effect of a 10% lower decline in FEV1 % pred than predicted from the LHS, while the fifth sensitivity analysis tested the effect of a 10% higher decline. In the sixth sensitivity analysis, the one-time increase in lung function of the COPD patients who stopped smoking was assumed to be zero. The seventh sensitivity analysis assumed the decline in nonsmoking COPD patients to be equal to the decline in smoking instead of former smoking COPD patients. In sensitivity analysis eight, a more than exponential association between lung function and mortality risk (i.e. log-quadratic) was tested, because results of the meta-analysis gave indications for a deviation from the exponential model.
Evaluation of two scenarios on increased implementation of two smoking interventions
In the projections of current practice, annual changes in the number of nonsmokers, smokers and ex-smokers, both in the general population and the COPD population, were modelled assuming that current age and sex specific start, quit and restart rates for smoking remain constant over time. The current cessation probability among COPD patients was estimated to be on average 4.7% for both males and females. This current cessation rate was calculated by applying the sex and age-specific cessation rates in the general population to the sex and age distribution of the COPD patients 9, 10.
To illustrate the potential use of the model in setting public health priorities, the cost-effectiveness of two smoking cessation scenarios was assessed. The first scenario assumed that smoking COPD patients were offered minimal counselling by the general practitioner, with a 12-month continuous abstinence probability of 7.9% 24, 25. The second scenario assumed that smoking COPD patients were offered intensive counselling in combination with bupropion (IC+Bupr). The 12-month continuous abstinence of this intervention was 17.2% 26. In both scenarios it was assumed that, each year, 25% of all COPD patients used the intervention. This implied that 25% of all smoking COPD patients had a higher smoking cessation probability of either minimal GP counselling (7.9%) or intensive counselling plus bupropion (17.2%). The remaining 75% of the smoking COPD patients kept the current cessation probability. Intervention costs of both smoking cessation interventions were based on bottom up estimates of resource use and costs per unit 27. Estimates of resource use were based on practice guidelines and the original clinical trials from which the effectiveness data were taken. Intervention costs were \#8364;21 per patient for minimal GP counselling and \#8364;334 per patient for IC+Bupr. Both scenarios were compared with the projections made for current practice. The evaluation was performed over the period 2000–2025 and for different implementation periods of the interventions: 1, 10 or 25 yrs. Increasing the number of quitters resulted in less progression to worse severity stages, less mortality and less COPD-related costs. To calculate the quality-adjusted life-years (QALYs), life-years were corrected for the quality of life during these years by means of the COPD severity stage specific QALY weights published by Borg et al. 28. To compute costs per life-year and costs per QALY gained, the savings in COPD-related healthcare costs were subtracted from the additional costs of the smoking intervention. These net costs were divided by the gain in life-years or the gain in QALYs. A discount rate of 4% was applied to both costs and effects.
RESULTS
Prevalence and mortality
The model projected that between 2000 and 2025 the absolute number of diagnosed COPD patients increased from 188,000 to 270,000 for males and from 117,000 to 224,000 for females. The prevalence of COPD in the Dutch population of all ages was projected to increase from 24 to 33 per 1,000 inhabitants for males and from 15 to 27 per 1,000 inhabitants for females. The prevalence increased both in males and females, but the increase was higher for females. Figure 2⇓ shows prevalence rates per severity stage over time. When prevalence rates for males and females were combined they increased from 5.1 to 11 per 1,000 for mild COPD, from 11 to 14 per 1,000 for moderate COPD, from 3.0 to 3.9 per 1,000 for severe COPD and from 0.5 to 1.3 per 1,000 for very severe COPD. This resulted in an increase of the total prevalence rate from 19 to 30 per 1,000 inhabitants.
The absolute number of deaths among COPD patients increased from 15,000 to 23,000 for males and from 8,000 to 16,000 for females. For males the total mortality rate changed from 1.9 to 2.9 per 1,000. This indicates that per 1,000 males in the general population in 2025, 2.9 with COPD will die during that specific year. For females the total mortality rate increased from 1.0 to 1.9 per 1,000. Figure 3⇓ shows the absolute number of deaths among COPD patients for the different severity stages for the years 2000 and 2025. When mortality rates for males and females were combined, they increased from 0.3 to 0.7 per 1,000 for mild COPD, from 0.8 to 1.1 per 1,000 for moderate COPD, from 0.3 to 0.4 per 1,000 for severe COPD and from 0.1 to 0.2 per 1,000 for very severe COPD, resulting in an increase of the total mortality rate from 1.4 to 2.4 per 1,000. These rates are expressed per 1,000 inhabitants, thus reflecting that prevalence was highest for moderate COPD, followed by mild, severe and very severe COPD.
Healthcare costs
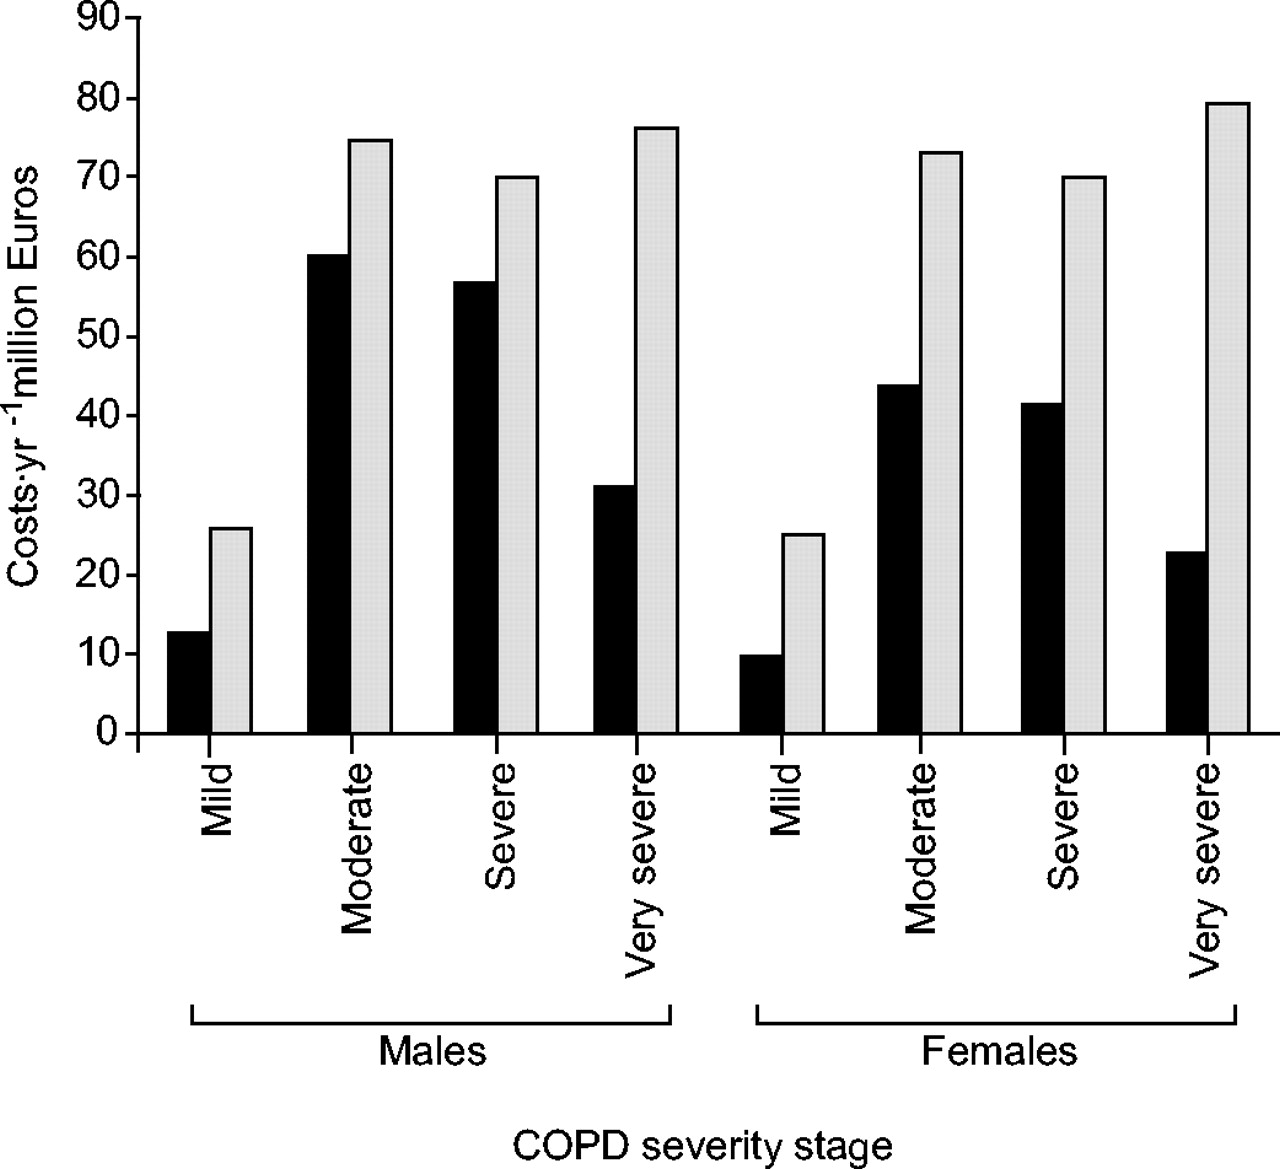
Total COPD-related healthcare costs in 2000 were estimated to be \#8364;280 million, \#8364;161 million for males and \#8364;119 million for females. The model projected the costs to increase to \#8364;495 million in 2025, \#8364;248 and \#8364;247 million for males and females, respectively. As costs per patient in a severity class were kept constant over time, this increase in total costs was caused by the increase in prevalence combined with the change in the severity distribution of the COPD population. Figure 4⇓ presents the total COPD-related healthcare costs per severity stage for the years 2000 and 2025. When expressed per Dutch inhabitant, costs increased from \#8364;1.40 to 3.10 for mild COPD, from \#8364;6.50 to 9.00 for moderate COPD, from \#8364;6.20 to 8.50 for severe COPD and from \#8364;3.40 to 9.40 for very severe COPD, resulting in an increase of the total costs per inhabitant from \#8364;18 to 30.
Sensitivity analysis
Table 3⇓ summarises the results of the sensitivity analysis. All projections of total prevalence numbers in 2025 were within a range of 5% of the projections of the base case. Variations in assumptions regarding the severity distribution of the prevalence by age (SA1), the decline in lung function (SA4 and SA5), the decline in lung function among nonsmoking COPD patients (SA7), increase after smoking cessation (SA6) or the association between lung function and mortality (SA8) hardly affected the estimates of prevalence by severity. Estimates of the COPD prevalence, mortality and costs were most sensitive to the assumption on the severity distribution of the incidence. The two assumptions regarding the distribution of incidence resulted in a shift of the severity distribution to either less severe stages (SA3) or more severe stages (SA2) compared with the base case. Projections of the costs in 2025 ranged from −30% (SA3) to +40% (SA2) of the costs projected for the base case model. When lung function decline was either 10% lower or 10% higher than pred from the LHS data, the costs were 6% lower or higher compared with the base case.
Cost-effectiveness of smoking cessation in COPD
Increased implementation of minimal GP counselling for 1 yr resulted in 1,200 additional quitters compared with the projections of current practice. The intervention costs for 1 yr implementation were \#8364;800,000, \#8364;700 per additional quitter. In total, 4,700 additional quitters were gained after 1 yr implementation of IC+Bupr. The intervention costs for 1-yr implementation were \#8364;12.7 million, \#8364;2,700 per additional quitter. Table 4⇓ shows the discounted cumulative costs and effects over a period of 25 yrs and the resulting cost-effectiveness ratios in terms of costs per life-year gained and costs per QALY gained. Regardless of the implementation period, minimal GP counselling was a dominant strategy compared with current practice, because effects were higher and the cost savings were higher than intervention costs. For a 25-yr implementation period at 4% discounting, 1,400 life-years or 2,500 QALYs were gained. Subtracting the savings in COPD-related costs from the intervention costs over the 25-yr period resulted in a net saving of \#8364;9.2 million. IC+Bupr is more effective. Over the 25-yr period 5,400 life-years or 9,300 QALYs were gained, but the intervention costs were much higher and not fully offset by extra savings. Costs per QALY gained were estimated to be \#8364;14,100 for IC+Bupr.
DISCUSSION
Whenever it is important to inform policy makers about the expected future trends in the epidemiology of a disease and the long-term impact of implementation of certain interventions, modelling is required. In the present study a dynamic population model for COPD was developed that included progression of COPD over time from diagnosis of the disease to death. This model was used to project the prevalence, mortality and COPD-related healthcare costs by severity stage and to assess the long-term impact of two smoking cessation interventions.
The projections of current practice have shown that over a period of 25 yrs, an increase of six mild, three moderate, 0.9 severe and 0.8 very severe patients per 1,000 inhabitants in The Netherlands can be expected. This increases total COPD-related healthcare costs from \#8364;280 to 495 million in 2025, an increase of almost 80%. Costs of COPD per Dutch inhabitant increased from \#8364;18 to 30. Of every 1,000 inhabitants in the year 2025, 2.4 COPD patients will die compared with 1.4 in the year 2000.
In absolute terms, prevalence, mortality and costs were highest for moderate COPD, but the proportional increase in these parameters between 2000 and 2025 was highest for very severe COPD and second highest for mild COPD. The latter is explained by the relative high incidence in this stage in combination with the slow progression of the disease. The first can partly be explained by the increasing number of Dutch inhabitants, especially females with a long smoking history, in the highest age categories.
The main reason to develop such a COPD model is to have an instrument with which to compare the success of various interventions in reducing the expected increase in the burden of COPD. This can only be done with a model that incorporates disease progression over time. To illustrate its use, projections of current practice were compared with two scenarios in which it was assumed that COPD patients more often got minimal counselling by a GP or IC+Bupr. The model showed that offering minimal GP counselling to 25% of all diagnosed, smoking COPD patients resulted in a gain in health and life-years and net cost savings irrespective of whether the intervention was implemented for 1, 10 or 25 yrs. The combination of IC+Bupr to 25% of all smoking COPD patients each year, for a period of 10 yrs, resulted in costs per life-year gained of ∼\#8364;12,000 (\#8364;7,700 per QALY), which is relatively low compared with other healthcare interventions.
The COPD model was embedded in a population model so that outcomes represented the Dutch setting. The Dutch COPD population, as in other high-income countries, reflects the smoking epidemic of the past decades. Short-term developments depend on ageing and the effects of past smoking behaviour 3. The current model describes these developments in detail and enables evaluation of policy measures to reduce the burden of COPD. For other countries with similar populations and comparable underdiagnosis, similar results might be expected. However, whether the cost-effectiveness outcomes have validity for other countries also depends on the relative costs of different types of care. The model structure would allow translating the model to different countries using country specific data on costs, smoking behaviour and the severity distribution of incidence and prevalence.
It is important to stress that this is a model of physician-diagnosed COPD patients, since undiagnosed subjects are not modelled. Underdiagnosis is a well-known problem in COPD. However, because the model is intended to be a policy model only diagnosed COPD is described and modelled. Undiagnosed patients may also use care for their COPD, but this care can never be related to COPD. An interesting topic for future research is the evaluation of case finding. Case finding efforts would shift the incidence distribution to the less severe cases and over time also shift the prevalence distribution.
It is further important to note that because the model is a dynamic population model and not a cohort model that follows a group of COPD patients over time until they have all died, it does not suffer from cohort or survival effects.
In order to validate the model, outcomes of total COPD prevalence for the years 2000–2003 were compared with the prevalence as found in the Continuous Morbidity Registration (CMR) 15. As differences in prevalence rates per 1,000 between the model projections and the CMR data varied from 0.42 for females in 2003 to 3.71 for males in 2003, it was concluded that the current model projections compare quite well with this GP registration. As the CMR does not contain prevalence rates by disease severity, this registration could not be used to validate the severity distribution. The severity distribution of COPD was, therefore, validated with data from a Dutch study on a new regional patient management program in the Maastricht area (The Netherlands) in which all known COPD patients, treated either in primary care or by pulmonologists, underwent spirometry testing at baseline 29. The Maastricht study estimated the severity distribution of COPD in 2002/2003 to be 30% in mild, 48% in moderate, 17% in severe and 5% in very severe COPD. The current model projections for the year 2003 were 29, 52, 16 and 3%, respectively. Hence, they were quite close to the estimates from Maastricht. It is not possible to validate the model to historical data, as the severity distributions of incidence and prevalence were not available in the past, as lung function measurements did not routinely take place in GP practices.
Although modelling is a powerful tool to estimate the long-term effects of interventions that cannot be studied in clinical trials, it certainly has limitations. Due to limited availability of suitable epidemiological data to generate robust estimates, making assumptions was inevitable. The most important assumptions will now be discussed. For simplification of the model the progression of COPD was assumed to be primarily dependent on decline in FEV1 % pred, which in turn, depends on sex, age, smoking status and FEV1 % pred. Of course, the progression of COPD is influenced by many other factors, such as smoking history, susceptibility to smoking and exacerbations. As the current model primarily concentrates on disease progression, it omits COPD exacerbations. Recently two studies have found indications that exacerbations accelerate the decline in lung function by approximately 8 mL·yr−1 30, 31, which seems to be relatively modest. Hence, the results presented above would probably not change much after inclusion of exacerbations. However, in order to model the cost-effectiveness of interventions that reduce the number, duration and/or severity of exacerbations, exacerbations will be included in future versions of the model. Currently, it is impossible to explicitly include treatment-related variables with a possible influence on COPD progression or survival, such as oxygen therapy or nutritional and exercise interventions, into the model because the size of the effect in terms of lung function decline is still unknown. However, their effect is already present in the estimates of the input parameters of the model, as these were largely obtained from registries or studies that allowed patients to obtain treatment deemed necessary.
The sex- and age-specific estimates of COPD prevalence and incidence, which were obtained from regional GP registrations, were assumed to be representative for the Dutch population of diagnosed COPD patients. This assumption is reasonable, as virtually all people in The Netherlands, including those treated by pulmonologists, are registered with a GP practice. Nevertheless, the recording of spirometric results in the electronic patient records is far from perfect and when, for example, results of severe patients are more likely to be missing, the prevalence of severe and very severe COPD might be underestimated. Furthermore, data were too limited to enable specification of the severity distribution by sex, age and smoking status. In the sensitivity analysis the severity distribution by age (SA1) was varied, but the projections did not change much.
Although the LHS is the best and largest study on the effects of smoking and smoking cessation on lung function in COPD, it has limitations for the current studies purpose 8. The study population mainly consisted of subjects with mild-to-moderate airflow obstruction aged 40–60 yrs. Decline (and increase after smoking cessation) for patients outside the observed age and lung function range had to be based on extrapolation of the data using the random effect model. Changing the annual decline in lung function with ±10% did not influence the outcomes greatly (SA4, 5). As nonsmokers did not participate in the LHS, the decline in lung function among nonsmokers was assumed to equal the decline among ex-smokers. This was thought to be more realistic than assuming that the decline equals the decline in nonsmokers in the general population. As the number of never smoking COPD patients was rather small, assuming the decline of nonsmokers to be equal to the decline in smoking COPD patients did not change the results greatly (SA7).
Results from the sensitivity analyses show that the model projections are most sensitive to changes in the assumption about the severity distribution of the incidence. It is important to stress that the two assumptions tested in the sensitivity analysis were extremes. Such extremely different assumptions were not applied to other variables in the sensitivity analyses. The choice of these sensitivity analyses resulted from very different views of the expert panel on the incidence distribution. The assumption that 60% of the incidence occurred in mild and 40% in moderate COPD reflects the optimistic view that COPD is increasingly diagnosed in earlier stages, while the assumption that the severity distribution of the incidence equals the distribution of the prevalence represents a pessimistic view with many patients diagnosed when they already have advanced COPD. The real distribution is somewhere in between, and probably close to, what was estimated, i.e. 40% in mild, 55% in moderate, 4% in severe and 0.1% in very severe COPD.
In conclusion, a dynamic chronic obstructive pulmonary disease model has been constructed that summarises much of the current epidemiological knowledge about chronic obstructive pulmonary disease. This model is a valuable tool for policy making, because it can represent and identify trends in the future burden and costs of chronic obstructive pulmonary disease and assess the cost-effectiveness of interventions offered to patients with chronic obstructive pulmonary disease in different severity stages.

The four severity stages of chronic obstructive pulmonary disease (COPD) and the three classes for the risk factors are the building blocks of the model. The dynamic nature is illustrated by the arrows representing the annual disease incidence, mortality, the transitioning of patients to more severe disease states and the changes between risk factor classes.

Projections of the prevalence rates per severity stage over time for a) males and b) females. ▪: moderate chronic obstructive pulmonary disease (COPD); •: mild COPD; ▴: severe COPD; ♦: very severe COPD.

Absolute number of deaths among chronic obstructive pulmonary disease (COPD) patients in 2000 (▪) and projections for 2025 ( ) by sex and severity stage.

Total chronic obstructive pulmonary disease (COPD)-related healthcare costs in 2000 (▪) and projections for 2025 ( ) by sex and severity stage.
Transition rates between smoking classes for the general and chronic obstructive pulmonary disease(COPD) population and transition rates between COPD severity stages for 2000
Prevalence#, incidence#, excess mortality¶ and costs+ for 2000
Sensitivity analysis: comparison of projections of prevalence, mortality and total cost (\#8364;) in 2025 with the base case
Number of(quality adjusted) life-years (LY or QALYs) gained, total intervention costs, total savings and cost-effectiveness: cumulative over the years 2000–2025, discounted at 4% for both costs and effects (\#8364;, year 2000 price level)
Regression coefficients of the random effect model used to calculate annual decline in lung function
Relative mortality risks of a 10-unit decline in forced expiratory volume in one second % predicted
Data source, unit costs and total costs per type of care
APPENDIX 1: Calculation of annual decline in lung function
Table 5⇑ shows the regression coefficients of the random effect model based on the original 5-yr follow-up data of the LHS. This model was used to calculate sex, age, smoking status and FEV1 % pred dependent values of annual decline in lung function.
APPENDIX 2: Meta-analysis on lung function and mortality
To estimate the relationship between FEV1 % pred and all-cause mortality, a meta-analysis was performed on papers published between 1970 and 2002 reporting this association in a general or COPD population. Papers had to meet the following inclusion and exclusion criteria:
-
≥3 yrs of follow-up
-
Caucasian population
-
Association corrected for at least age and smoking
-
Association not corrected for dyspnoea and decline in lung function
-
Not in patients hospitalised for a COPD exacerbation
-
Reporting standard errors (se)
For each paper that directly reported the RR per unit of change in FEV1 % pred, the relative change in mortality rate associated with a 10-unit decline in FEV1 % pred was calculated. For each paper that reported the RRs per class of FEV1 % pred a log-linear risk function was first fitted on the data, before the RR of a 10-unit decline in FEV1 % pred was calculated. The RRs of all papers were combined into a weighted mean, using the precision of the estimate in each paper as a weight.
In total, 17 studies were found. Of these 11 directly reported the RRs per unit change in FEV1 % pred 1–11 and six reporting the RRs by class of FEV1 % pred 12–17. Only five of the 17 were carried out in COPD patients 5, 7, 8, 11, 12. Table 6⇑ shows the results for COPD and the general population. Two additional studies were found in COPD, but they did not report se 18, 19. When the two studies not reporting se were included, the mean RR in seven COPD studies, weighted for the sample size in each study, was 1.28.
Among COPD patients each 10-unit decrease in FEV1 % pred increased the mortality risk by ≥20%. This is a significantly higher increase than the 11% increase among the general population.
APPENDIX 3: Cost illness study for COPD
A prevalence-based cost of illness study for the year 2000 was performed. Only direct medical costs were taken into account. Data on healthcare use were, as much as possible, obtained from representative national registries to obtain age- and sex-specific data. Costs per unit of resource use were also estimated. Resource use was multiplied with unit costs to calculate total costs for COPD care in The Netherlands (table 7⇑). All costs were valued in \#8364; (price level 2000).
Acknowledgments
The authors would like to thank T. Schermer from the Dept of General Practice, University Medical Center St. Radboud (Nijmegen, The Netherlands) and A. Hesselink from the Institute for Research in Extramural Medicine (EMGO institute; Amsterdam, The Netherlands) for providing data to estimate the severity distribution of the prevalence of chronic obstructive pulmonary disease. The National Heart, Lung and Blood Institute is thanked for providing the Lung Health Study data. The structure, assumptions, input data and results of the model were discussed with an expert panel of scientists whose comments gave rise to various alterations of the draft model. The authors would also like to thank I. Smeele (general practitioner) and J.P. Schouten (epidemiologist) for their valuable input.
Footnotes
-
For editorial comments see page 189.
- Received October 25, 2004.
- Accepted April 1, 2005.
- © ERS Journals Ltd


