


Abstract
For the measurement of the single-breath transfer factor of the lung for carbon monoxide (TL,CO,sb), the American Thoracic Society (ATS) recommends using a test gas with a 21% inspired fraction of oxygen (FI,O2) whereas the European Respiratory Society (ERS) expressly recommends 17–18% FI,O2. The ERS committee argues that with a higher concentration (e.g. 21%) the alveolar fraction of oxygen (and accordingly TL,CO,sb) “varies with the volume of the test gas which is inspired”, that is, presumably, in proportion to the volume of the test gas that is diluted in the alveolar volume.
The current study measured TL,CO,sb and the transfer coefficient (KCO,sb) in duplicate in 67 healthy adults (age 17–23 yrs) using, in random order, an inspired gas containing either 17.5% or 21% oxygen. A correction was applied for carboxyhaemoglobin, in line with ATS recommendations.
As expected, TL,CO,sb was higher with 17.5% FI,O2 test gas compared with 21% FI,O2 test gas (11.98±2.68 versus 11.38±2.56 mmol·min−1·kPa−1, respectively) as well as KCO,sb (1.98±0.24 versus 1.90±0.23 mmol·min−1·kPa−1, respectively). The ratio of TL,CO,sb measurements was strictly independent of the residual volume/total lung capacity ratio measured with plethysmography.
Hence, the rationale used by the European Respiratory Society, which utilises a 17–18% inspired fraction of oxygen test gas for single-breath transfer of the lung for carbon monoxide measurements, would appear to be unwarranted in young healthy adults.
Measurement of the transfer factor for carbon monoxide with the single-breath technique (TL,CO,sb) is influenced by several factors relating to: the equipment, how the operation is performed, the methods of calculation and the subject's personal characteristics. Updated recommendations for a standard technique have been issued by the European Respiratory Society (ERS) 1 and by the American Thoracic Society (ATS) 2. However, although the recommendations are similar, there is still controversy over the inspired fraction of oxygen (FI,O2) that should be used for the test gas. The partial pressure of oxygen in erythrocytes contributes to determining the reaction rate of carbon monoxide with haemoglobin and, as a result, affects the transfer factor. As the capillary oxygen partial pressure is determined mainly by the alveolar oxygen tension (PA,O2), this quantity has to be standardised. The ATS committee recommends using a test gas FI,O2 of 21%, based on standard practice in the USA, arguing that no data are available to suggest a preference for European or American methods 2.
The ERS committee expressly recommends against using a test gas FI,O2 of 21%, “a higher concentration (e.g. 21%) is not recommended because the PA,O2 then varies with the volume of the test gas which is inspired” 1. Presumably the committee means that, when the test gas FI,O2 is different from the alveolar fraction of oxygen (FA,O2), the PA,O2 varies in proportion to the test gas that is diluted in the alveolar volume. As the inspired volume (vital capacity (VC)) is diluted in the residual volume (RV), the PA,O2 should then be correlated to the ratio of the RV/total lung capacity (TLC). Therefore, the recommendation of the ERS committee would clearly be justified if the RV/TLC ratio affected TL,CO,sb with FI,O2 at 21%, whilst not doing so with a value of FI,O2 at 17–18%.
The aims of the study were to measure TL,CO,sb in a group of healthy subjects using two FI,O2 test gases and to determine whether, in this population, the RV/TLC ratio affected TL,CO,sb differently, depending on the FI,O2.
Methods
Subjects and study protocol
Sixty-seven young adults (31 females, 36 males; age 17–23 yrs), with no history of cardiac or respiratory disease, gave their informed consent and served as healthy volunteers. All subjects were students in the Faculty of Medicine, which facilitated data collection during practical teaching sessions, following a procedure approved by the University Council. The whole class (77 students) was enrolled in the teaching session but only 67 healthy students were included in the study. The tests were conducted between 10:00 and 13:30 h. All measurements were completed within 2 months. Linearity of the carbon monoxide (CO) and helium (He) analysers was checked before the session. Error accounted for <0.5% full scale for the CO analyser and <1% full scale for the He analyser.
Subjects underwent whole body plethysmography, followed by four measurements of TL,CO,sb. Two measurements were taken with a 17.5% FI,O2 test gas and two with a 21% FI,O2 test gas. The order of the gas was reversed every two students. Despite secondary exclusion of the non-healthy students, the randomisation scheme was respected. Thirty-four volunteers (20 males) began with the 17.5% FI,O2 test gas and 33 volunteers (16 males) began with the 21% FI,O2 test gas. Before the tests, the subjects breathed normal room air, as TL,CO,sb is considered to be independent of the pre-test FI,O2 condition 3.
Haemoglobin (Hb) and carboxyhaemoglobin (HbCO) were measured in duplicate on blood capillary microsamples before and after the TL,CO,sb measurements, with two different oximeters (Radiometer OSM3; Radiometer, Copenhagen, Denmark and AVL OMNI6; AVL, Graz, Austria). The mean pre-test and post-test values are reported in this study.
Whole body plethysmography
Intra-thoracic gas volume was measured near functional residual capacity with a barometric whole body plethysmograph (CompactLab; Jaeger, Wuerzburg, Germany) during low frequency panting (typically 1 Hz), then, while still connected to the pneumotachograph, the subject inspired to TLC then expired to RV, allowing measurement of these volumes.
Transfer factor
Subjects stayed seated, at rest for 5 min before the TL,CO,sb measurement began, with a 5‐min break between trials. To minimise the number of repetitions, the procedure was carefully explained to the subjects. For each test gas, TL,CO,sb was calculated as the mean of the first two technically acceptable trials (rapid inspiration to >90% of the VC, rapid expiration immediately following the shutter opening). The 17.5% FI,O2 test gas contained 17.5% oxygen (O2); 0.2786% CO; 9.05% He; and balance nitrogen (N2), whilst the 21% FI,O2 test gas contained 21.05% O2; 0.2823% CO; 9.15% He; and balance N2 (all ±2% relative); gases were supplied by Air Liquid Santé, Paris, France. The 17.5% FI,O2 test gas (which was not the standard gas used in the laboratory) was provided free of charge by the supplier (Air Liquid Santé). All tests were carried out on the same commercial apparatus (MasterLab transfer; Jaeger), with identical settings, including a 9‐s occlusion time (breath-hold time: 9.6–11 s), a 0.75‐L wash-out volume and a 0.75‐L sample volume. These settings were chosen because they are common to the ERS and ATS. Anatomical dead space was calculated as 2.2×body weight (kg), corrections were applied for instrumental dead spaces, carbon dioxide (CO2) and water (H2O) absorption according to the ATS, assuming the alveolar fraction of carbon dioxide (FA,CO2) to be 0.05. The CO (infra-red) and He (thermal conductivity) analysers were calibrated with air and the corresponding inspired gas before each set of trials, to minimise the effect of varying oxygen concentration on the He analyser 4. Subjects were instructed to relax against the shutter during the apnoea.
TL,CO,sb corrected for HbCO, according to the ATS, with HbCO‐adjusted TL,CO,sb calculated as follows, assuming a linear increase during successive tests:  This assumption appeared reasonable, the mean calculated increase in HbCO per test (0.62±0.09%, absolute value, mean±sd) being similar whether the subject performed four, five or six tests. Corrections were applied to all tests, including the first one, because the ATS does not recommend an adjustment for the sole increase in HbCO above the baseline value. No correction was made for Hb.
The single-breath transfer coefficient (KCO,sb) was calculated for each trial as the ratio of TL,CO,sb and the effective alveolar volume (VA,eff) measured during the trial.
Data analysis
Comparisons were made with two-tailed paired t‐tests. Linear regression analysis was used to assess the relationships between TL,CO,sb and RV/TLC ratio 5. All values are given as mean±sd.
Results
Fifty-nine subjects performed the required four TL,CO,sb tests. Seven had to repeat one test owing to a technical error and only one subject had to repeat two tests. Additional trials were performed in some subjects to meet the ERS reproducibility criteria for TL,CO,sb. The results of these trials are not reported. However, the total number of tests was used for the calculation of the HbCO correction, as the final blood sampling was taken at the end of the session. There was no difference in TL,CO,sb between the first and the second trial for either test gas after correction for HbCO (21% FI,O2: second trial/first trial ratio: 100.2±3.9%, not different from 100%; 17.5% FI,O2: second trial/first trial ratio: 100.3±3.9%, not different from 100%). TL,CO,sb and KCO,sb measured with the 21% FI,O2 test gas were significantly lower than when measured with the 17.5% FI,O2. The intra-individual coefficients of variation (CV) for TL,CO,sb and KCO,sb (first and second measurement) were similar for both gases, as was VA,eff (table 1⇓). The inter-individual CV for TL,CO,sb was almost identical for both test gases (21% FI,O2: CV=22.5%; 17.5% FI,O2: CV=22.4 %).
Results of parameters measured using two different test gases, 17.5% inspired oxygen fraction (FI,O2) compared with 21% FI,O2
The slopes of the regression lines of the TL,CO,sb versus RV/TLC ratio were nearly identical for both test gases and not significantly different from 0 (fig. 1⇓), even when TL,CO,sb was expressed in absolute (21% FI,O2: p=0.54; 17.5% FI,O2: p=0.48) or as a percentage of the ERS predicted value. The ratio of TL,CO,sb measured with the 17.5% FI,O2 test gas on TL,CO,sb measured with the 21% FI,O2 test gas would, therefore, appear to be quite independent of the RV/TLC ratio in healthy subjects (fig. 2⇓): the slope of the regression line was not different from 0 (p=0.97).

Single breath transfer factor of the lung for carbon monoxide (TL,CO,sb) versus residual volume/total lung capacity (RV/TLC) ratio measured with plethysmography. The lines show regression and 95% confidence intervals for 21% inspired oxygen fraction (FI,O2) test gas: ○---; and 17.5% FI,O2 test gas: •___. Regression lines: TL,CO,sb at 17.5% FI,O2=−0.046×RV/TLC+12.98; TL,CO,sb at 21% FI,O2=−0.038×RV/TLC+12.21.
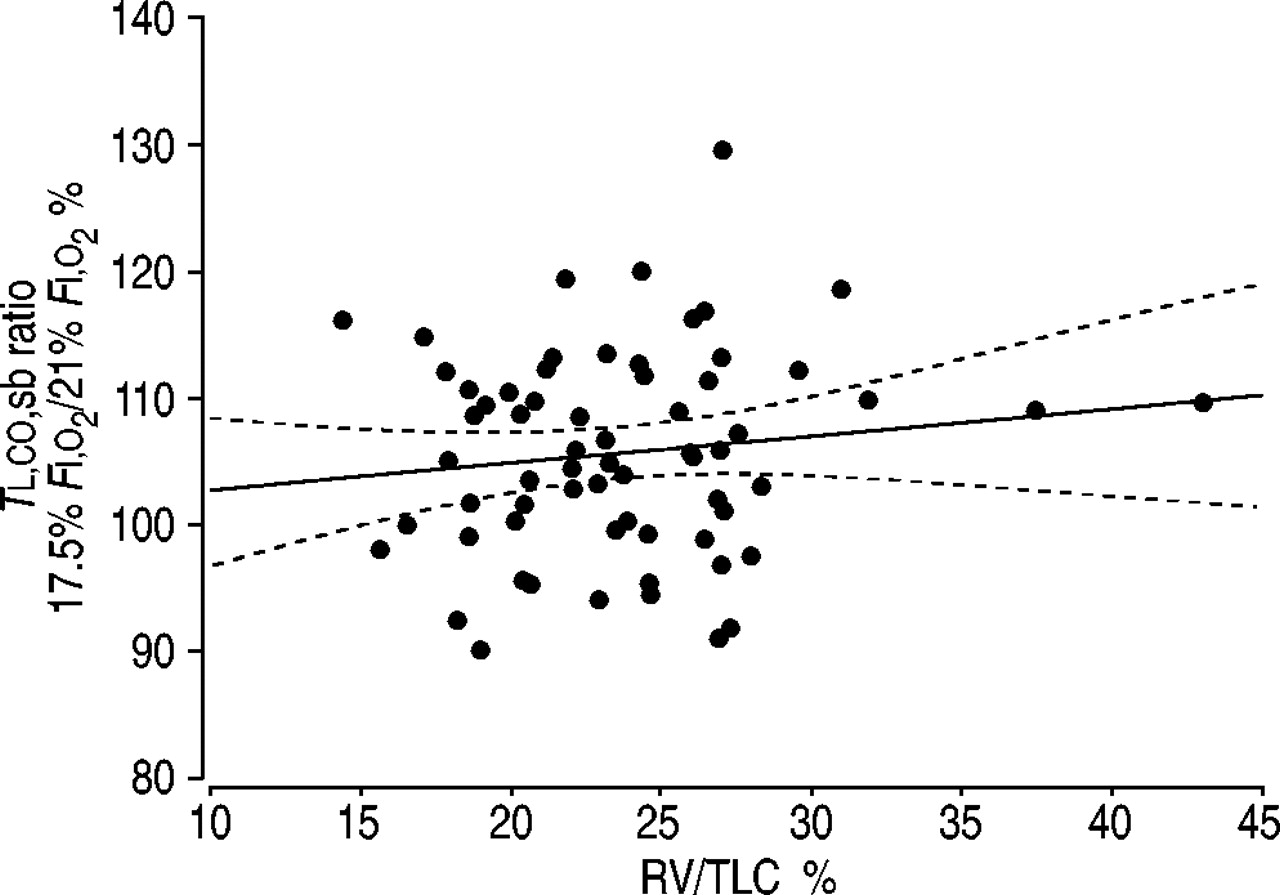
Individual ratio of single breath transfer factor of the lung for carbon monoxide (TL,CO,sb) measured with the 17.5% inspired oxygen fraction (FI,O2) test gas measured with the 21% FI,O2 test gas versus residual volume/total lung capacity (RV/TLC) ratio measured with plethysmography. ═: 95% confidence interval. Regression line: TL,CO,sb at 17.5% FI,O2/21% FI,O2 (%)=−0.006×RV/TLC (%)+105.73.
Discussion
The results show that, TL,CO,sb is higher when measured with a 17.5% FI,O2 test gas than with a 21% FI,O2 test gas. The intra-individual CV for TL,CO,sb and KCO,sb are very close to those previously published 6 and there is no difference between the two test gases. The difference between the two measurements (5.2±7.5% of the mean or 1.53±2.20% per kPa inspired oxygen pressure (PI,O2) appears slightly lower than data previously reported by Gray et al. 7 who found a value of 2.25% per kPa PI,O2. However, in that study by Gray et al. 7 the calculated range of PI,O2 (obtained from subjects breathing a 21% FI,O2 test gas at sea level or in a decompression chamber) was higher (19.5–13.3 kPa) than in the present study (20–16.7 kPa), and there is no evidence that the relationship between TL,CO,sb and PI,O2 is linear. Furthermore, decompression might affect TL,CO,sb independently of PI,O2. In addition, Gray et al. 7 did not correct TL,CO,sb for HbCO. Data collected at sea level by Kreuzer and Van Lookeren Campagne 8 were used to calculate a value of 1.42% per kPa PI,O2, which is very close to the result presented in the current study. PA,O2 at the beginning of the apnoea can be calculated assuming a fixed value for PA,O2 (e.g. 14 kPa) before inhalation and taking into account the individual inspiratory and residual volumes measured during the test; in this case, the increase in TL,CO,sb (expressed as a percentage of the mean) corresponding to the decrease in the calculated PA,O2 is 2.1±3.0 per kPa PA,O2, which is very close to the 1.95% per kPa PA,O2 predicted by Ogilvie et al. 9 for the corresponding variation in PA,O2.
TL,CO,sb was 107.8±15.6% of the ERS predicted value with the 17.5% FI,O2 test gas, whilst the corresponding figure with the 21% FI,O2 test gas was 103.1±14.9%. The reference values for TL,CO,sb in young persons aged 17–23 yrs have been poorly documented and presumably not adequately represented by the ERS data set, at least in females 10. Therefore, it is not surprising that the data in the present study came closer to the ERS predicted values under ATS conditions, than under ERS conditions.
Kanner and Crapo 11 showed that PA,O2, measured in the alveolar sample from a single-breath trial conducted with a 25% FI,O2 test gas at an altitude of 1,520 m, was inversely correlated with the RV/TLC ratio measured during the test. Kanner and Crapo 11 expected that the use of a test gas with a PI,O2 closer to the resident PA,O2 would reduce inter-individual variability because of the differences in the RV/TLC ratio among normal subjects. A subsequent report 6 failed to confirm this hypothesis. The data in the current study, obtained under ERS and ATS conditions from a larger group of subjects, does not support this hypothesis either, because the inter-individual CV for TL,CO,sb is almost identical for both test gases.
The main result of the present study is that the RV/TLC ratio does not affect TL,CO,sb differently, whether the ERS or ATS recommendation for FI,O2 (17.5 and 21% respectively) is followed, i.e. the ratio of TL,CO,sb measured with the 17.5% FI,O2 test gas on TL,CO,sb measured with the 21% FI,O2 test gas is not affected by the RV/TLC ratio.
If the primary measurements are considered, TL,CO,sb is the product of KCO,sb and VA,eff. Therefore, TL,CO,sb is not independent of VA,eff and thus not independent of RV/VA,eff. The measurement of RV/TLC using a different technique guarantees that the correlation deals with independent variables. However, using the RV/VA,eff ratio measured with He dilution during the single-breath manoeuvre leads to similar conclusions. Furthermore, the decrease in TL,CO,sb as the RV/TLC ratio increased was not significant with either the 21% FI,O2 or the 17.5% FI,O2 test gas, and regardless of whether the data were expressed in absolute or as a percentage of the ERS predicted value.
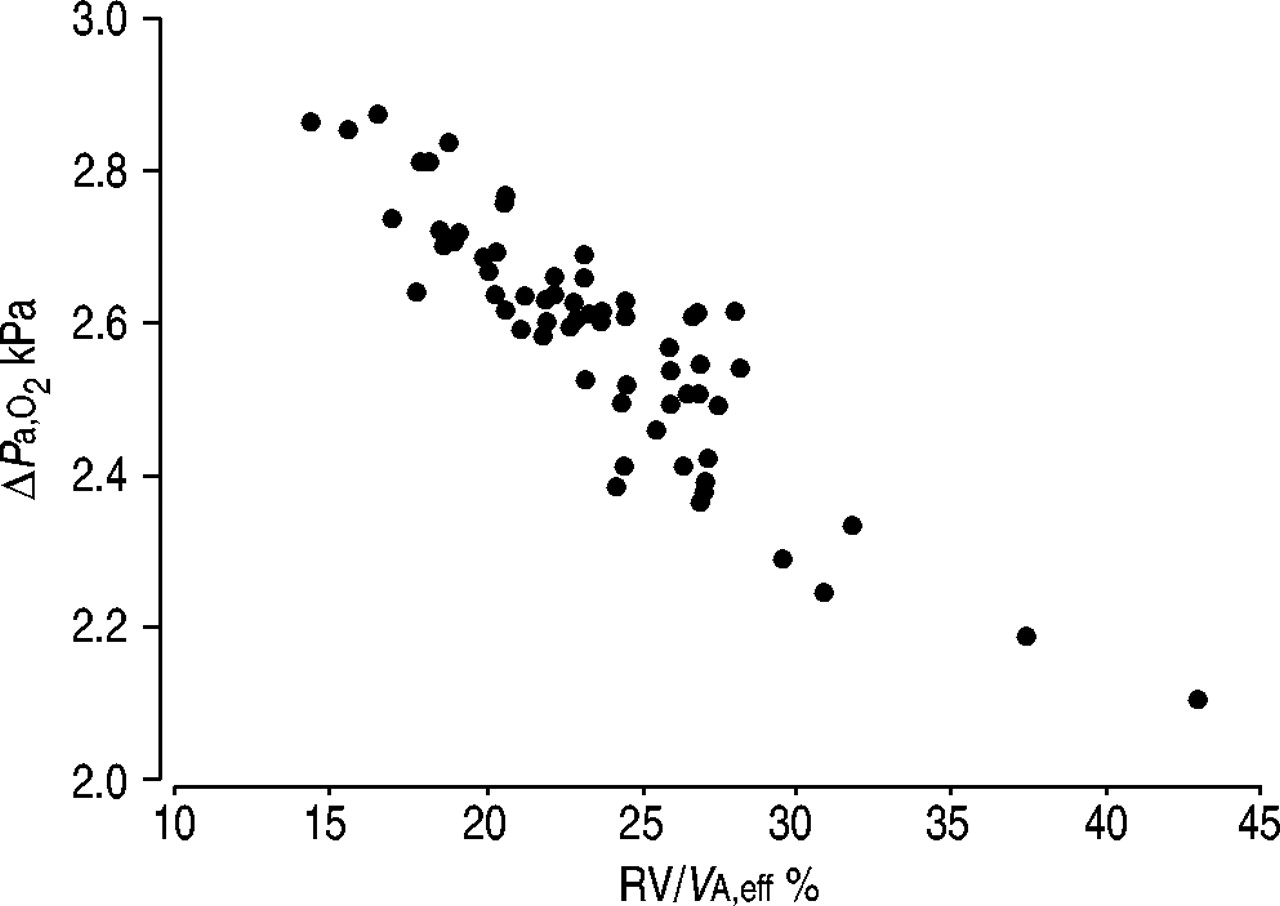
One may question the relatively small span of the RV/TLC ratio and whether it was sufficient to detect a significant effect of RV/TLC ratio, when TL,CO,sb itself has large variability. Using a mass balance approach to total O2 in the lung immediately after inhalation of the test gas, and the RV/VA,eff ratio was measured in each test, it was then possible to calculate the difference in PA',O2 (PA,O2 immediately after inhalation of the test gas) in each subject between inhalation of 21 or 17.5% FI,O2 test gas, assuming a fixed value for PA,O2 before inhalation (e.g. 14 kPa). Such a calculation shows that the difference in PA',O2 would run from 2.1 kPa at the highest RV/TLC ratios to 2.9 kPa at the lowest (fig. 3⇓). Based on a 2.1% change in TL,CO,sb per kPa PA,O2, this span in PA,O2 would produce a maximum change in TL,CO,sb of 1.7% that would probably be difficult to detect, considering the intra-individual CV of TL,CO,sb. It is possible that using a fixed volume of dead-space washout results in the contamination of the alveolar sample in a certain number of subjects 12, 13 and thus adds noise to the data, reducing the chance of finding differences. However, determining the correct washout volume requires using a continuous analysis of the expired gas, which is not the standardised technique. Furthermore, using a continuous analysis and excluding the dead space visually in a group of 62 respiratory patients (most of them with abnormal lung function), Huang and Macintyre 12 showed a small but nonsignificant (p=0.09) decrease in the proportion of nonreproducible measurements 12. Huang and Macintyre 12 also showed that the average percentage difference between two consecutive tests tended to be smaller when the washout volume was visually excluded (p=0.13), but this decrease was more prominent in patients with obstruction or restriction. To increase the power of the present study, either the span of RV/TLC ratio or the number of subjects could be increased. However, increasing the span would require pathological subjects with a much higher variability in TL,CO,sb to be included. Increasing the number of subjects might make it any more effective. Indeed, the results show that, with both test gases, TL,CO,sb decreases with increasing RV/TLC ratio. If the dilution effect was of substantial importance, a positive correlation between TL,CO,sb and the RV/TLC ratio should be observed, at least when measuring using the 21% FI,O2 gas, because an increase in the RV/TLC ratio decreases PA,O2.

Difference in calculated alveolar oxygen tension (PA',O2) immediately after inhalation of the test gas, according to the inspired oxygen fraction (FI,O2) of the test gas as a function of the mean residual volume/effective alveolar volume (RV/VAeff) ratio. PA',O2 was calculated for each test and each subject with the corresponding inspiratory and residual volume measured during the test, assuming that pre-test PA',O2 was 14 kPa.
Using an FI,O2 test gas closer to the pre-test FA,O2 was expected to reduce the effect of dilution of the test gas in the RV. This was also the rationale put forward by the ERS recommending the use of a test gas with 17–18% FI,O2 rather than 21% FI,O2. The presented data indicate that the ERS and ATS conditions in respect of the FI,O2 test gas affect the relationship between TL,CO,sb and RV/TLC ratio in exactly the same way and, therefore, the ERS rationale is not compulsory. This may be because the RV/TLC ratio makes little contribution to the intersubject variability of TL,CO,sb in this healthy population. This is confirmed by the low (and very similar) coefficients of regression of TL,CO,sb versus RV/TLC ratio with both test gases.
The results do not suggest that one recommendation is more justified over the other. However, it may help to choose the same recommendation for both societies, using considerations other than the dilution effect, e.g. methane can be used as a tracer gas instead of He. As the concentration needed is very low, the inspired gas can be made from air, reducing the cost of making a 21% FI,O2 test gas. It might also be of interest to appraise the prediction equations, taking into account the FI,O2 of the test gas. Data cannot be extrapolated to patients with pulmonary diseases, especially those with airway diseases and large RV. However, it might be difficult to demonstrate this dilution effect in a pathological population, e.g. with chronic obstructive pulmonary disease, as an increase in the RV/TLC ratio is usually associated with a decrease in TL,CO,sb.
In conclusion, the presented data indicate that, in a healthy population of young adults, the single-breath transfer factor of the lung for carbon monoxide measured, under the European Respiratory Society conditions in respect of the inspired fraction of oxygen test gas, is 5.2% higher than under the American Thoracic Society conditions. Since the ratio of the single-breath transfer factor of the lung for carbon monoxide measured with the 17.5% inspired fraction of oxygen test gas on the single-breath transfer factor of the lung for carbon monoxide measured with the 21% inspired fraction of oxygen test gas did not vary with residual volume/total lung capacity, the European Respiratory Society rationale for using a 17–18% inspired fraction of oxygen test gas for the single-breath transfer factor of the lung for carbon monoxide measurements appears to be unwarranted in young healthy adults.
Acknowledgments
The authors would like to thank the students involved in this study for their cheerful cooperation and are also indebted to the technical staff of the Service des Explorations Fonctionnelles for outstanding support. The authors are most grateful to P. Denise for helpful comments. The authors also gratefully acknowledge the work of J. Lee in correcting the English text.
- Received July 31, 2003.
- Accepted January 20, 2004.
- © ERS Journals Ltd
References


