


Figures
- Fig. 1.—
Plexiform lesion with strong, mainly lymphocytic (arrows) inflammatory infiltrate in a lung sample of a patient with severe primary pulmonary hypertension.
- Fig. 2.—
a–d) Expression and function of CX3CR1 by T‐lymphocytes from pulmonary arterial hypertension (PAH) patients. Expression of CX3CR1 was analysed by flow cytometry in memory (CD45RO+) (a and c) and naive (CD45RO-) (b and d) CD4+ and CD8+ T‐lymphocytes. Results are expressed as the proportion of labelled cells for each healthy control (n=7, ▵) and PAH patient (n=7, •). *: p<0.05; # : p<0.005. e–h) In the same individuals the function of CX3CR1 was tested by monitoring actin polymerisation (•: PAH patients, n=7; ▵: healthy controls, n=7). Results show the kinetics of actin polymerisation following fractalkine addition, with time. Baseline level, before fractalkine addition, are represented as 100%. *: p<0.05. Error bars show sem. Horizontal lines show median values. Figure modified from 17.
- Fig. 3.—
Fractalkine protein detected by immunohistochemistry in the endothelium of small muscular pulmonary arteries (lung sample taken at the time of lung transplantation in a patient suffering from severe pulmonary arterial hypertension), endothelial proliferation with obstruction of the vessel and strong endothelial staining. Figure modified from 27.
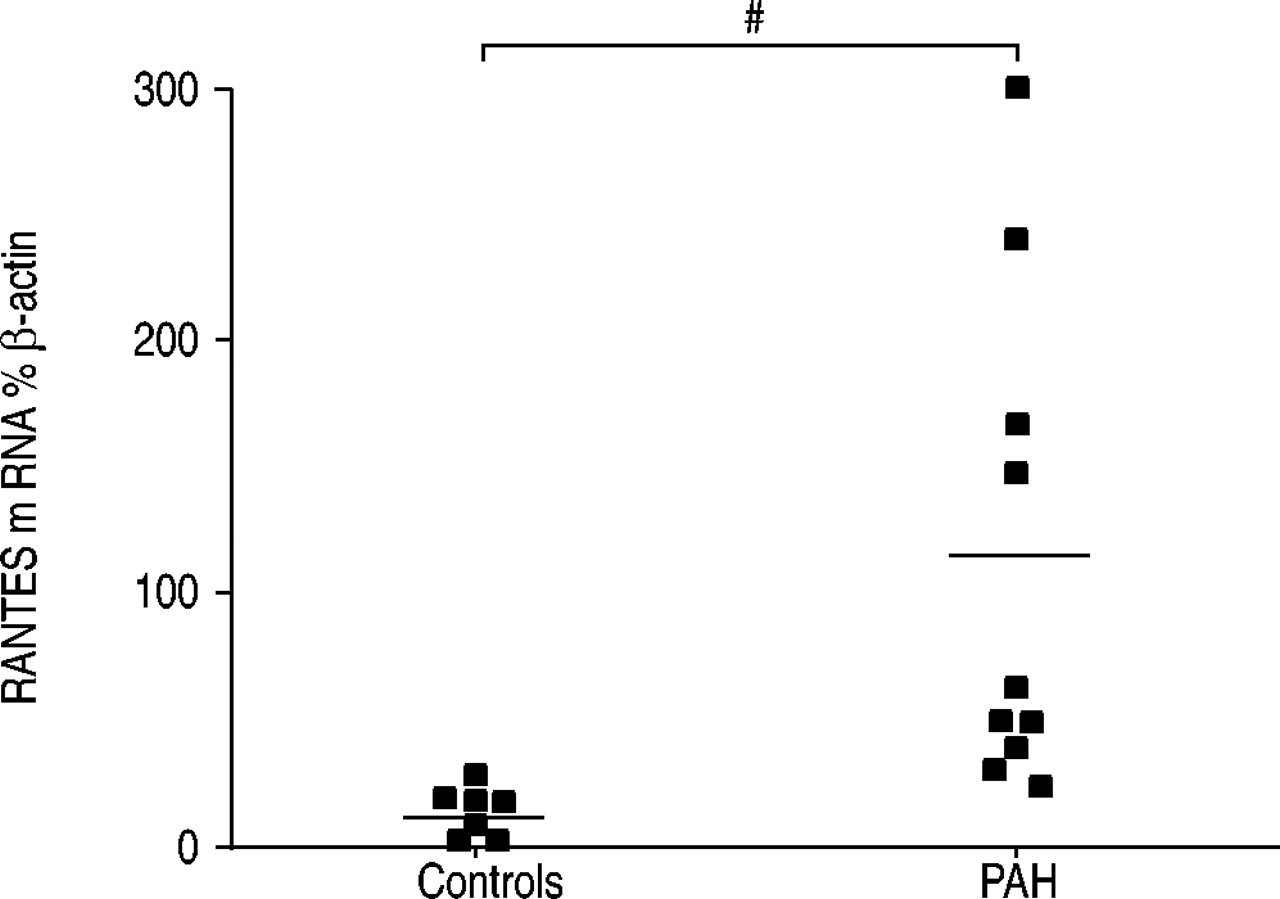
- Fig. 4.—
Regulated upon activation, normal T‐cell expressed and secreted (RANTES) messenger ribonucleic acid (mRNA) expression detected by competitive reverse transcriptase-polymerase chain reaction in lung samples from patients suffering from severe pulmonary arterial hypertension (PAH) and controls. #: p=0.017. Horizontal lines show mean values. Figure modified from 27.
- Fig. 5.—
Regulated upon activation, normal T‐cell expressed and secreted (RANTES) messenger ribonucleic acid expression detected by in situ hybridisation in the endothelium of small muscular pulmonary arteries, and to a lesser extent in perivasular cells (lung sample taken at the time of lung transplantation in a patient suffering from severe pulmonary arterial hypertension), plexiform lesion with endothelial and perivascular staining. Figure modified from 27.


Tables
- Table 1
Plasma concentrations of soluble markers in patients with pulmonary arterial hypertension (PAH) and controls
Molecules PAH Controls p‐values Subjects n 29 26 sCD25 µg·mL−1 2.8±0.3 1.9±0.2 0.025 sP-sel µg·mL−1 66.6±5.4 52.2±4.3 0.04 sE-sel ng·mL−1 79.5±6.9 37.3±3.6 0.0001 sICAM-1 ng·mL−1 370.8±27.3 212.6±11.9 0.0001 sVCAM-1 µg·mL−1 2.5±0.1 1.3±0.1 0.0001 sIL‐6 pg·mL−1 13.8±6.0 3.7±1.3 0.0001 vWF U·dL−1 165.6±14.5 100.2±7.4 0.0005 -
Data are presented as mean±se unless otherwise stated
-
sCD25: soluble CD25
-
sP-sel: soluble P‐selectin
-
sE-sel: soluble E‐selectin
-
sICAM‐1: soluble ICAM‐1
-
sVCAM‐1: soluble VCAM‐1
-
sIL‐6: soluble interleukin‐6
-
vWF: von Willebrand Factor
-
Table modified from 17
-


