


Abstract
Recently, it was shown that both mean lung density (MLD) and the relative lung area with an attenuation of <-950 HU (RA950) are related to severity of asthma in nonsmoking asthmatics. The aim of the present study was to examine whether reduced computed tomography (CT) lung density during exacerbation could change after treatment.
A cross-sectional study was performed to compare CT lung density in 30 stable asthmatics, 30 unstable asthmatics and 25 control subjects. In order to investigate longitudinally the effect of treatment on decreased CT lung density, 17 asthmatics with an exacerbation were followed at the initiation of treatment and 2 months after relief.
The MLD was significantly lower and the RA950 significantly higher in unstable asthmatics than in controls and stable asthmatics. Both MLD and RA950 changed significantly with administration of systemic glucocorticoid therapy. The changes in forced expiratory volume in one second correlated significantly with those in both MLD and RA950. The changes in residual volume also correlated significantly with those in both MLD and RA950.
It was concluded that decreased computed tomographic lung density during an asthma exacerbation is at least partially reversible, and changes in mean lung density and the relative lung area with a radiation attenuation of <−950 HU are related to the change in forced expiratory volume in one second and residual volume.
Asthma is a chronic inflammatory disease characterised by airflow limitation that reverses spontaneously or in response to treatment 1. This inflammatory process leads to abnormalities of the airway, including an increase in muscle mass 2, mucous gland hypertrophy 3 and reorganisation of the extracellular matrix 4. Frequent airway and lung parenchymal changes associated with asthma are considered to be responsible for the irreversibility of the airway obstruction observed in many severe asthmatics. Features of airway reconstruction, such as bronchial wall thickening, bronchiectasis, emphysema and mosaic patterns of lung attenuation, have been observed using high-resolution computed tomography (HRCT) in patients with asthma 5–7.
Low attenuation areas (LAAs) assessed via a quantitative method using digital data from computed tomography (CT) scans in vivo have been shown to represent macroscopic and/or microscopic emphysematous changes in the lungs of patients with chronic obstructive pulmonary disease (COPD) 8–15. CT lung densitometry has been studied in nonsmoking asthmatic patients 16–18. Newman et al. 16 suggested that the percentage of pixels of <−900 HU at full expiration reflects air trapping in asthmatic patients and correlates with pulmonary function. Gevenois et al. 17 showed that acute expiratory airflow limitation and chronic hyperinflation did not influence mean lung density (MLD) and the relative lung area with an attenuation of <−950 HU (RA950) in nonsmoking asthmatic patients. Biernacki et al. 18 observed that some patients with chronic stable asthma develop a reduction in CT lung density and that acute or chronic overinflation did not affect the lowest fifth percentile MLD. The presence and significance of decreased attenuation as assessed by CT scan thus remains to be clarified in nonsmoking asthmatics.
Recently, it was shown that both MLD and RA950 are related to airflow limitation and lung volume, but not to lung diffusing capacity, and that these values correlate with the patient's age and severity of asthma in nonsmoking asthmatics 19. The present study examined differences in CT lung density between unstable asthmatics and control subjects or stable asthmatics, and whether changes occurred during exacerbation after treatment with systemic followed by inhaled glucocorticoids.
Methods
Subjects
All subjects were recruited at the Misasa Medical Centre, Okayama University Medical School, Tottori, Japan. Asthma was diagnosed according to the definition proposed by the American Thoracic Society 21. All subjects with asthma had episodic symptoms of wheezing and coughing, and experienced symptomatic relief and a reversible airway response with an accompanying increase in forced expiratory volume in one second (FEV1) of >15% on treatment with β2‐adrenergic agonists. None of the asthmatics had a history of clinically demonstrable tuberculosis or allergic bronchopulmonary aspergillosis as defined by the criteria of Rosenberg et al. 22. The onset and duration of asthma were established through review of the patient's history followed by a careful examination. Allergy was diagnosed based on clinical history, skin tests and the presence of serum immunoglobulin (Ig)E specific to 12 common inhalant allergens. Serum specific IgE levels were measured using the Pharmacia CAP System (Pharmacia Diagnostics AB, Uppsala, Sweden). Atopic patients were defined as those showing a positive skin test and/or IgE specific to common inhalant allergens. All other patients were classified as nonatopic.
Thirty clinically stable asthmatics (mean±sd age 59.4±7.4 yrs, range 40–72 yrs), 30 unstable asthmatics (62.5±8.3 yrs, 38–76 yrs) and 25 control subjects (65.2±11.2 yrs, 40–81 yrs) were studied in a cross-sectional fashion. None of the clinically stable asthmatics had undergone changes in asthma symptoms or medication for ≥2 months. These patients were regularly treated and controlled with inhaled glucocorticoids (beclomethsone dipropionate 200–800 µg) and short-acting inhaled β2‐agonist on demand, and were categorised as having mild-to-moderate persistent asthma according to the Guidelines for the Diagnosis and Management of Asthma 23. None had a history of upper respiratory tract infection within the previous 2 months. Unstable asthmatics were considered severe enough to require prophylactic treatment for disease control. Of the 30 unstable asthmatics, some had not been treated previously for asthma, whereas others were already receiving medication for asthma and were being followed at Misasa Medical Centre. Twenty-five control subjects were randomly selected from those voluntarily visiting Misasa Medical Centre for medical examination due to lung cancer. They showed no historical or clinical evidence of allergic, respiratory or cardiovascular disease and exhibited normal chest radiography and spirometry, lung volume and diffusing capacity of the lungs for carbon monoxide (DL,CO) results.
In order to investigate longitudinally the effect of treatment on decreased CT lung density, 17 symptomatic asthmatics, who were part of the cross-sectional study with an asthmatic exacerbation that was considered sufficiently severe to require systemic glucocorticoids for disease control, were followed at the initiation of treatment and 2 months after relief. All achieved relief with systemic glucocorticoids and were considered to be clinically stable during treatment with inhaled β2‐agonist and inhaled steroids (beclomethsone dipropionate 800–1,600 µg), and/or oral glucocorticoids for 2 months. An asthma exacerbation was defined as an abrupt and/or progressive worsening of shortness of breath, wheezing and chest tightness, or a combination thereof, and/or a reduction in peak expiratory flow (PEF) to <70% of their personal best PEF obtained during a clinically controlled period.
Symptomatic asthmatics were excluded from the cross-sectional and longitudinal studies according to the following exclusion criteria: inability to maintain full inspiration to yield lung function and CT measurements, decreased levels of consciousness, cyanosis, complications (e.g. pneumonia, pneumothorax or pneumomediastinum), and arterial oxygen tension (Pa,O2) of <8.0 kPa (60 mmHg) or arterial carbon dioxide tension of ≥5.6 kPa (42 mmHg). Eight patients were excluded from cross-sectional study and six from longitudinal study.
All subjects were lifelong nonsmokers. Lung function measurements and CT scans were performed on the same day, after bronchodilator use. The study protocol was approved by the ethics committee of Misasa Medical Centre, and written informed consent was obtained from all subjects.
Pulmonary function tests
Pulmonary function tests were performed by means of a CHESTAC 33 (Chest Co., Tokyo, Japan). For all subjects, the following measurements were performed using the forced vital capacity (FVC) manoeuvre: FEV1, FVC, FEV1/FVC, and forced mid-expiratory flow (FEF25–75). Total lung capacity (TLC), functional residual capacity (FRC), residual volume (RV) and RV/TLC were measured using the helium-dilution method. The DL,CO and DL,CO/alveolar volume (VA) were measured using the single-breath technique. FVC, FEV1, FEF25–75, TLC, FRC, RV and DL,CO/VA were expressed for each patient as a percentage of their predicted values based on the prediction equations of the Japanese Society of Chest Diseases 24.
Computed tomography
HRCT scans were performed using a Toshiba Xpeed scanner (Toshiba, Tokyo, Japan) with a 2‐mm slice thickness, scanning time of 2.7 s, peak voltage of 120 kVp and current of 200 mA. All subjects were scanned in the supine position after deep inspiration. The images were reconstructed in a 30-cm field of view using a standard algorithm (FC1; Toshiba). No intravenous contrast medium was administered. Three HRCT scans were used for determination of MLD and LAAs. The upper section was obtained at the top of the aortic arch, the middle section at the origin of the lower lobe bronchus and the lower section ∼3 cm above the top of the diaphragm, as described by Miniati et al. 25.
The cut-off point between areas of normal lung density and LAAs was defined as −950 HU, since it was found that −949 HU was 1 sd below the MLD in 15 control subjects who had never smoked. The weighted MLD was calculated from the total cross-sectional area of the six lung hemislices obtained at the three anatomical levels. Similarly, the lung area occupied by voxels with an attenuation of <−950 HU (A950), obtained by summing the A950 in each of the six hemislices, was expressed as a percentage of the total lung cross-sectional area (RA950‐T). HRCT lung densitometry was performed for each subject by means of a dedicated software program from Toshiba.
The presence of emphysema was estimated using the visual scoring method of Goddard et al. 26. Each slice was evaluated individually, and the right and left lungs were graded separately according to the percentage area demonstrating circumscribed low attenuation areas with disruption of normal architecture. Each subject was evaluated independently on two separate occasions by two pulmonologists without knowledge of the clinical data or results of pulmonary function tests.
Statistical analysis
Results are expressed as mean±sd. Comparison of multiple groups was performed using analysis of variance with Bonferroni/Dunn correction. The differences in CT and lung function data at exacerbation and remission were judged using a paired t‐test or Wilcoxon signed-rank test. Correlation between two parameters was examined by linear regression analysis. A p‐value of <0.05 was regarded as significant.
Results
Cross-sectional study
Patient characteristics and lung function data are presented in table 1⇓. There were no significant differences in subjects' age and duration of disease between the two groups of asthmatic patients. FVC % predicted, FEV1 % pred, FEV1/FVC and Pa,O2 were significantly lower in unstable asthmatics than in controls and stable asthmatics. FRC % pred, RV % pred and RV/TLC were significantly higher in unstable asthmatics than in controls and stable asthmatics. No significant differences were observed in DL,CO/VA % pred among the three groups.
Characteristics of controls and asthmatic patients
Weighted MLDs were −873.6±24.2 HU for normal controls, −881.8±20.5 HU for stable asthmatics and −912.3±13.1 HU for unstable asthmatics. There were significant differences between unstable asthmatics and control subjects (p<0.001) and stable asthmatics (p<0.001). Patients with unstable asthma had a significantly higher RA950‐T (23.9±10.5%) than controls (5.8±6.0%, p<0.001) and patients with stable asthma (7.7±5.5%, p<0.001). There were no significant differences between controls and stable asthmatic patients in both weighted MLD and RA950‐T (fig. 1⇓).

a) Weighted mean lung density (MLD) and b) relative lung area with an attenuation of <−950 HU expressed as a percentage of the total lung cross-sectional area (RA950‐T) in control subjects (n=25), unstable asthmatics (n=30) and stable asthmatics (n=30). Horizontal bars represent means. ***: p<0.001.
MLDs and RA950 were compared among three anatomical levels in each group (table 2⇓). In patients with unstable asthma, the MLD was significantly decreased and the RA950 significantly increased at the middle and lower levels compared with the upper level. All subjects studied demonstrated no findings of emphysema on visual assessment (data not shown).
Mean lung density (MLD) and relative lung area with an attenuation of <−950 HU (RA950) at three anatomical levels
Longitudinal study
The baseline characteristics and pulmonary function test results of the 17 patients in the longitudinal study are shown in table 3⇓. The results of CT lung densitometry studies before and after systemic glucocorticoid therapy are illustrated in figure 2⇓. Weighted MLDs were −919.8±10.2 HU during exacerbation, and −910.8±11.2 HU on remission. Systemic glucocorticoid therapy significantly increased the weighted MLD (p<0.001). The RA950‐T during exacerbation (29.9±8.7%) significantly decreased to 22.6±9.5% on remission (p<0.001). FVC, FEV1 and FEV1/ FVC were significantly increased by systemic glucocorticoid therapy. TLC, FRC, RV and RV/TLC were significantly lower on remission than during exacerbation (table 4⇓). The improvement in FEV1 was found to be 0.42±0.15 L, and the decrease in RV 0.40±0.18 L.
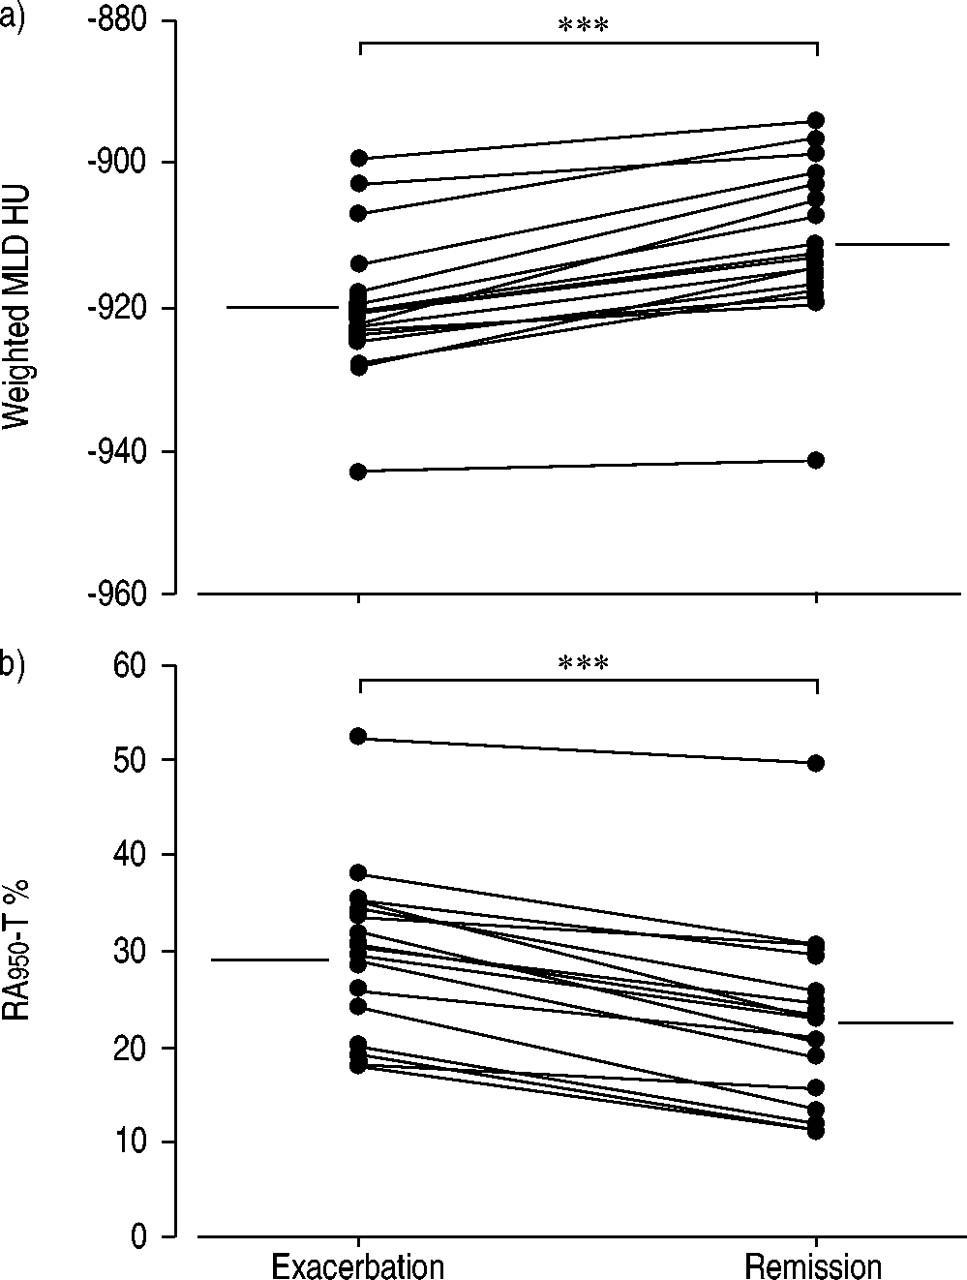
a) Weighted mean lung density (MLD) and b) relative lung area with an attenuation of <−950 HU expressed as a percentage of the total lung cross-sectional area (RA950‐T) in patients during exacerbation and on remission. Horizontal bars represent means. ***: p<0.001.
Characteristics of asthmatic patients in longitudinal study
Pulmonary function parameters at exacerbation and remission
The changes in FEV1 correlated significantly with those in both weighted MLD (r=0.578, p=0.0150) and RA950‐T (r=−0.503, p=0.0394; fig. 3⇓). The changes in RV showed significant correlation with those in both weighted MLD (r=−0.539, p=0.0256) and RA950‐T (r=0.732, p=0.0008; fig. 4⇓).

Relationship between increase in forced expiratory volume in one second (FEV1) and a) increase in weighted mean lung density (MLD; r=0.578, p=0.0150), and b) decrease in relative lung area with an attenuation of <−950 HU expressed as a percentage of the total lung cross-sectional area (RA950‐T; r=−0.503, p=0.0394).

Relationship between decrease in residual volume (RV) and a) increase in weighted mean lung density (MLD; r=−0.539, p=0.0256), and b) decrease in relative lung area with an attenuation of <−950 HU expressed as a percentage of the total lung cross-sectional area (RA950‐T; r=0.732, p=0.0008).
Discussion
In the present study, in order to evaluate the influence of asthma on CT lung density, the MLD and RA950 of unstable asthmatics were compared with those of controls and stable asthmatics. The change in CT lung density in 17 patents with exacerbation of asthma was also examined by means of a longitudinal study. It was found that patients with unstable asthma show greater decreased attenuation of CT lung density than controls and patients with stable asthma. It was also found that the decreased attenuation in patients with an asthma exacerbation could be improved by systemic glucocorticoid therapy.
Increases in the LAAs of patients with COPD have been reported to reflect pathological changes in pulmonary emphysema 8–15. The CT measurement of LAAs correlates well with diffusing capacity, a sensitive index of pulmonary emphysema, and also correlates with measurements of airway obstruction 11–15. Conversely, Heremans et al. 32 found that MLD correlates well with pulmonary function indices of airway obstruction and hyperinflation, but not with indices that are considered more specific for emphysema (DL,CO and static lung compliance) in COPD patients. It is likely that correlation between MLD and pulmonary function measurements has different implications to that between RA950 and pulmonary function measurements.
Three slices (upper, middle and lower lung) from each patient were analysed to minimise the radiation dose, since Mishima et al. 15 observed good linear correlation between the percentage of LAAs of 10 sections from the apex to the bottom of the lung and that of three sections in 72 patients with COPD (r=0.976). During the CT scan, the subjects were asked to hold their breath after a deep inspiration. Gevenois et al. 12 reported that quantitative characterisation of macroscopic and microscopic emphysema from expiratory CT scans is not as accurate as from inspiratory CT. They speculated that abnormalities in the expiratory CT are more reflective of air trapping than of a genuine reduction in terminal airspace volume. Eda et al. 33 found that the helical CT images acquired at full expiration reflect air trapping and that CT visual scores at full inspiration showed significant correlation with emphysema.
The cut-off point between areas of normal lung density and LAAs used was −950 HU. In previous reports, the cut-off point ranged −900–−960 HU. Some investigators used −900 HU 25, whereas others used −910 HU 9, −950 HU 10–12 or −960 HU 14. This discrepancy may be due to differences between computed tomographs with different reconstruction algorithms or between conventional and HRCT scanning. In a preliminary study of 15 healthy controls, using the same high-resolution computed tomograph as in the present study, −949 HU was 1 sd below the MLD.
In order to investigate the influence of exacerbation of asthma on CT lung densitometry, symptomatic asthmatics were enrolled for cross-sectional and longitudinal studies. Patients were selected in accordance with the exclusion criteria described above, and, for ethical reasons, lung function measurements and CT scans were performed after use of bronchodilators. Therefore, in the present study, only symptomatic asthmatics who could maintain full inspiration after using bronchodilators were examined. It was not possible to observe the influence of bronchoconstriction relievable by bronchodilators on CT lung densitometry. However, it was possible to observe the influence of an asthma exacerbation on MLD and RA950.
It was demonstrated previously that some nonsmoking asthmatic patients show decreased attenuation of HRCT lung density that is related to airflow limitation, hyperinflation and ageing, but not to lung diffusing capacity 19. It was also found that MLD and RA950 correlated significantly with the severity of chronic asthma.
In the present cross-sectional study, it was demonstrated that the MLD and RA950 of unstable asthmatics differed significantly from those of controls and stable asthmatics. No circumscribed LAAs with disruption of normal architecture were observed in either stable or unstable asthmatics on visual assessment. The longitudinal study showed that both the MLD and RA950 of patients with an asthma exacerbation were changed significantly by systemic glucocorticoid therapy. The fact that the changes in both MLD and RA950 showed significant correlation with those in FEV1 and RV suggested that the decreased CT lung density may be caused by reversible changes in lung volume following airflow limitation. However, CT lung density continued to be decreased in symptomatic asthmatics in the longitudinal study after treatment compared with controls and stable asthmatics in the cross-sectional study. Further study is necessary to examine whether decreased CT lung density results solely from reversible factors such as airflow limitation and chronic overinflation.
Gevenois et al. 17 failed to find any significant changes in CT lung density parameters with respect to the magnitude of RA950 during allergic challenge tests. This was despite a decrease in FEV1 of 0.9 L, which was accompanied by an increase in RV and FRC of approximately the same volume. The MLD and RA950 of 10 asthmatics with an increased TLC did not differ significantly from those of healthy subjects. They concluded that hyperinflation and airflow obstruction without emphysematous lung destruction does not influence densitometric measurements obtained from inspiratory scans. The present authors considered that the discrepancy between their and the present results might be because the present subjects were older. In agreement with the present results, Biernacki et al. 18 observed that patients with chronic stable asthma, as well as COPD, showed a reduction in CT lung density in comparison with controls. However, in five asthmatic patients, they also found no significant differences in the lowest fifth percentile MLD before and after using a nebulised β2‐agonist as well as at the end of an exacerbation and 6 weeks later. Thus, they concluded that improvement in airflow limitation and chronic overinflation did not affect the lowest fifth percentile MLD. The difference between those and the present findings may arise because their examination at the end of an exacerbation and 6 weeks later included a small number of patients. In contrast, in the present study, 17 patients were examined during exacerbation and on remission.
It is concluded that decreased computed tomographic lung density during an asthma exacerbation is at least partially reversible and that the changes in mean lung density and relative lung area with a radiation attenuation of <−950 HU are related to the change in residual volume. The present authors suggest that the decreased computed tomographic lung density may, to a certain extent, represent chronic overinflation, and high-resolution computed tomographic lung densitometry may be a useful tool in evaluating asthma treatment.
Acknowledgments
The authors would like to thank M. Nakai for technical assistance with computed tomography.
- Received September 3, 2002.
- Accepted February 4, 2003.
- © ERS Journals Ltd
References


