


Abstract
Impaired respiratory muscle endurance (RME) could reduce exercise tolerance and contribute to ventilatory failure. The aim of the present study was to develop a clinically-feasible method to measure RME using negative-pressure inspiratory-threshold loading. It was hypothesized that endurance time (tlim) could be predicted by normalizing oesophageal pressure-time product (PTP) per total breath cycle (PTPoes) for maximum oesophageal pressure (Poes,max); the load/capacity ratio. The corresponding mouth pressures, PTPmouth and Pmouth,max were also measured.
The RME test was performed on 30 healthy subjects exposed to the same target pressure (70% of Poes,max). Eight patients with systemic sclerosis/interstitial lung disease were studied to assess the validity and acceptability of the technique.
Normal subjects showed a wide intersubject variation in tlim (coefficient of variation, 69%), with a linear relationship demonstrated between log tlim and PTPoes/Poes,max (r=0.88). All patients with systemic sclerosis/interstitial lung disease had normal respiratory muscle strength, but six out of eight had a reduction in RME.
In conclusion, endurance time can be predicted from the load/capacity ratio, over a range of breathing strategies; this relationship allows abnormal respiratory muscle endurance to be detected in patients. Oesophageal and mouth pressure showed a close correlation, thus suggesting that the test could be applied noninvasively.
N. Hart was supported by the Dorothy Osbourne Legacy.
Sustained excessive load placed on the respiratory muscle pump may cause ventilatory failure or contribute to dyspnoea 1, 2. Although respiratory muscle strength (RMS) can be readily assessed 3, it is possible that the endurance properties of the muscle may have a greater bearing on the ability of a patient to cope with a prolonged respiratory load. However, reliable tests of respiratory muscle endurance (RME) have proved difficult to establish. The aim of the present study was to develop a clinically-applicable test of RME.
In particular, as constraints on breathing patterns reduce RME 4, the test should avoid preset breathing strategies (e.g. fixed square-wave breathing patterns 5, 6). In the present study, the authors used constant negative pressure threshold loading and hypothesized that variation in endurance time (tlim) could be predicted during the loading task by normalizing the oesophageal pressure time product for maximal negative oesophageal pressure; this relationship was termed the respiratory load/capacity ratio. This paradigm allows subjects to develop their own breathing strategy in response to the applied pressure, while advances in computer technology allow for rapid calculation of the load/capacity ratio. A secondary aim of this study was to determine whether mouth pressure would accurately reflect oesophageal pressure, as has been shown in previous studies 7, 8, and thus provide a noninvasive method to assess RME.
Methods
Subjects
The protocol was approved by the Ethics Committee of the Royal Brompton Hospital, London, UK, and all participants gave their informed consent.
Study 1 included 30 healthy subjects who underwent RME testing to determine the relationship between tlim and the load/capacity ratio. Study 2 included six of the 30 healthy subjects who underwent RME testing on three separate occasions in order to determine the intrasubject variability of the test. Finally, study 3 included eight patients with interstitial lung disease due to systemic sclerosis (SS/ILD) who underwent RME testing to assess the validity and acceptability of the technique; these patients were compared with eight controls.
Apparatus
Negative pressure threshold loading was performed using a low resistance inspiratory threshold loading (ITL) device, modified from that described by Chen et al. 9. The device consisted of a cylindrical adjustable pressure chamber, 41×10 cm, which was connected to a two-way nonrebreathing valve (PK Morgan Ltd, Rainham, Kent, UK). The negative pressure (range, −10–−135 cmH2O) was generated by a vacuum cleaner (Numatic International, Chard, Somerset, UK), and pressure in the chamber was measured using a pressure monitor (Magnehelic, Dwyer Instruments Inc., Michigan City, IN, USA). Expiratory flow was measured with a pneumotachograph head (Fleisch, Lausanne, Switzerland) attached to a tube of dimensions 41×3.5 cm connected to an electrospirometer (GM Instruments Ltd, Kilwinning, UK).
Pressure measurements
An oesophageal balloon catheter (Ackrad Laboratories, Cranford, NJ, USA) was inserted and positioned in the standard manner 10. Oesophageal pressure (Poes) and mouth pressure (Pmouth) were measured using differential pressure transducers (Validyne, Northridge, CA, USA) and amplified by carrier amplifiers (Validyne). All signals were passed to an analog-digital board and Power PC (Apple Computers, Cupertino, CA, USA) running Labview 4.1 software (National Instruments, Austin, TX, USA).
Pressure/time product
Oesophageal pressure-time product (PTP) per total breath cycle (PTPoes) and mouth PTP per total breath cycle (PTPmouth) were calculated from Poes and Pmouth traces for the whole RME test in each subject. The area subtended by the pressure time curve was determined for each breath using a semi-automated modification of Labview 4.1 software. Average PTPoes and average PTPmouth were used as indicators of the load on the respiratory muscles.
Dynamic compliance
Dynamic compliance (CL,dyn) was calculated during resting breathing by dividing tidal volume by the difference in Poes at points of zero flow.
Maximum inspiratory pressure
Before each RME test, all participants performed maximum inspiratory manoeuvres using a mouthpiece attached to a metal tube, which had a small air leak to prevent glottic closure 11. Efforts were repeated from functional residual capacity (FRC) at least 10 times until three reproducible efforts were obtained. Patients and subjects who were unfamiliar with the manoeuvre had a preliminary session for instruction in order to ensure that maximum pressures were achieved. Peak (rather than the 1-s average) negative oesophageal pressure (Poes,max) and peak negative mouth pressure (Pmouth,max) were determined, and these measurements were used as the capacity of the respiratory muscles.
Inspiratory threshold loading protocol
All subjects and patients were exposed to the same relative target negative pressure (70% of Poes,max). No restriction was placed on the pattern of breathing. During the first minute of the test, the threshold pressure was progressively made more subatmospheric from −10 cmH2O to 70% of Poes,max. Subjects had to generate a pressure at the mouth, slightly greater than the chamber pressure, to open the valve in order to initiate and sustain inspiratory flow. The ITL device provided a constant inspiratory pressure when the valve was open 9. All the subjects underwent 2–5 practice endurance runs, up to 70% Poes,max, to become accustomed to the apparatus and the sensation of dyspnoea. It was important for all subjects to familiarize themselves with the equipment and start with low workloads to ensure that the best strategy for handling higher loads was chosen 12.tlim was defined as the period from when the negative pressure imposed reached 70% of Poes,max to task failure (i.e. the incremental loading minute was excluded). Task failure was defined as the inability to generate the target pressure and open the valve. Strong verbal encouragement was given throughout the RME test, and subjects and patients were instructed to stop and come off the mouthpiece when they could no longer open the valve. All subjects continued to exhaustion or until the sensation of dyspnoea was too uncomfortable to tolerate.
Statistical analysis
Due to the curvilinear relationship between tlim and the load/capacity ratio, a single-segment logarithmic conversion of tlim was performed to produce a linear model to describe the relationship between tlim and PTPoes/Poes,max. Furthermore, this variance-stabilizing transformation of the data permitted the definition of 95% confidence bands as well as the establishment of RME values in healthy subjects.
Linear regression analysis was used to determine the relationships between log tlim and PTPoes/Poes,max; PTPoes and the duty cycle (duration of inspiration/duration of total breathing cycle (tI/ttot)); log tlim and tI/ttot; and log tlim and PTPmouth/Pmouth,max. The relationship between Poes and Pmouth data was assessed using a Bland and Altman plot 13. An analysis of variance (ANOVA) test for repeated measures was used to evaluate differences between three consecutive RME tests. Differences between controls and patients with SS/ILD were made with an unpaired t-test. A value of p<0.05 was considered statistically significant. Data are presented as mean±sd.
Results
Healthy subjects and patients performed and tolerated the RME test well. There were no adverse events.
Study 1: healthy subjects
Thirty subjects (20 males) were studied with a mean±SD age of 38±10 yrs (range 26–65 yrs). Fifteen of these subjects were naïve to the study.
Baseline static inspiratory pressures
Poes,max and Pmouth,max before testing were 126±23 cmH2O and 125±22 cmH2O, respectively.
Endurance time
Intersubject variability in tlim was wide, with mean tlim of 370±255 s (coefficient of variation, 69%).
Relationship between endurance time and respiratory load/capacity ratio
The tlim showed a curvilinear relationship with PTPoes/Poes,max (fig. 1a⇓). A linear relationship was demonstrated between log tlim and PTPoes/Poes,max (r=0.88, p<0.0001; fig. 1b⇓).

a) “Best-fit” plot of the curvilinear relationship between endurance time (tlim) and oesophageal load/capacity ratio (oesophageal pressure-time product per total breath cycle (PTPoes)/maximum negative oesophageal pressure (Poes,max)) in normal subjects (n=30). b) Regression analysis with the 95% confidence bands of the linear relationship between log tlim and PTPoes/Poes,max in normal subjects (n=30; r=0.88, p<0.0001).
Breathing strategy
There was a linear relationship between PTPoes/Poes,max and tI/ttot (fig. 2a⇓; r=0.87, p<0.0001) and also between log tlim and tI/ttot (fig. 2b⇓; r=0.77, p<0.0001).

a) Regression analysis of the linear relationship between duty cycle (duration of inspiration/duration of total breathing cycle (tI/ttot)) and oesophageal load/capacity ratio (oesophageal pressure-time product per total breath cycle (PTPoes)/maximum negative oesophageal pressure (Poes,max)) in normal subjects (n=30; r=0.87, p<0.0001). b) Regression analysis of the linear relationship between the log endurance time (log tlim) and duty cycle (tI/ttot) in normal subjects (n=30; r=0.77, p<0.0001).
Comparison of oesophageal and mouth load/capacity ratio
Bland and Altman plot 13 demonstrated agreement between PTPoes/Poes,max and PTPmouth/Pmouth,max (fig. 3a⇓). The r-value for the linear relationship between log tlim and PTPmouth/Pmouth,max was 0.82 (p⩽0.0001; fig. 3b⇓).
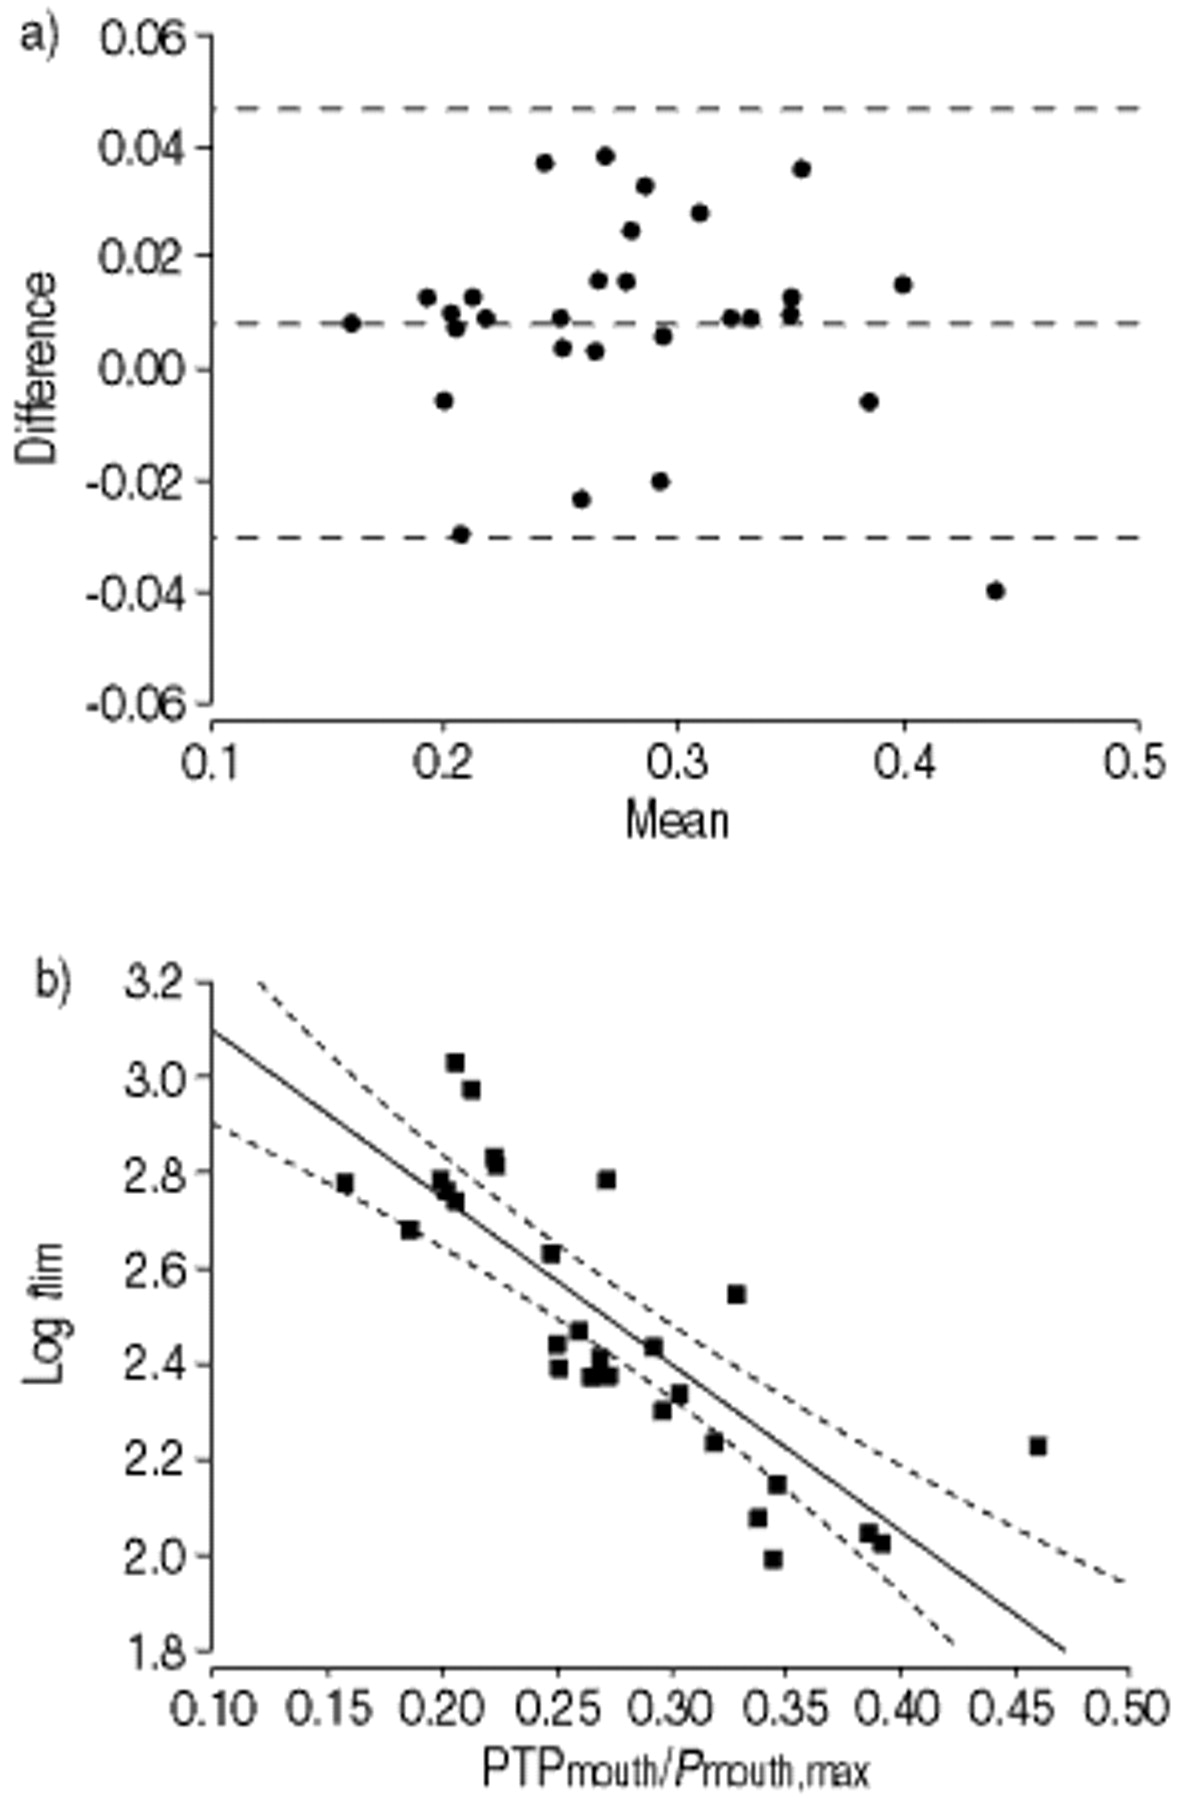
a) Bland and Altman plot 13 of the difference in oesophageal pressure-time product per total breath cycle (PTPoes)/maximum negative oesophageal pressure (Poes,max) and mouth pressure-time product per total breath cycle (PTPmouth)/maximum negative mouth pressure (Pmouth,max) against the mean of PTPoes/Poes,max and PTPmouth/Pmouth,max in normal subjects (n=29). b) Regression analysis with 95% confidence bands of the linear relationship between log endurance time (log tlim) and mouth load/capacity ratio (PTPmouth/Pmouth,max) in normal subjects (n=29; r=0.82, p<0.0001).
Study 2: reproducibility in healthy subjects
Six subjects (four male) were studied on three separate occasions. Mean time between each test was 78±82 days.
Baseline static respiratory pressures
Mean Poes,max for the group before each RME test was 118±25, 122±22 and 123±21 cmH2O, respectively (p=0.2).
Endurance time
Intrasubject variability in tlim was wide, with mean tlim of 236±79 s, 321±195 s and 416±248 s for the first, second and third RME test, respectively. There was a trend for tlim to increase, but no difference was demonstrated between RME tests (p=0.2); subjects 1 and 2 had a reduction in tlim from baseline, whereas subjects 3–6 had progressive increases in tlim. (table 1⇓).
Endurance time (tlim), maximum negative oesophageal pressure (Poes,max) and oesophageal load/capacity ratio for six healthy subjects who performed three consecutive respiratory muscle endurance (RME) tests
Relationship between endurance time and respiratory load/capacity ratio
Log tlim was plotted against PTPoes/Poes,max for three RME tests in each subject. These serial data were compared to log tlim and PTPoes/Poes,max data obtained from the 30 healthy subjects (fig. 4⇓). Although the results of tlim and PTPoes/Poes,max for each subject changed between each successive test (table 1⇑), figure 4⇓ shows that log tlim and PTPoes/Poes,max data remain within, or close to, the normal values determined by study 1.

Plot of log endurance time (log tlim) and oesophageal load/capacity ratio (oesophageal pressure-time product per total breath cycle (PTPoes)/maximum negative oesophageal pressure (Poes,max)) for three separate respiratory muscle endurance (RME) runs in six normal subjects. The arrows indicate 1st (#), 2nd (¶) and 3rd (+) RME test. The shaded area represents the simple regression analysis with 95% confidence bands from figure 1b⇑. □: subject 1; ▴: subject 2; ○: subject 3; ▪: subject 4; ▵: subject 5; •: subject 6.
Breathing strategy
Linear relationships were demonstrated between PTPoes/Poes,max and tI/ttot for first (r=0.95, p=0.004), second (r=0.97, p=0.001), and third (r=0.89, p=0.02) RME tests.
Study 3: patients with interstitial lung disease due to systemic sclerosis
Characteristics of the patients are summarized in table 2⇓. Eight patients underwent RME testing and were compared with eight controls (table 3⇓). Log tlim, less than predicted from the PTPoes/Poes,max when compared with normal RME values in study 1 (fig. 1b⇑), was taken as a reduction in RME. All patients had normal cardiac function on echocardiogram and evidence of interstitial lung disease on computed tomography.
Choractoristics for eight patients with systemic sclerosis and interstitial lung disease
Comparison of patients with systemic sclerosis and interstitial lung disease (SS/ILD) and age-matched controls
Respiratory muscle strength and endurance
There was no difference in mean Poes,max between the SS/ILD group and the controls. Log tlim and PTPoes/Poes,max were calculated for the patients and compared to the PTPoes/Poes,max and log tlim values obtained from the 30 normal subjects (fig. 5⇓). The log tlim value was less than predicted from the PTPoes/Poes,max value in patients 1, 2, 4, 6–8, indicating a reduction in RME. Patients 3 and 5 had a value for log tlim that would be predicted from the PTPoes/Poes,max, indicating normal RME.
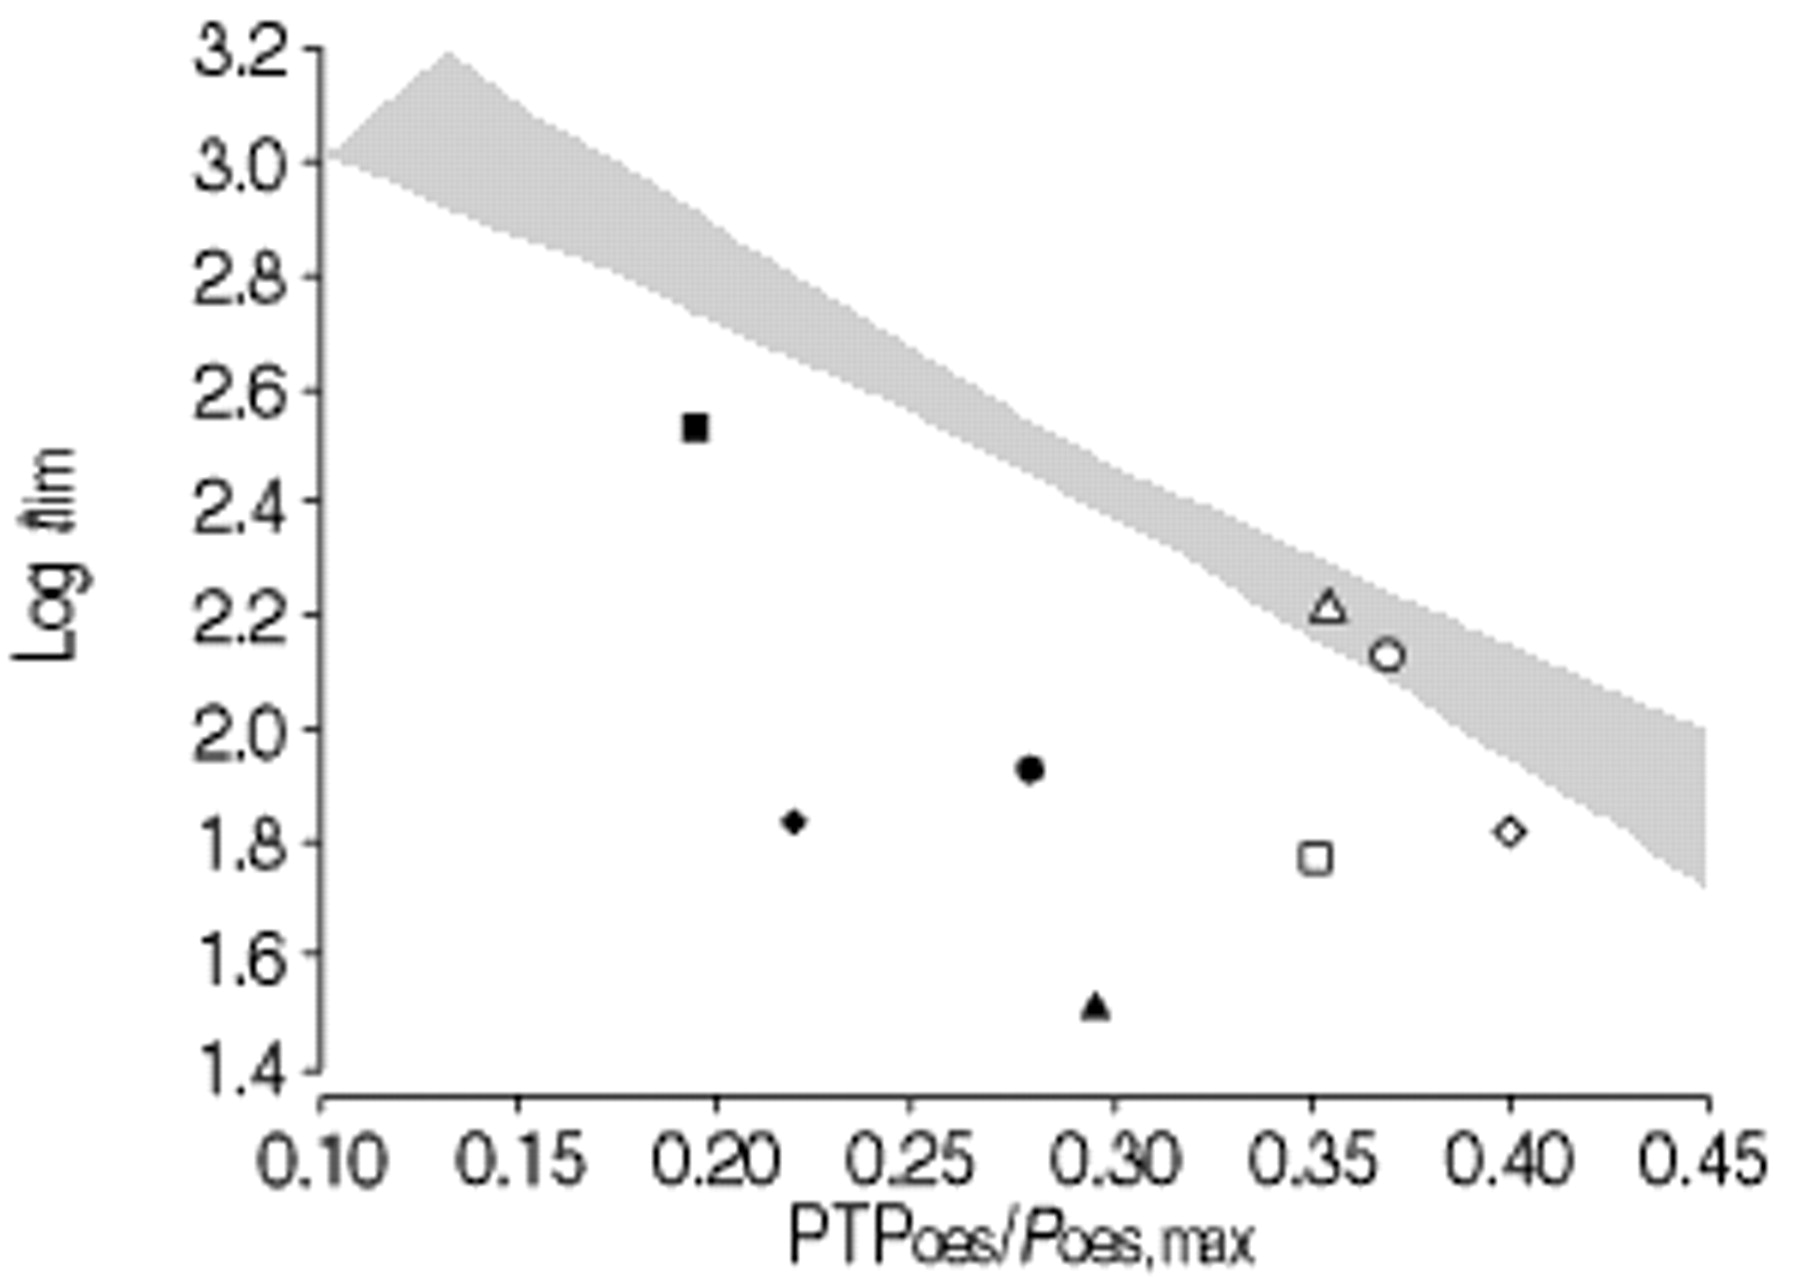
Plot of log endurance time (log tlim) and oesophageal load/capacity ratio (oesophageal pressure-time product per total breath cycle (PTPoes)/maximum negative oesophageal pressure (Poes,max)) for eight patients with systemic sclerosis and interstitial lung disease, compared directly with that of the 30 healthy normals in figure 1b⇑. □: patient 1; ▴: patient 2; ○: patient 3; ▪: patient 4; ▵: patient 5; •: patient 6; ⋄: patient 7; ♦: patient 8.
Dynamic compliance, duty cycle, load/capacity ratio
Patients with SS/ILD (table 3⇑) had a reduction in CL,dyn (p<0.0001). This was associated with an increase in tI/ttot (p=0.001) and PTPoes/Poes,max (p=0.04).
Discussion
The present study confirms previous data that there is wide inter- as well as intrasubject variability in tlim when loading tasks are performed with unconstrained breathing patterns. However, the data shows that this variation in tlim can be explained by variations in breathing strategy, which in the present model is principally tI/ttot. If the PTP (load) during the RME test is normalized for the maximum negative pressure (capacity), then tlim becomes more predictable and abnormal RME can be identified. This relationship also holds true for Pmouth, which suggests that it is possible to use this method as a noninvasive test of RME.
Critique of method
Lung volume
Poes,max was measured at FRC; whereas during loaded breathing, the end expiratory lung volume is likely to decrease 14 and decreasing would have the effect in the present study of increasing the load/capacity ratio, as the numerator will be increased. However, for the test to be clinically practical it was not feasible to correct for volume. Moreover, since the change in Pmouth,max between residual volume and FRC is ∼14% 15 and not all of this range is covered by expiratory phase abdominal muscle recruitment, the authors predict that volume considerations would not be a major source of variance.
Why use constant submaximal threshold loading rather than other inspiratory loading protocols to measure respiratory muscle endurance?
Several tests of RME have been reported 12, 16–21, many of which have used incremental loading methods 12, 19–21. Although normal reference range data have been published 20, there is still uncertainty as to whether breathing pattern affects incremental loading. More recent studies suggest that incremental threshold loading is not affected by changes in breathing pattern 12, 22, whereas previous studies showed that pressure load 5, 6, flow rate 23, duty cycle 24 and lung volume 25 all affect RME. Furthermore, poor reproducibility of the incremental test has limited its clinical use. In one of the first studies using threshold loading to determine RME 18, the maximum sustainable inspiratory pressure increased in subsequent tests, and these results differed from those reported by Martyn et al. 12 who repeated a similar protocol. Thus, the learning effect that accompanies all volitional tests 26, combined with the fact that incremental tasks reflect the strength rather the endurance of the respiratory muscles 14, could contribute to the poor reproducibility. In study 2, the authors found a significant learning effect with wide variability in tlim between occasions. However, when tlim is compared to the load/capacity ratio, the RME was shown to be unchanged (fig. 4⇑).
Why set the threshold pressure level at 70% of maximal?
The threshold pressure level of 70% of maximum was determined from pilot work. The present authors found that this pressure was acceptable to normal subjects and patients, in terms of the sensation of dyspnoea and duration of the test. It was hypothesized that maximal acceptability would minimize the impact of central factors, particularly motivation. Nevertheless, the authors acknowledge that for patients with a substantial intrinsic load imposed by their cardiorespiratory disease, a level of 70% of Poes,max may be too high to allow them to achieve a meaningful tlim. For such patients, it may be necessary to use a lower level; however, by expressing tlim as a function of the respiratory load/capacity ratio, the test should still yield useful results.
Respiratory load/capacity ratio to assess respiratory muscle endurance
Previous investigators have evaluated the endurance properties of the respiratory muscles and the effect of pressure and timing on diaphragm 5 and ribcage muscle 6 fatigue. These studies used pressure time index (PTI=(mean pressure generated/maximum pressure generated)×(inspiratory time/duty cycle)) to determine when fatigue is likely to occur. The present authors found the calculation of PTI to be problematic, even with the modern software available. To calculate PTI, according to the method of Bellemare and Grassino 5, a square-wave breathing pattern must be maintained throughout inspiration, and the plateau pressure is recorded as the mean pressure generated. However, untrained healthy subjects and patients find it difficult to breathe with a square-wave breathing pattern and, in fact, breathe with much more “smoothed-out” patterns, so that it is difficult to accurately determine the plateau pressure. Furthermore, this type of breathing pattern is associated with a more gradual fall and rise in the negative intrathoracic pressure, which is not accommodated by PTI. Even if a nonsquare wave breathing pattern is used, the computation would require an algorithm such that,  where P is the pressure generated per breath and n is the number of P points sampled throughout the inspiration 27. A much simpler method uses PTP. Appendini and Donner 28 recently re-evaluated PTI and suggested that PTI is the PTP developed over the total breath cycle (PTP/ttot) expressed as a percentage of the maximum pressure that can be generated. This modified version of PTI, or load/capacity ratio, was used in the present study to determine the relationship between (Poes,tp·total breath cycle−1/Poes,max) and tlim in subjects breathing with an unrestricted pattern. Interestingly, in the healthy normals, the mean PTPoes·cycle−1/Poes,max was 0.29, which is close to the 0.30 threshold value for PTI reported by Zocchi et al. 6, above which ribcage muscle fatigue occurred in four highly-trained subjects performing square-wave breathing.
Learning effect with endurance testing
Previous studies have demonstrated learning effects with the different tests of RME 26. This has contributed to the difficulty in determining a set of normal values for RME, as a healthy subject would have to undergo a number of endurance trials to achieve a reliable result. In study 2, there was wide intra- and intersubject variability in tlim (table 1⇑).
The results from these repeated tests raises two relevant points: 1) repeated tests of RME may not always result in an increased tlim; individuals can actually adopt breathing strategies that reduce tlim (subjects 1 and 2); and 2) variations in tlim between RME tests in the same individual can be explained if tlim is related to the respiratory load/capacity ratio such that a decrease in PTPoes/Poes,max correlates with an increase in log tlim (fig. 4⇑). This is advantageous when assessing sequential clinical or experimental data.
Load/capacity ratio and endurance time
The curvilinear relationship between tlim and the respiratory load/capacity ratio (fig. 1a⇑) is similar to that described in previous studies 5, 6. The present approach recognizes and utilizes this relationship without the need for a fixed breathing strategy and expresses RME as a function of the relationship between tlim and PTPoes/Poes,max. To have a more clinically-useful measure of RME and to establish normal values, logarithmic conversion of tlim was performed as a variance-stabilizing transformation (fig. 1b⇑). This allows a simple, direct comparison of patient data with normal values (fig. 5⇑).
It could be argued that tI/ttot is sufficient to explain the variance in log tlim, but comparison of figures 1b and 2b⇑⇑ shows that the correlation between log tlim is better for the load/capacity ratio (r=0.88) than for tI/ttot (r=0.77). Thus, tI/ttot has a good, but not invariable, relationship with the load/capacity ratio (fig. 2a⇑).
Assessment of respiratory muscle endurance from mouth pressures
A Bland and Altman plot 13 confirmed the close agreement between the Pmouth and Poes measurements during ITL (fig. 3a⇑), with log tlim being linearly related to PTPmouth/Pmouth,max (r=0.82; fig. 3b⇑). Thus, measurements based on Pmouth would permit a noninvasive assessment of RME.
Assessment of respiratory muscle endurance in patients with systemic sclerosis and interstitial lung disease
RMS in patients with ILD is reported as normal 29, but these patients suffer from severe breathlessness and impaired exercise performance. The authors hypothesized that reduction in exercise performance and increased breathlessness is due to increased intrinsic elastic load, resulting in an imbalance in the load/capacity ratio and a reduction in RME. Indeed, all the patients with SS/ILD had normal RMS and six of the patients had a reduction in RME (fig. 5⇑). The increased load in the patients with SS/ILD imposed a different respiratory pattern, with an increased tI/ttot, which was reflected in a higher load/capacity ratio than for the controls (table 3⇑). However, this load/capacity ratio could not be sustained, and tlim was reduced. Interestingly, in the patient group, those with reduced RME had a trend for the CL,dyn to be lower (0.05 L·cmH2O−1) than in those with normal RME (0.09 L·cmH2O−1; p=0.1). Thus, the reduction in RME could result from the combination of the intrinsic elastic load in series with the imposed extrinsic threshold load.
In summary, endurance time can be expressed as a function of the respiratory load/capacity ratio over a range of breathing strategies, using constant submaximal negative pressure threshold loading. The use of this relationship can detect abnormal respiratory muscle endurance in patients with cardiorespiratory disease. Furthermore, mouth pressure accurately reflects oesophageal data, and the noninvasive assessment of respiratory muscle endurance will allow normal values to be established in a large population, against which patients can be evaluated.
Acknowledgments
The authors would like to thank R. du Bois, A. Wells and N. Goh for their contribution in the recruitment of patients for this study. The critical input of N. Pride is also gratefully acknowledged.
- Received May 28, 2001.
- Accepted July 13, 2001.
- © ERS Journals Ltd


