


Abstract
The elastic pressure/volume (P/V) curve obtained by the multiple linear regression (MLR) technique using a new model, was compared with the quasi-static P/V points obtained by the rapid airway occlusion technique.
Seven infants were studied during mechanical ventilation using a pressure controlled mode. The resistive pressure was subtracted from airway opening pressure, thus determining the elastance related pressure, which was then plotted against the volume to make an MLR-elastance curve. Quasi-static P/V curves of the rapid occlusion technique were constructed by plotting the different inspiratory and expiratory volumes against the corresponding values of the quasi-static airway pressure.
The calculated MLR-elastance curves closely fit the experimental quasi-static P/V points obtained by the occlusion technique. There were, however, some discrepancies due to the viscoelastic behaviour of the respiratory system.
Although slightly altered by these discrepancies, the multiple linear regression-elastance curves did fit the observed quasi-static pressure/volume characteristics for use in clinical practice. The multiple linear regression technique may prove to be clinically useful by continuous monitoring of respiratory system mechanics during mechanical ventilation.
- elastance curve
- multiple regression analysis
- pressure/volume curve
- respiratory mechanics
- respiratory physiology
Respiratory system elastance has been shown to exhibit a negative lung volume dependence due to the curvilinear character of static pressure/volume 1–3 (P/V) curves. During mechanical ventilation, the lungs are frequently inflated to the nonlinear level on the P/V curve. It is generally accepted that a graphic presentation of the P/V relationship at a given respirator setting can provide great insight regarding whether or not lung overdistension occurs.
The static P/V relationship, as a parameter for the elasticity of the respiratory system, can be determined by various methods. The super syringe technique is a continuous procedure of step-by-step inflation and deflation using a large syringe while the patient is disconnected from the ventilator 4. The interrupter technique consists of rapid occlusions within a single breath cycle 5, 6 or of interrupting airways at different inflation and deflation volumes 7–9. All occlusion data can then be plotted on a P/V diagram. The constant flow technique is performed during volume controlled mechanical ventilation using a very slow constant inflation flow of 3 L·min−1 or 9 L·min−1, and thus pressure consumed by the flow resistance in the airway is not considered to be of any clinical relevance 10, 11. These techniques are sometimes not practical to perform or require the presence of a trained investigator and the respirator settings may need to be changed. With the increasing availability of computer-based data acquisition systems, high speed data collection and analyses are now possible using the computerized least-squares multiple regression analysis technique 12. Using a multiple linear regression (MLR) analysis to analyse the flow and pressure changes at the airway opening during mechanical ventilation, permits dynamic mechanics to be measured noninvasively without interfering with the ventilation pattern being employed. An MLR analysis also allows for the use of various respiratory system models 13. Several investigators have examined the influence of the volume and flow on espiratory mechanics by including a volume-dependent term for elastance and a flow-dependent term for resistance in a model 3, 13, 14. Thus, a model including a fourth-polynomial elastance term and a second-polynomial resistance term was investigated in the present study.
The elastic P/V curve obtained by an MLR analysis employing the new model, was compared with a plot of the quasi-static P/V points obtained by the rapid airway occlusion technique. The objective of this study was to utilize the MLR analysis for the new model to obtain additional data related to the P/V characteristics of mechanically ventilated subjects.
Methods
Subjects
The study was performed on seven neonates admitted to a neonatal intensive care unit (Tokushukai Medical Center, Fukuoka, Japan) and who were mechanically ventilated for respiratory disorders as a result of various diseases. Mechanical ventilation was started on the first day of life and lasted throughout the study and thereafter. All patients, except for case 7, were administered artificial surfactant because of the diagnosis of respiratory distress syndrome at admission. The patients were intubated transorally with endotracheal tubes with an internal diameter of 2–3.5 mm. Detailed information regarding the seven newborns is presented in table 1⇓. The level of peak inspiratory pressure (PIP) and positive end-expiratory pressure (PEEP) was determined according to clinical requirements to improve oxygenation without causing any haemodynamic compromise. The study was performed with the subjects in the supine position while being regularly ventilated without any spontaneous respiratory movement or rapid eye movement. No sedative was administered before the study. The baseline shift in the volume curve during each breath was ensured to be within 5% to eliminate any breaths with air leakage around the endotracheal tube. Routine care, such as aspiration, had been performed in all patients before the study. The nature and aims of the investigation were explained to the next of kin, and their informed consent was obtained.
Characteristics of infants
Equipment
The flow (V′) was measured with a pneumotachograph made in the authors' laboratory, connected to a differential pressure transducer (Nihonkoden, Tokyo, Japan). This device was inserted between the Y-piece of the ventilator circuit and the endotracheal tube (ETT). The pneumotachograph was linear over the experimental range of flow. The volume was determined by electronically integrating the flow signal. Airway opening pressure (Pao) was measured proximal to the ETT using a pressure transducer (Nihonkoden, Tokyo. Japan). The transducers produced no appreciable shift or alteration in the amplitude at frequencies as great as 20 Hz. The signals were sampled at a frequency of 200 Hz, and then were digitally stored into a personal computer using a 12-bit analogue-to-digital converter (MacLab, NSW, Australia) for the subsequent data analysis. The elastance curves produced by a computerized MLR analysis (MLR-elastance curve) were then correlated against those obtained using the rapid airway occlusion technique.
Multiple linear regression technique
The equation of motion for a single-compartment lung model (SCM) was solved using MLR 15, 16, and respiratory system elastance (Ers) and resistance (Rrs) were computed during a complete respiratory cycle:  where V is the volume obtained through the electrical integration of flow and EEAP (end-expiratory alveolar pressure) is the elastic recoil pressure when the volume equals zero.
This equation is a simple first-order linear model that encompasses the total Rrs and Ers. Ers, Rrs and EEAP were obtained by a linear regression of Pao against V and V′. Due to the curvilinear character of the respiratory static P/V curves, the lung and chest wall elastances vary with lung volume. The pressure necessary to overcome lung elastance (Pel) can be expressed as a polynomial function of V 2, 17, 18. A biquadratic polynomial equation was employed in the present study:  where kn is a constant. In general, the resistive pressure is not linearly related to the flow 19. It should be noted that the ETT represents a substantial impedance to the ventilating flow 19–21. Calculations of respiratory mechanics were performed after subtracting the resistance pressure due to the ETT from Pao. Inspiratory and expiratory resistance pressures due to the ETT were calculated as flow-dependent resistance characterized by Rohrer's equation
  and were measured separately for inspiratory and expiratory flows in vitro. The resistance related pressure (Pres) due to respiratory system can also be described by the Rohrer's equation:
  The absolute values of flow were used for the second order resistance term because the calculations were performed using the data derived from the whole respiratory cycle. The nonlinear characteristics of respiratory elastance were combined with resistance by modelling the elastance and resistance as a polynomial function of lung volume for elastance and flow for resistance, respectively, as shown in the following equation:
  The coefficients were obtained based on the linear regression of Pao versus V, V2, V3, V4, V′ and |V′|×V′.
Subtracting the pressure required to overcome viscous resistance  from Pao gives the elastance related pressure (Pel-MLR):
  Pel-MLR was then plotted against the volume to yield an MLR-elastance curve. In order to make a well-matched comparison, eight complete breaths were selected for the MLR calculation (MLR-breath) between the test breaths examined by the occlusion technique. The data on MLR-breath were sampled during the period beginning 25 ms prior to the airway pressure rise of a breath and ending 25 ms after the rise of the next breath. The actual data of the eight MLR-breaths were averaged and analysed to yield the MLR-elastance curve at the given ventilator setting.
Four additional models were also evaluated to determine whether or not the respiratory mechanics can be estimated as well as the model (Equation 4) mentioned earlier. 


 Equation 8 consists of a biquadratic elastance term and a single resistance term, which were used instead of a second order resistance term in Equation 4. Equations 9, 10 and 11 consist of a third order, a second order and a first order elaslance term respectively, in place of the biquadratic elastance term in Equation 4. The fit of the models to the data was judged based on the coefficient of determination (R2) with the paired t-test.
Airway occlusion technique
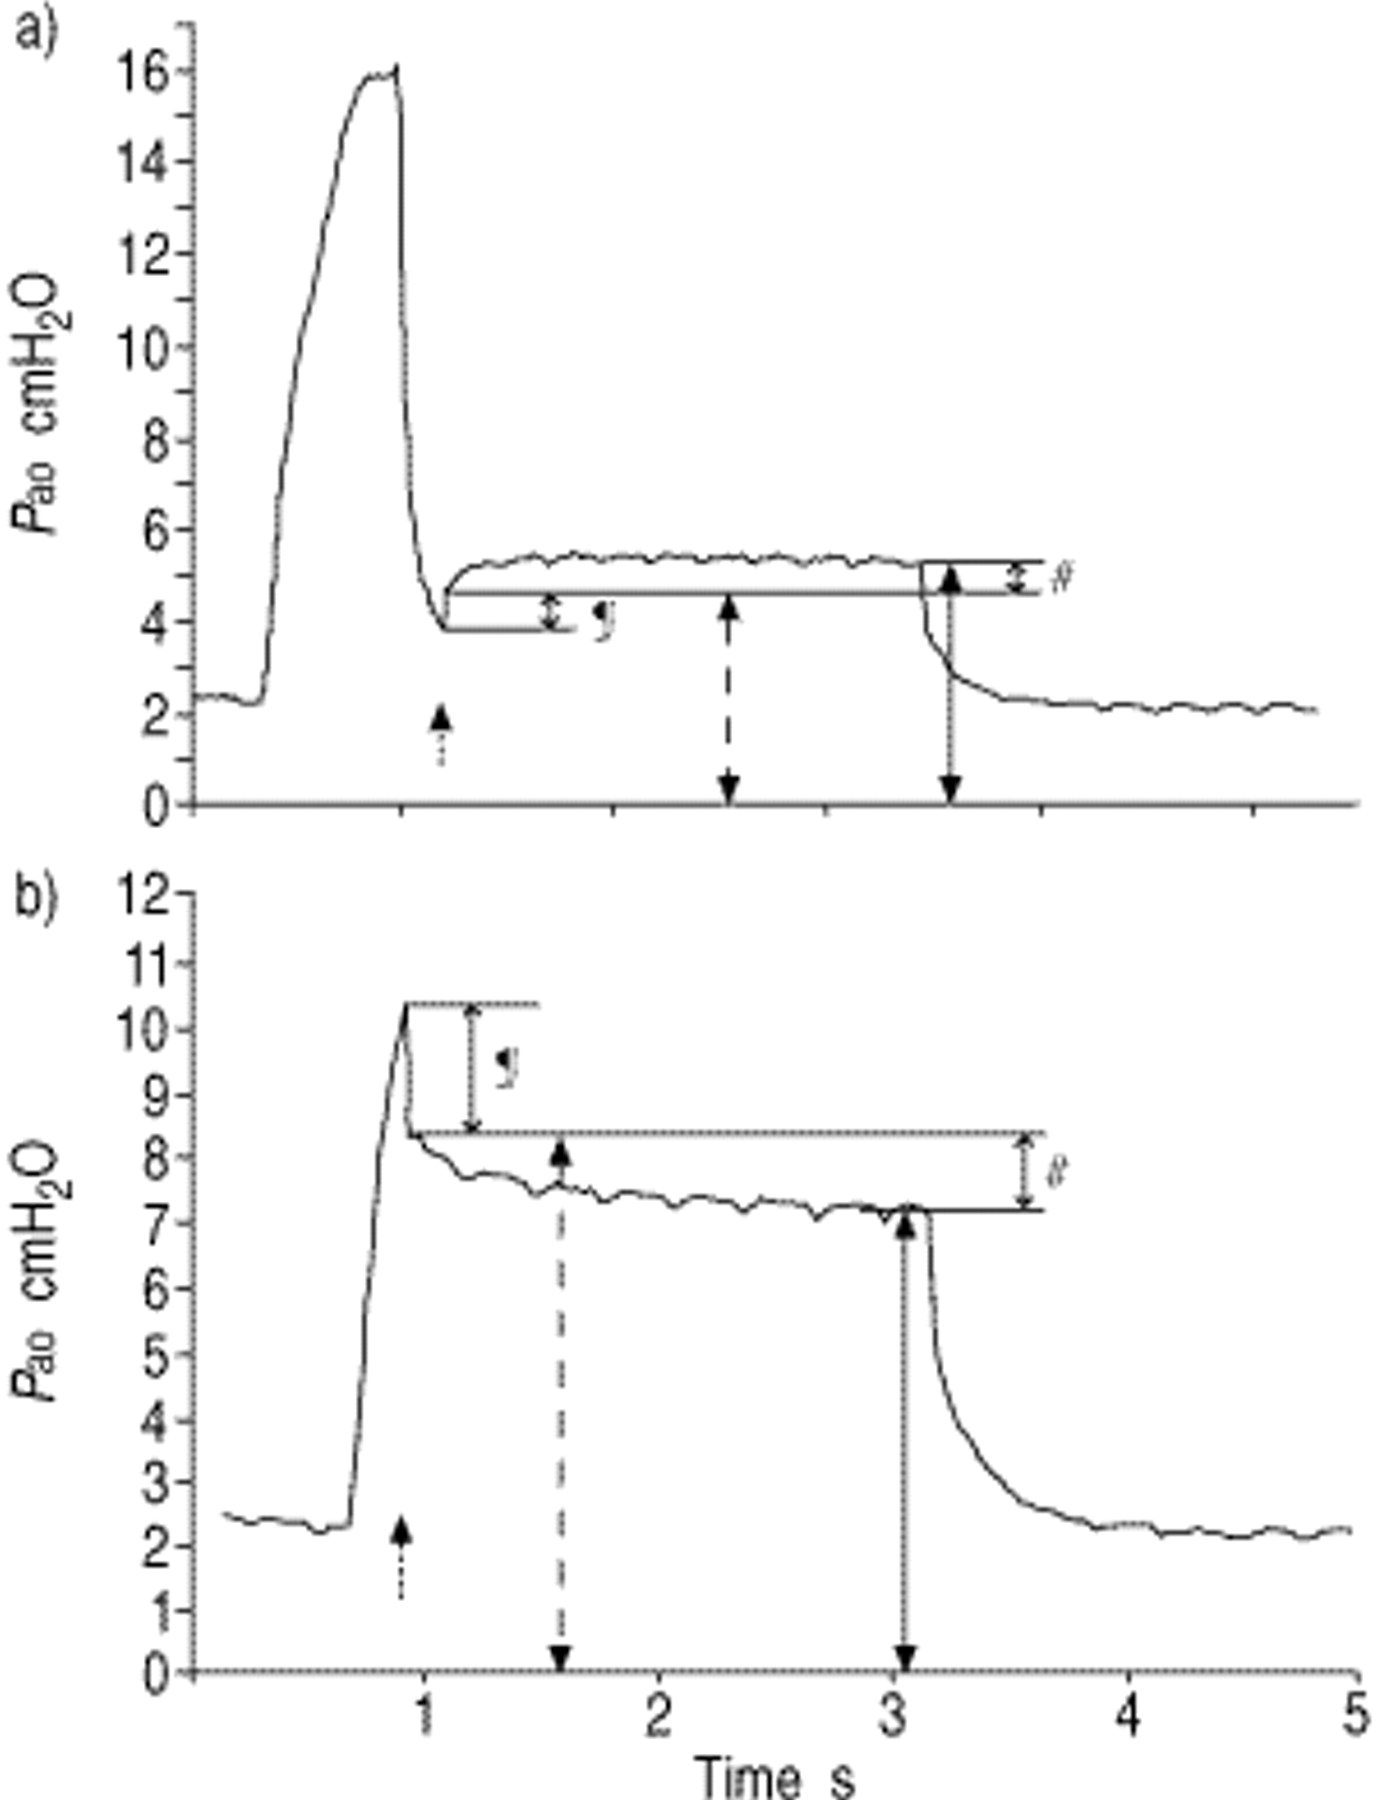
There is considerable evidence in the literature to suggest that quasi-static characteristics can be estimated by the occlusion method 5–9. A pneumatic occlusion valve that was produced in the laboratory was inserted between the pneumotachograph and the ETT (fig. 1⇓). The equipment has 0.4 mL of dead space and the closing time is <20 ms. With the ventilator maintained at constant settings, a series of airway interruptions of 3-s durations were performed randomly at different volumes of the breathing cycle. Between occlusions, baseline ventilation was resumed for 2–4 breaths to restore a fixed previous pressure and volume history. Over a period of 30 min, 15–30 airway interruptions were performed at each ventilator setting. Pao exhibited two distinct changes after rapid airway occlusions (fig. 2⇓) 22, 23. One was an immediate change of Pao (ΔPinit) to a certain pressure level, dynamic elastance pressure (Pel,dyn), that was followed by a slower pressure change (ΔPdiff). The upward direction of the second slower pressure change was defined as positive ΔPdiff. ΔPinit represents the pressure change across the resistance of the airways and chest wall. The slower, secondary change in the pressure that eventually reaches a plateau represents the stress recovery or adaptation of the tissues and chest wall as well as the redistribution of gas among the different lung units observed with an uneven time constant distribution. The plateau pressure reflects the static elastic recoil pressure of the respiratory system (Pel,st). Pao showed oscillations after interruptions due to cardiac artifacts. The values for Pel,dyn and Pel,st were obtained from computer generated polynomial curves fit to the post-occluded Pao signals, and then extrapolating the curve to the point in time when the valve was totally closed and to the plateau point. The quasi-static P/V curves resulting from the rapid occlusion technique were constructed by plotting the different inspiratory and expiratory volumes against the corresponding values of Pel,st. The profiles of the dynamic P/V relationship associated with the rapid occlusion technique were plotted in the same manner using Pel,dyn.

Schematic diagram of the pneumotachograph and occlusion valve demonstrating each position and pressure port. Pao: airway opening pressure.

Recording of: a) the airway opening pressure (Pao)-time profile following midexpiratory occlusion; and b) an inspiratory study breath from the same infant. ΔPdiff is defined as negative in this case. The initial rapid pressure change (ΔPinit; ¶), the secondary slower pressure change (ΔPdiff; #), the dynamic elastic recoil pressure (Pel,dyn; - - -) and the static elastic recoil pressure (Pel,st; —) are shown. The dotted arrow indicates the time of airway occlusion.
Comparisons and statistical analysis
The Pel,st values and the corresponding Pel-MLR values at the same lung volume were subdivided into four groups at every 4 cmH2O of the Pel,st values (group 1:0 cmH2O≤Pel,st<4 cmH2O; group 2:4 cmH2O≤Pel,st<8 cmH2O; group 3:8 cmH2O ≤Pel,st<12 cmH2O; group 4:12 cmH2O≤Pel,st <16 cmH2O). The differences between the two were evaluated at each Pel,st step using the paired t-test. A p-value of <0.05 was considered significant. All values are expressed as mean±sd.
Results
The R2 values were 0.985–0.994 (table 2⇓). The differences were small but statistically significant. The data obtained during mechanical ventilation were best fitted by the biquadratic equation.
The calculated MLR-elastance curves were compared to the quasi-static P/V points obtained using the occlusion technique. For each infant, the calculated MLR-elastance curve closely fit the observed data points of the Pel,st/V relation obtained by occlusion techniques, whether the relationship was linear (fig. 3⇓, cases 3, 4, 6) or curvilinear (fig. 3⇓, cases 1, 2, 5, 7a, 7b). The mean difference between the Pel,st value and Pel-MLR value at the same lung volume was 0.06 cmH2O and the sd was 0.49 cmH2O. The highest value for the difference between the two was 1.3 cmH2O at end-inspiration for case 6.

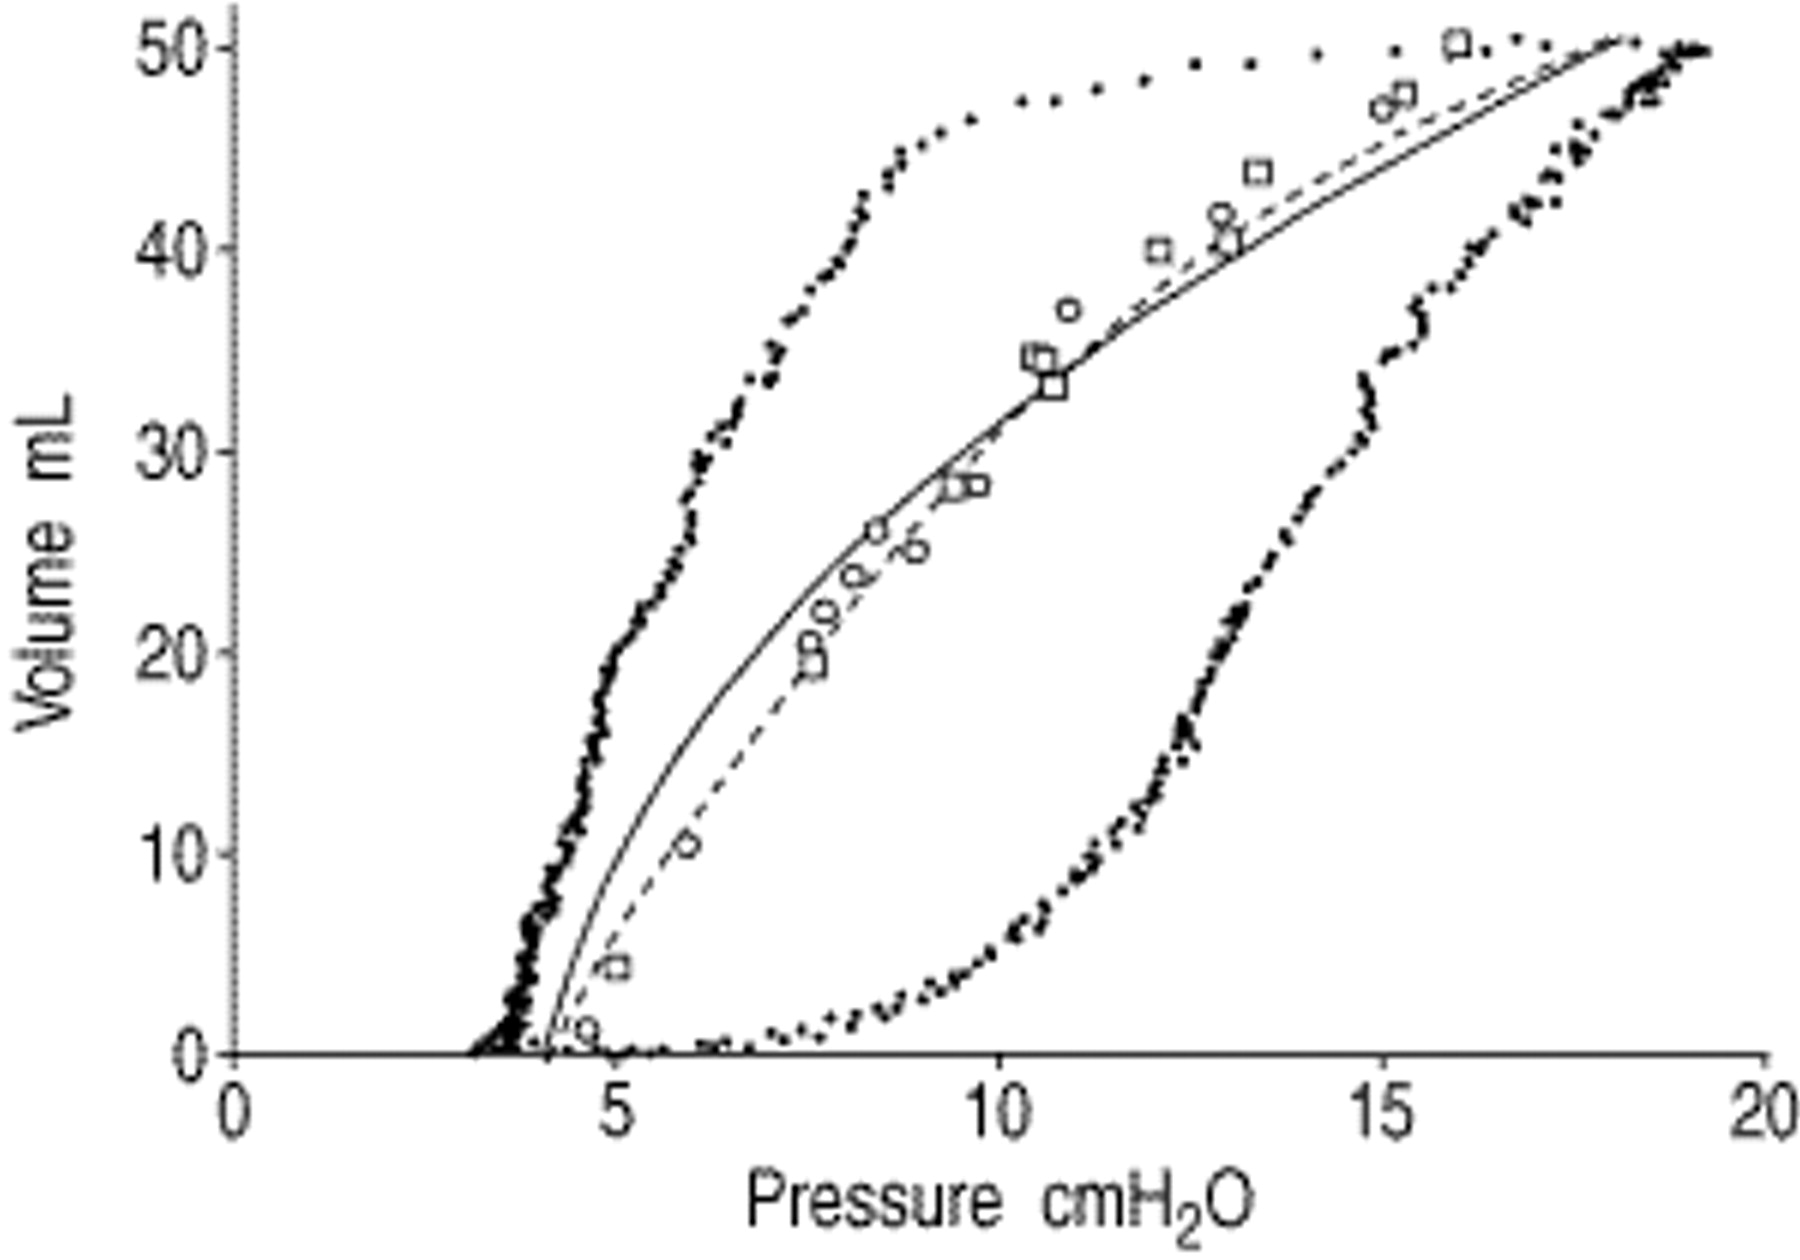
Representation of multiple linear regression-elastance curves (lines) compared to experimental static elastic recoil pressure/volume (Pel,st/V) points during inspiration (□) and expiration (○). a): case 1; b): case 2; c): case 3; d): case 4; e): case 5; f): case 6; g): case 7a; h): case 7b. No hysteresis in the Pel,st/V relationship was observed. Dotted lines represent the airway opening pressure/volume curves.
Although most results were quite similar, some differences were observed between the two (fig. 3⇑, cases 5–7a, b). In these cases, the pressure values for the Pel,st/V points at higher lung volume levels (at higher airway pressure levels) were lower than those indicated by the MLR-elastance curve and higher at lower lung volume levels (at lower airway pressure levels). The MLR-elastance curves intersected the Pel,st/V curves in the middle range of the lung volumes (in the middle range of the airway pressure levels). Table 3⇓ shows the differences between the two in the Pel,st subdivided groups. When compared using all data together, no significant difference between the Pel,st values and the corresponding Pel-MLR values was found. However, when calculated separately there were significant differences between the two at higher (12 cmH2O≤Pel,st<16 cmH2O) and lower (0 cmH2O≤Pel,st<4 cmH2O) airway pressure levels. The mean Pel-MLR value was 0.51 cmH2O higher than the Pel,st value at a higher airway pressure level. In contrast, the mean Pel-MLR value was 0.19 cmH2O lower than the Pel,st value at a lower airway pressure level. No significant difference was found in the midrange of Pel,st.
The static elasticrecoil pressure (Pel,st) values, the corresponding elastance related pressure-multiple linear regression Pel-MLR values at the same lung volumes and the difference between the two
Pel,dyn/V points and corresponding Pel,st/V points in a representative case (case 7a) are shown in figure 4⇓. The difference between the two corresponding points shows ΔPdiff at each interrupted lung volume. During the inspiratory phase and initial one-third of the expiratory phase, ΔPdiff remained negative, thus implying that Pel,dyn was higher than Pel,st. The negative ΔPdiff values were the greatest at end-inspiration and the least at midexpiration. Through the next two-thirds of expiration, the ΔPdiff values became positive and gradually increased with the resulting Pel,st points becoming higher than the Pel,dyn points. The Pel,dyn points indicate the presence of hysteresis, but no apparent quasi-static hysteresis was observed. The same behaviour for the viscoelastic characteristics were observed in every infant, a finding which is consistent with a similar conclusion for the viscoelastic characteristics by Johnson et al. 8.

Inspiratory static elastic recoil pressure (Pel,st; ▪), inspiratory dynamic elastic recoil pressure (Pel,dyn; □), expiratory Pel,st (•) and expiratory Pel,dyn (○) versus volume for case 7a are shown. The difference between a pair of Pel,st and Pel,dyn values at the same lung volume is explained as viscoelasticity of the lung, secondary slower pressure change (ΔPdiff). During inspiration and early expiration, Pel,st is lower than Pel,dyn implying that ΔPdiff is negative. During the last half of expiration, Pel,st is higher than Pel,dyn indicating that ΔPdiff is positive. The Pel,st/volume relationship shows no hysteresis. However, the Pel,dyn/volume relationship demonstrates the presence of hysteresis.
Discussion
Bhutani et al. 15 used the SCM to calculate lung mechanics in neonates and obtained a strong coefficient of determination (R2>0.98) to validate the linear assumption. Seear and Werner 16 obtained MLR measurements using the SCM from 22 subjects. Their results compared well with other measurements of mechanics over a wide clinical range. These findings suggest that the SCM is a very good approximation of the behaviour of the respiratory system. A fundamental assumption of the SCM is that elastance and resistance of the respiratory system is constant throughout the respiratory cycle. However, the respiratory system resistance depends on flow and sometimes on lung volume. In intubated subjects, mechanics measurements will include ETT resistance which is also dependent on flow. Kano et al. 24 evaluated a flow-dependent SCM to estimate the respiratory mechanics. Their results indicated that the data were not well described by a flow-dependent SCM. Their flow-dependent SCM consisted of a second order resistance term, but the elastance term was first order. Therefore, in the present study a second order flow-dependent expression for resistance was applied, as was a biquadratic elastance term in the same equation. This study indicates that although the effect of ETT was subtracted, the fit was better in the model with a second order resistance term (table 2⇓). Figure 5⇓ shows an MLR-elastance curve obtained by a calculation using Equation 6 (consisting of a first order resistance term) in case 7a. The variances of the curve from Pel,st points were large and the shape of the curve (inflection point of the curve) was also different.
A multiple linear regression-elastance curve obtained by a calculation using Equation 6 (first order resistance term, —) in case 7a. Variances from static elastic recoil pressure (Pel,st) points are a little larger than those obtained using Equation 4 (second order resistance term, - - -). □: inspiration; ○: expiration.
Several investigators have examined the influence of volume on respiratory mechanics by including volume-dependent terms for elastance in a model 3, 13, 24, 25. Using a volume-dependent elastance model Kano et al. 24 found a considerable improvement in fit. They used a second order polynomial equation to analyse volume dependency. However, it is possible to apply a higher degree of polynomial expression in the method. Yukitake et al. 26 applied a biquadratic equation for MLR analysis and reported that the MLR data for airway pressure computed using this kind of equation were closely correlated with the observed Pao. They also tried a lower or a higher degree of polynomial expression to see whether or not the fit of the models to the data was good. The higher the degree, the better the fit, and they concluded that the biquadratic polynomial equation is sufficient for practical use. Figure 6⇓ demonstrates that the MLR-elastance curves obtained from the equations, using the first-, second- and third-polynomial elastance terms, are not as accurate as those obtained using a biquadratic equation. Not only were the variances from the Pel,st points large, but also the shapes of the curves (the inflection points) were substantially different. Figures 5 and 6⇑⇓ show that the higher the polynomial equation, the more closely the shape and the position of the P/V curve resembled those of the experimental P/V points regarding both the resistance terms and the elastance terms. This same phenomenon was observed in every case (data not shown). Finally, the equation with the fourth-polynomial elastance term and the second-polynomial resistance term was chosen. However, in the case of linear elastance, for example in cases 3, 4 and 6, the data closely correlated with all different models (data not shown). In acute respiratory distress syndrome, the inflation limb of the P/V curve has a sigmoid curve 27, with a low and upper inflection point. This kind of sigmoidal curve can only be described by a third order polynomial or a higher polynomial equation. The findings also suggest that the MLR analysis using a fourth order equation can provide a good approximation of the behaviour of the respiratory system (table 2⇓).

The MLR-elastance curve was constructed by plotting Pel-MLR against the corresponding volume. Pel-MLR was obtained by subtracting the flow resistive pressure from Pao in the dynamic state, thus implying that the MLR-elastance curve exhibited a dynamic elastance profile throughout the respiratory cycle. The value for Pel,dyn also excluded ΔPinit from Pao at the moment of interruption, as illustrated in figure 2⇑. An interruption of the flow at a low airway pressure during expiration tends to result in stress recovery in alveolar pressure. Conversely, an interruption at a high airway pressure either during inspiration or expiration, tends to result in stress relaxation. The slow dynamics due to the viscoelasticity of the lung or pendelluft do not reach a steady state at any moment during usual ventilation, and therefore, the alveolar pressure dynamics should be expressed by the Pel,dyn points. The alveolar pressures during inspiration and expiration at the same lung volume, in a dynamic state, should not be equal, even if the quasi-static alveolar pressures are the same, as shown in figure 4⇑. During ventilation, the alveolar pressure has to move on a hysteresis curve consisting of the Pel,dyn points, not on the quasi-static P/V curve. Both the Pel-MLR and Pel,dyn indicate the mean alveolar pressure overcoming lung elastance in the dynamic state. Theoretically, Pel-MLR should be compared to the Pel,dyn which is measured using the flow interruption technique. In the present study, the MLR calculations were performed using data from the entire respiratory cycle; there was no phase separation between expiration and inspiration. The Pel,dyn/V points and MLR-elastance curve for case 7a are shown in figure 7⇓. The MLR-elastance curve is positioned in the middle of the range of inspiratory and expiratory Pel,dyn/V points. The same findings were observed for every case, regardless of the ventilator settings (data not shown). Consequently, it appears that Pel-MLR indicates the approximate mean values for the expiratory and inspiratory dynamic alveolar pressure changes throughout the respiratory cycle. At the same time, the quasi-static P/V points were also positioned near the centre, between the inspiratory and expiratory Pel,dyn points in the middle and lower range of the airway pressure. As a result, the MLR-elastance curves were positioned very close to the quasi-static P/V curves.

Multiple linear regression-(MLR) elastance curve (—) compared to experimental dynamic elastic recoil pressure/volume (Pel,dyn/V) points during inspiration (□) and expiration (○) for case 7a. The MLR-elastance curve is closely positioned along the centre of the inspiratory and expiratory Pel,dyn/V points.
Despite variations in the values for viscoelasticity of the lung with the lung volume, the position of the static elastance curve can be estimated from the MLR-elastance curve. For the purpose of clinical practice, the MLR-elastance curves correlated closely enough with the experimentally measured quasi-static P/V characteristics, especially when the lung was ventilated beyond the linear portion of the P/V relationship. The conventional methods for measuring static elastance are cumbersome and are, therefore, not routinely used in clinical practice. The elastance curve obtained by the MLR technique described in this report thus avoids a number of these handicaps.
The PEEP is known to increase the end-expiratory lung volume along a fixed static P/V curve of the respiratory system in patients demonstrating minimal concomitant alveolar recruitment 9. Conversely, an upward shift along the volume axis of the P/V curve is observed in patients with alveolar recruitment 2. When ventilation is performed with a low end-expiratory lung volume in patients with acute lung injury, thus resulting in repeated end-expiratory collapse and tidal reinflation, a lower inflection point is then exhibited in the inspiratory P/V relationship 11. This kind of successive alveolar recruitment and derecruirtment during inflation and deflation results in a wide hysteresis regarding the static P/V characteristics. The present study was performed at the preset PEEP level, and no hysteresis in the quasi-static P/V curve was observed in any patient. As a result, these findings indicate that only a minimal degree of recruitment or none at all occurred at the various respirator settings in the patients. Thus, it is possible to estimate the static P/V data from zero end-expiratory pressure by extrapolating the MLR-elastance line to 0 cmH2O level in the P/V diagram. The MLR technique as originally described 12, used the entire respiratory cycle to calculate the mechanics. However, the respiratory system mechanics can be calculated for any portion of the respiratory cycle, by appropriate definitions of the data to be analysed. It is possible to obtain inspiratory and expiratory MLR-elastance curves separately. In the present study, the differences between inspiratory and expiratory elastance were minimal. However, in cases with a wide hysteresis, the MLR-elastance curve should be separately obtained in each inspiratory and expiratory phase.
The time courses of Pao, Pel-MLR and Pel,st in case 7a are shown in figure 8⇓. Pao is equal to the sum of the pressure required to overcome the resistive force, the elastic force and the EEAP. Pel-MLR represents the mean alveolar pressure at a given moment. The relationship between EEAP, PEEP and intrinsic positive end-expiratory pressure is illustrated in figure 8⇓. Some variances between Pel,st and Pel-MLR are also seen due to the viscoelastic properties of the lung, especially at higher airway pressure range.

Time courses of airway opening pressure (Pao; —), elastance related pressure (Pel-MLR; – – –) and static elastic recoil pressure (Pel,st; ○) for case 7a. *: positive end-expiratory pressure (PEEP); #: intrinsic positive end-expiratory pressure (PEEPi); ¶: end-expiratory alveolar pressure (EEAP) calculated by multiple linear regression (MLR) technique; ƒ: elastic recoil pressure (Pel)=(k1+k2×V+k3×V2+k4×V3)×V; §: resistive pressure=(k′1+k′2×|V′|)×V′; ¶+ƒ=alveolar pressure=Pel-MLR.

Coefficient of determination CR2 in each equation using a different degree of polynomial expression in elastance and resistance terms
The multiple linear regression-elastance curve shown in the present study revealed a very good agreement with that obtained by the occlusion technique. Reliable information about the elastic properties of the respiratory system at the given respirator settings could be obtained by the multiple linear regression technique without disconnecting the subject from the ventilator. This enabled the respiratory system mechanics to be monitored continuously in the intensive care unit. The graphic presentation and continuous monitoring of how the lung expands can thus provide a better understanding of the physiological state of the respiratory system as well as help in establishing improved guidelines for determining an optimal therapeutic approach. However, the present study was performed using a limited group of patients, and therefore, further investigations based on individual analyses for each respiratory phase are necessary.
- Received February 28, 2000.
- Accepted December 12, 2000.
- © ERS Journals Ltd
References


