


Abstract
Expiratory flow limitation (FL) at rest is frequently present in chronic obstructive pulmonary disease (COPD) patients. It promotes dynamic hyperinflation with a consequent decrease in inspiratory capacity (IC). Since in COPD resting IC is strongly correlated with exercise tolerance, this study hypothesized that this is due to limitation of the maximal tidal volume (VT,max) during exercise by the reduced IC. The present study investigated the role of tidal FL at rest on: 1) the relationship of resting IC to VT,max; and 2) on gas exchange during peak exercise in COPD patients.
Fifty-two stable COPD patients were studied at rest, using the negative expiratory pressure technique to assess the presence of FL, and during incremental symptom-limited cycling exercise to evaluate exercise performance.
At rest, FL was present in 29 patients. In the 52 patients, a close relationship of VT,max to IC was found using non-normalized values (r=0.77; p<0.0001), and stepwise regression analysis selected IC as the only significant predictor of VT,max. Subgroup analysis showed that this was also the case for patients both with and without FL (r=0.70 and 0.76, respectively). In addition, in FL patients there was an increase (p<0.002) in arterial carbon dioxide partial pressure at peak exercise, mainly due to a relatively low VT,max and consequent increase in the physiological dead space (VD)/VT ratio. The arterial oxygen partial pressure also decreased at peak exercise in the FL patients (p<0.05).
In conclusion, in chronic obstructive pulmonary disease patients the maximal tidal volume, and hence maximal oxygen consumption, are closely related to the reduced inspiratory capacity. The flow limited patients also exhibit a significant increase in arterial carbon dioxide partial pressure and a decrease in arterial oxygen partial pressure during peak exercise.
- arterial blood gases
- breathing pattern
- dynamic pulmonary hyperinflation
- lung function
- negative expiratory pressure method
This study was supported by Grant 198/0937 from Fondecyt.
Most normal subjects do not exhibit expiratory flow limitation (FL) during maximal exercise. In contrast, in patients with chronic obstructive pulmonary disease (COPD) tidal expiratory FL is frequently present even at rest 1, 2, as first suggested by Hyatt 3. Tidal FL promotes dynamic hyperinflation (DH) with concurrent decrease of the inspiratory capacity (IC) 2, 4, 5. Consequently, in COPD patients who exhibit tidal FL at rest, the maximal tidal volume (VT,max) during exercise should be limited by their reduced IC, i.e. during heavy exercise their end-inspiratory lung volume reaches a ceiling, making the inspiratory reserve volume impossible to be lowered further 4. This hypothesis has been advanced by Díaz et al. 5 to explain the significant correlation between resting IC and exercise tolerance in COPD patients with FL at rest. In contrast, in COPD patients who had no FL at rest, the resting IC played no significant role in exercise capacity.
Besides VT,max 2, other components of the breathing cycle, as well as gas exchange, may participate in determining exercise tolerance in COPD patients. Accordingly, the present study has investigated the role of tidal FL at rest on: 1) the relationship of IC to VT,max; and 2) gas exchange at peak exercise in COPD patients. Assessment of FL was made using a simple noninvasive method that involves applying a negative expiratory pressure (NEP) at the mouth during a tidal expiration, and comparing the ensuing expiratory flow/volume curve with that of the previous control expiration 6. The NEP technique has been extensively applied and validated, and has been used in stable COPD patients both at rest and during exercise 1, 2, 7.
Methods
Patients
The study was performed on 52 consecutive patients with mild-to-severe COPD. In the same subjects, the predictive power of resting respiratory function variables on exercise capacity has previously been assessed 5. The present results were obtained during the same exercise tests. Diagnosis was made according to American Thoracic Society (ATS) guidelines 8. Patients were receiving chronic care at the Department of Respiratory Diseases, Pontificia Universidad Católica de Chile, Santiago, Chile, and were familiarized with respiratory measurements, dyspnoea evaluation, and the symptom-limited incremental exercise test. Their clinical and functional state was stable at the time of the study, i.e. there was absence of exacerbations during the preceding 4 weeks. All patients had stopped smoking for at ≥2 yrs before the study, and were receiving regular treatment with inhaled bronchodilators, with no systemic or inhaled steroids. Twelve patients were on long-term oxygen therapy. None were participating in a respiratory training programme or receiving home mechanical ventilation. No change in the routine medical and oxygen therapy was made in the 4 weeks before the study. Patients with history of asthma, obstructive sleep apnoeas, other concomitant lung disease, cardiovascular disorders, inability to cooperate, or oxygen desaturation <80% during exercise whilst breathing room air were excluded. All agreed to participate in the study, which was approved by the Ethics Committee of the afore mentioned Institution.
Resting pulmonary and respiratory muscle function tests
Spirometry was performed with a calibrated dry spirometer (Vitalograph®, London, UK) according to ATS standards 9. Reference values from Knudson et al. 10 were used. Absolute lung volumes were measured with the nitrogen washout method (SensorMedics, Corp., Yorba Linda, CA, USA). For IC, predicted values were calculated as the difference between predicted total lung capacity and predicted functional residual capacity (FRC) 11. Airflow (V′) was measured with a heated Fleisch No. 2 pneumotachograph (Lausanne, Switzerland) and a differential pressure transducer (MP45, ±2 cmH2O; Validyne Corp., Northridge, CA, USA). Volume was obtained by numerical integration of the flow signal. Maximal inspiratory pressure (PI,max) was measured at FRC with a differential pressure transducer (Validyne MP45, ±100 cmH2O) according to the method described by Black and Hyatt 12. Reference values were those of Bruschi et al. 13. Tidal expiratory FL was assessed whilst seated at rest with the NEP technique, which has been previously described in detail 1, 2, 6. Arterial blood gas tensions were measured with a Ciba Corning 238 gas analyser (Ciba Corning Diagnostic Corp., Medfield, MA, USA), and the alveolar-arterial oxygen partial pressure difference (PA–a,O2) was calculated using the alveolar gas equation. Arterial lactate was measured with a Nova Stat Profile® M analyser (Nova Biomedical, Waltham, MA, USA).
Procedure and data analysis
Negative expiratory pressure test
Subjects were studied seated upright in a comfortable chair, breathing room air through the equipment assembly while wearing a noseclip. After regular breathing had been achieved, minute ventilation (V′E), tidal volume (VT), respiratory rate (fR), inspiratory time (tI), expiratory time (tE), total cycle duration (ttot), duty cycle (tI/ttot), mean inspiratory flow (VT/tI), and mean expiratory flow (VT/tE) were determined as mean values from 1-min records of flow and volume. A series of five NEP tests were then applied using a pressure of ∼−5 cmH2O. Subjects in whom application of NEP did not elicit an increase of flow over part or all of the control tidal expiration were considered FL. By contrast, subjects in whom flow increased with NEP over the entire range of the control tidal expiration were considered not to exhibit flow limitation (non−FL). The FL portion of the tidal expiration was expressed as a percentage of the control VT (FL, %VT) 1. The latter is presented as the mean of the five NEP tests.
Exercise test
An incremental symptom-limited exercise test was performed using an electronically braked cycle ergometer (ER 800®; Erich Jaeger, GmbH, Hoescberg, Germany). Subjects cycled at 50-revolutions·min−1 with the external power increased in 1-min steps of 5–10 watts to the limit of their tolerance, either by dyspnoea or leg fatigue. They were familiarized with the Borg Scale 14 and were capable of quantifying their level of dyspnoea or leg discomfort. An arterial catheter (Arteriofix, Braun Medical AG, Melsungen, Germany) was placed into the radial artery for arterial blood gases measurements. Oxygen saturation, cardiac frequency (fC) and arterial pressure were continuously monitored with a Dinamap™ Plus vital signs monitor (Critikon, Tampa, FL, USA). fC was used to compute maximal O2 pulse (oxygen consumption/maximal cardiac frequency (V′O2/fC,max)). The subjects, wearing a noseclip, breathed through a mouthpiece attached in line to a Fleisch No. 3 pneumotachograph and to a two-way HansRudolph valve (2600, HansRudolph, Kansas City, MO, USA), with a combined dead space of 80 mL, connected to a metabolic chart (Q-Plex®; Quinton, Seattle, WA, USA). The flow signal was processed as previously stated for resting measurements. The inspiratory line was open to room air whereas the expiratory line was connected to the metabolic chart for breath-by-breath measurement of oxygen consumption (V′O2), and carbon dioxide production (V′CO2) with the output averaged for each 30-s interval. The physiological dead space (VD) was computed according to the following equation:
The predictive values for V′E, VT, and fR during peak exercise were those of Jones 15. Predictive values for VD and minute dead space ventilation (V′D) were taken from Harris et al. 16. The maximal voluntary ventilation (MVV) was calculated as forced expiratory volume in one second (FEV1)×35 17. The predicted fC,max was calculated as 210-(0.65×age). Predicted values for maximal O2 pulse were those of Jones 15. The maximal mechanical power output (WRmax) and O2 uptake (V′O2,max) were determined. The predicted normal values for WRmax and V′O2,max were taken from Jones 15.
Statistical analysis
Results are expressed as mean±sem. Comparisons were performed using paired or unpaired t-test, as required. A Bonferroni-type adjustment was carried out using the procedure of Hommel 18. With this procedure, the significance levels of the comparisons were adjusted for the number of variables of each type measured (anthropometric, breathing pattern, metabolic, etc.) under both conditions studied (rest and peak exercise). Linear regression analysis was performed using the least squares method. When this analysis was carried out using VT,max as a dependent variable, the independent variables included the resting pulmonary function, blood gases, and PI,max together with the anthropometric characteristics of the subjects. The strongest significant contributors to VT,max were selected by standard stepwise multiple regression analysis. This analysis was first performed for the entire population and then separately for non-FL and FL patients. A p-value <0.05 was considered significant.
Results
Twenty-three COPD patients were non-FL while the other 29 exhibited tidal FL at rest, the FL (VT%) ranging 42–80%. Table 1⇓ shows the anthropometric and lung function characteristics of the 23 non-FL and 29 FL COPD patients. The anthropometric parameters and smoking history did not differ significantly between the two groups of patients. Except for PI,max, all respiratory variables differed significantly between non-FL and FL patients.
Anthropometric, pulmonary, and respiratory muscle data at rest of 23 non-flow limited (non-FL) and 29 flow limited (FL) chronic obstructive pulmonary disease patients
The breathing pattern at rest and during maximal exercise of the non-FL and FL patients is given in figure 1⇓ and table 2⇓. While at rest there were no significant differences between the two groups of patients, at peak exercise V′E, VT, VT/tI and VT/tE were significantly higher in non-FL patients, whereas tE and ttot were significantly shorter. In both groups of patients maximal V′E and VT were below the normal predicted values, while maximal fR was within normal limits (table 2⇓). At rest, the V′E/MVV was significantly higher in FL patients than in the non-FL patients. Although, on average, V′E/MVV at peak exercise was higher in FL than non-FL patients, the difference was not significant.

Average spirograms (VT) in chronic obstructive pulmonary disease patients without (non-FL; •) and with (FL; ○) tidal expiratory flow limitation a) at rest and b) at maximal exercise. VT: tidal volume.
Breathing pattern at rest and at peak exercise of 23 non-flow limited (non-FL) and 29 flow limited (FL) chronic obstructive pulmonary disease patients
The power output and O2 uptake during peak exercise, together with the corresponding cardiac variables and Borg dyspnoea and leg fatigue scores are given in table 3⇓. The values of WRmax and V′O2,max, both normalized and non-normalized, were significantly lower in the FL patients. Cardiovascular response was similar in terms of fC,max, but both absolute and normalized values of O2 pulse were significantly lower in FL than in non-FL patients. While the Borg dyspnoea score did not differ significantly, leg discomfort was significantly higher in the FL patients (p<0.05).
Work rate, O2 uptake, Borg dyspnoea and Borg leg fatigue data at peak exercise of 23 non-flow limited (non-FL) and 29 flow limited (FL) chronic obstructive pulmonary disease patients.
As shown in table 4⇓, the values of V′CO2, pH, arterial oxygen partial pressure (Pa,O2), alveolar ventilation (V′A) and lactate concentration at maximal exercise were significantly lower in the FL patients, whereas carbon dioxide tension in arterial blood (Pa,CO2) and VD/VT were higher. At rest, only Pa,O2 was significantly lower, whereas Pa,CO2 showed a trend to be higher in the FL patients. However, at rest there was no significant difference in V′CO2, pH and V′A between FL and non-FL patients. Both at rest and during peak exercise there were no significant differences in PA–a,O2 and VD between the two groups of patients. Both at rest and during peak exercise, however, the VD was higher than normal, reflecting alveolar ventilation/perfusion (V′A/Q′) inequality 19.
Metabolic data at rest and at peak exerclse of 23 non-flow limited (non-FL) and 29 flow limited (FL) chronic obstructive pulmonary disease patients
In the FL patients, the Pa,CO2 during peak exercise was significantly (p<0.002) higher than at rest (table 4⇑). In contrast, in the non-FL patients, there was no significant change in Pa,CO2 during exercise. While most non-FL patients were normocapnic both at rest and during peak exercise, many FL patients were hypercapnic, especially during maximal exercise (fig. 2⇓). Hypercapnia (Pa,CO2>43 mmHg) 20 at peak exercise was present in 7/23 of the non-FL patients and in 21/29 of the FL patients (p<0.005). In FL patients, there was a significant fall in Pa,O2 from rest to peak exercise (p<0.05), whereas in non-FL patients the Pa,O2 did not change significantly. In both FL and non-FL patients, the PA–a,O2 increased significantly from rest to peak exercise (p<0.002, each).
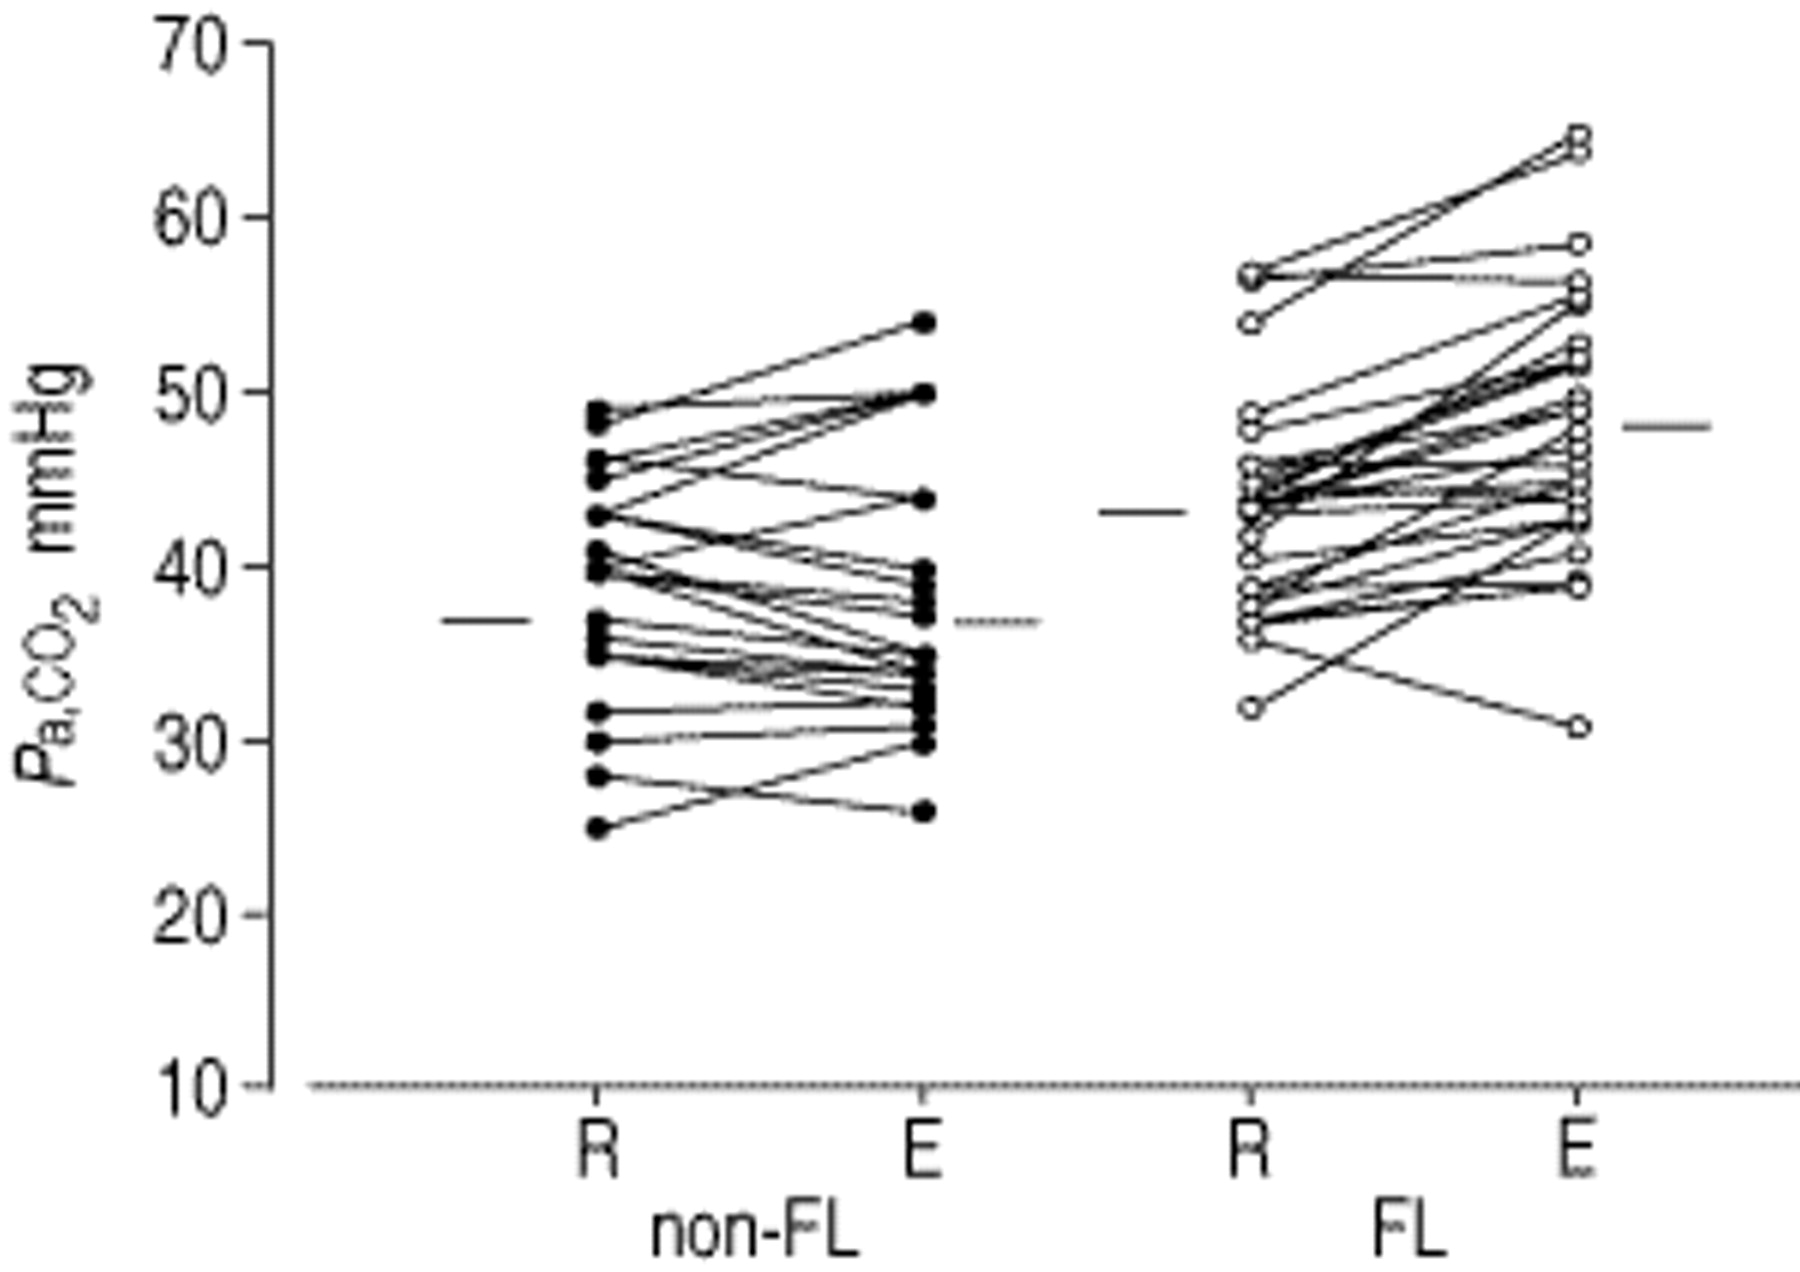
Changes in arterial carbon dioxide partial pressure (Pa,CO2) from rest (R) to peak exercise (E) in nonflow limited (non-FL) and flow limited (FL) patients. Bars indicate average values.
According to linear univariate regression analysis of non-normalized data for the whole patient population, VT,max was significantly correlated with several of the resting respiratory variables (table 5⇓). However, the strongest correlation (r=0.77) was with IC (fig. 3⇓) and with stepwise regression analysis, resting IC was selected as the only significant predictor. The overall regression was: where VT,max and IC are expressed in litres. When this analysis was performed separately on the two groups of COPD patients, IC was again selected as the only significant contributor to VT,max in both non-FL (r=0.76) and FL (r=0.70) patients. When VT,max and IC were expressed as per cent predicted normal, IC (% pred) was also selected as the only significant (r=0.58; p<0.001) contributor to VT,max (% pred) in the FL patients, but no variable was selected as predictor for non-FL patients based on stepwise regression analysis.
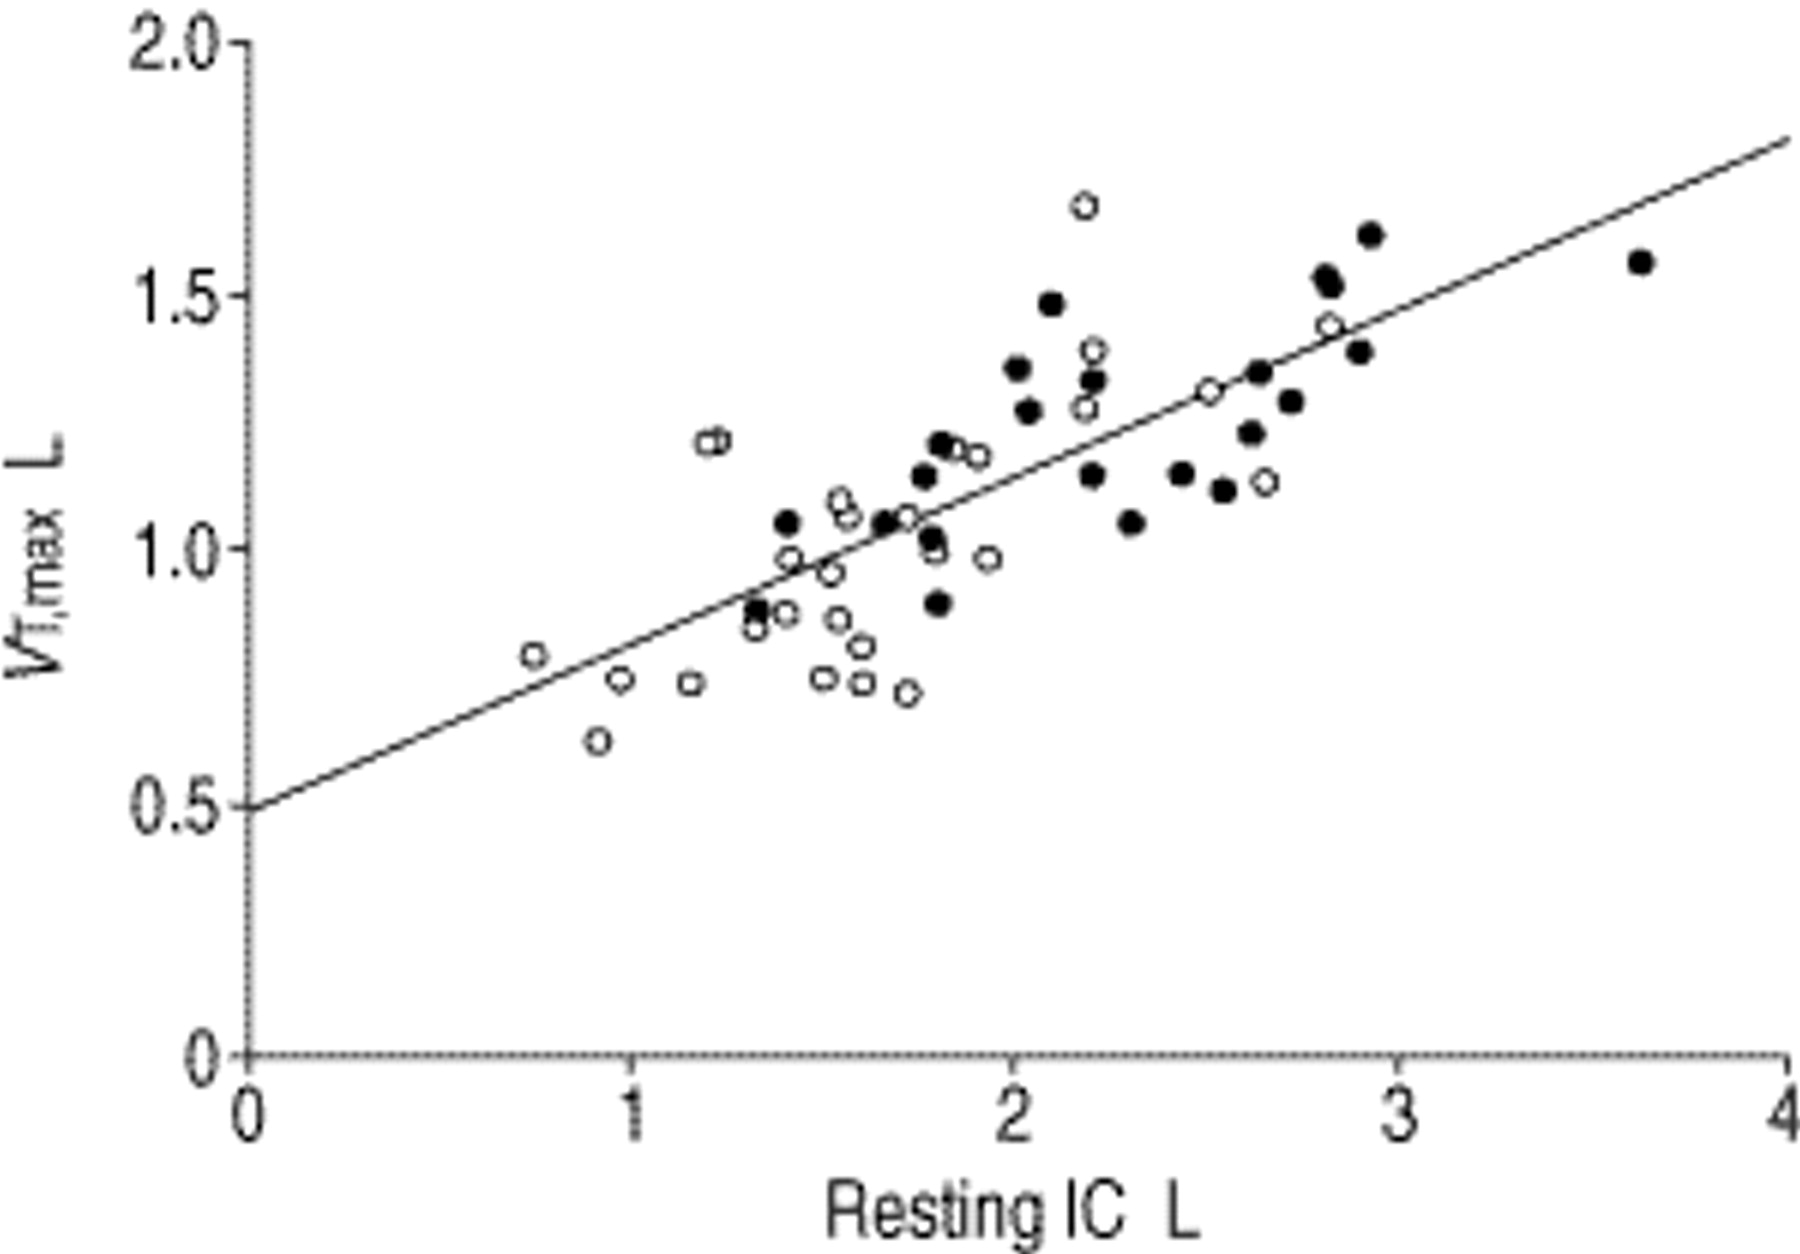
Relationship between peak exercise tidal volume (VT,max) and resting inspiratory capacity (IC) for chronic obstructive pulmonary disease patients without (non-FL; •) and with (FL; ○) tidal expiratory flow limitation during resting breathing. Regression line shown (VT,max=0.49+0.33 IC±0.17 (sem); r=0.77, p<0.0001).
Correlation (r) and determination (r2) coefficients of maximal tidal volume (VT,max) to resting respiratory variables in the 52 chronic obstructive pulmonary disease patients
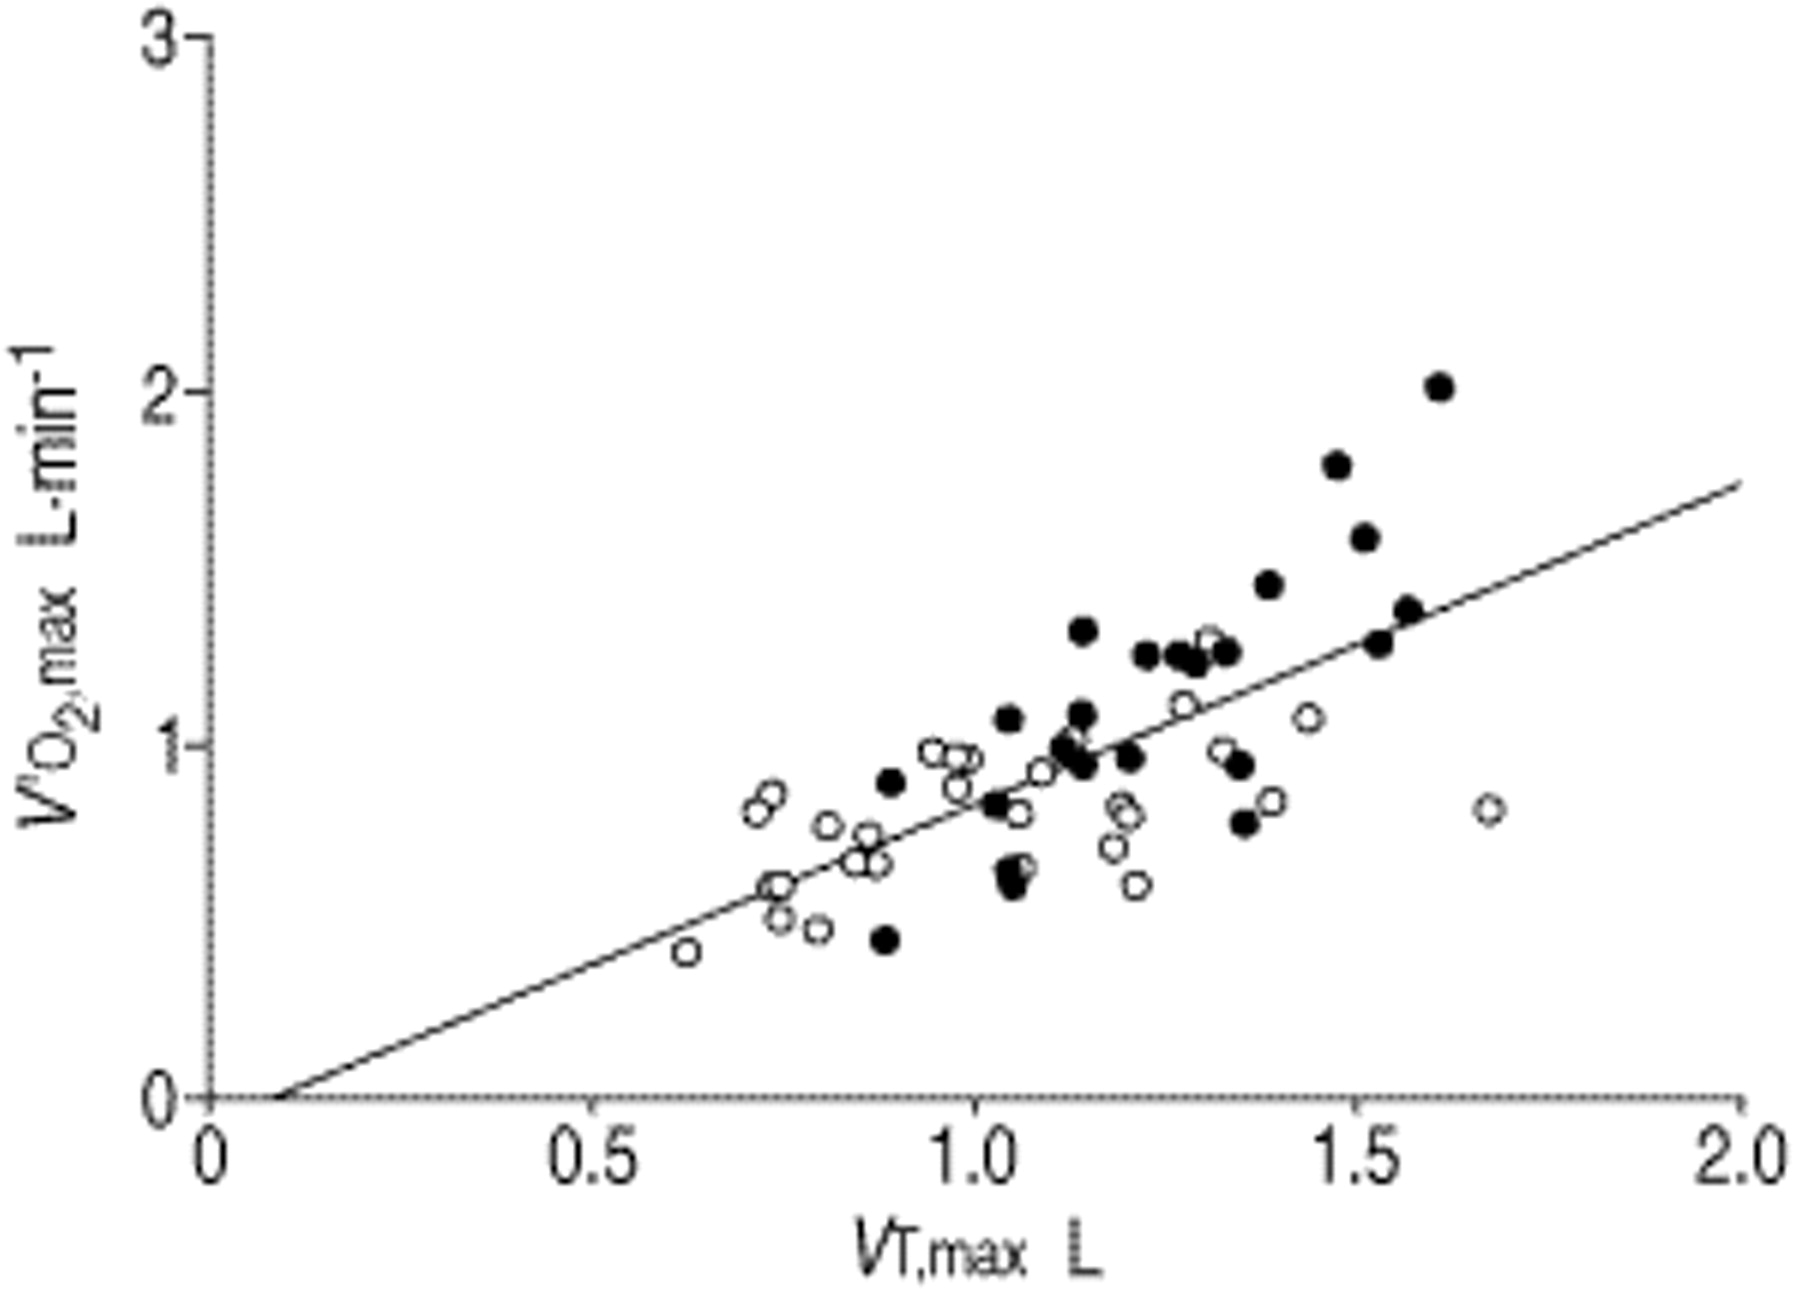
In line with Koulouris et al. 2, a significant correlation (r=0.70; p<0.0001) was also found between non-normalized values of V′O2,max and VT,max for the whole patient population (fig. 4⇓).

Relationship between maximal oxygen uptake (V′O2,max) and maximal tidal volume (VT,max) for chronic obstructive pulmonary disease patients without (non-FL; •) and with (FL; ○) tidal expiratory flow limitation during resting breathing. Regresison line shown (V′O2,max=−0.07+0.88 VT,max±0.23 (sem); r=0.70, p<0.0001).
Discussion
The main findings of the present study are that: 1) among the various resting respiratory variables studied (table 1⇑), only IC was a significant contributor to VT,max, as assessed by multiple regression analysis; and 2) at peak exercise, most of the FL patients were hypercapnic while most of the non-FL subjects remained normocapnic, the discrepancy being mainly due to the relatively low VT,max and consequent increase in VD/VT ratio exhibited by the FL patients.
The first observation explains, at least in part, the significant correlation of V′O2,max to IC previously described in the same patients of the present study 5. That study hypothesized that in COPD patients with FL at rest, VT,max should be limited by their reduced IC, a postulate which has been confirmed by the present data.
Several studies have shown that during exercise, COPD patients can exhibit almost any pattern of arterial blood gas changes from resting values 21–23. The present study showed that in FL patients, there was a significant increase in Pa,CO2 from rest to peak exercise, which was associated with a significant drop in Pa,O2. In contrast, in non-FL patients there were no significant changes in either Pa,CO2 or Pa,O2.
The determinants of the hypercapnia exhibited by the FL patients at peak exercise were analysed according to Equation 1. Although at peak exercise, both V′CO2 and V′E were significantly lower in the FL patients, the V′CO2/V′E ratio was exactly the same in both groups of patients (0.034±0.002), indicating that the increase in ventilation relative to the metabolic demand was similar. Since, in FL patients, hypercapnia was not associated with an increase in the V′CO2/V′E ratio as compared to non-FL patients, it follows that the increase in Pa,CO2 should reflect the higher VD/VT ratio (table 4⇑). As the values of VD at peak exercise did not differ between FL and non-FL patients, the higher VD/VT ratio of the FL patients should essentially reflect the significantly lower VT,max (table 2⇑).
As shown in figure 1⇑, the lower VT,max of the FL patients was due entirely to decreased VT/tI, since tI did not differ significantly from that of non-FL patients (table 2⇑). The lower VT/tI in the FL patients could be due to smaller neuromuscular inspiratory drive and/or greater inspiratory impedance. Data from Cloosterman et al. 23 suggest that inspiratory impedance limits VT/tI. They measured the neuromuscular inspiratory drive in terms of the inspiratory swing in pleural pressure divided by the time in which it was generated (PI/tI) in 50 COPD patients during an incremental exercise test. Their patients were grouped by those who, at peak exercise, exhibited an increase in Pa,CO2 relative to rest and those who did not. In patients with CO2 retention, the changes in VT/tI from rest to peak exercise were smaller than in the subjects without CO2 retention, but their concurrent increase in neuromuscular inspiratory drive was significantly greater. According to the present results, the COPD patients of Cloosterman et al. 23 who exhibited CO2 retention during peak exercise, should mainly represent individuals who exhibited FL at rest, supporting the notion that increased inspiratory load, rather than neuromuscular inspiratory drive, limits VT,max (and hence ventilation) in COPD patients who exhibited FL at rest. In fact, it is likely that during heavy exercise a ceiling effect occurs in patients with severe COPD, making the inspiratory reserve volume impossible to be lowered further. This was the basic postulate prompting the present study and a previous study 5, and is supported by the results of O'Donnell and Webb 4.
Considering the greater dynamic hyperinflation and concomitant intrinsic positive end-expiratory pressure (PEEPi) exhibited by FL patients 1–4, their inspiratory load should be increased because of PEEPi. High PEEPi values during exercise in the FL patients would also be expected to impair the cardiac output 24, contributing to exercise limitation. The present results suggest that this may be true, as V′O2,max/fC,max was significantly lower in the FL patients. It should be noted, however, that the latter could also be due to the lower V′O2,max in the FL patients. In fact, fC,max was lower than predicted in all patients.
While the above analysis suggests that in COPD patients, CO2 retention during peak exercise is due to increased inspiratory load and not decreased inspiratory drive, it has also been suggested that CO2 retention during exercise may limit VT,max per se, through a dyspnogenic effect 23, 25. However, this notion is controversial 26 and is not supported by the present results because at peak exercise no significant correlation between the Borg dyspnoea score and Pa,CO2 was found either in the whole patient population (r=−0.01) or in the subgroup of patients who exhibited FL at rest (r=−0.10). Furthermore, like Cloosterman et al. 23, this study also divided patients into those who did (n=33) and did not (n=19) increase their Pa,CO2 during exercise, and found no significant correlations between the Borg dyspnoea score and the increase in Pa,CO2 from rest to peak exercise, both in the whole population and in the subgroup of patients who exhibited FL at rest.
In 10 eucapnic COPD patients, Scano et al. 27 assessed the breathing pattern during CO2 rebreathing and progressive exercise on a cycle-ergometer. At a fixed V′E (28 L·min−1), they found a greater VT during CO2 rebreathing than exercise, which was due entirely to prolonged tI while VT/tI remained unchanged, and they attributed this difference to a change in the inspiratory off-switch mechanism. This, also, does not explain the present study's results. In fact, in the present FL COPD patients who were more hypercapnic during peak exercise, VT,max was smaller than in the non-FL subjects, and was associated with a similar tI but reduced VT/tI (fig. 1⇑).
In the COPD patients who exhibited FL at rest, the increase in Pa,CO2 at peak exercise was associated with a significant (p<0.05) drop in Pa,O2 while in the non-FL patients the Pa,O2 did not change (table 4⇑). An important question that is asked from exercise testing is whether exercise-induced hypoxaemia develops to the point that supplemental O2 is indicated 21. The present results suggest that in general, a drop in Pa,O2 during exercise mainly occurs in COPD patients who exhibit FL at rest.
In the present study, the COPD patients were stratified into two groups, i.e. patients with and without FL at rest. According to Koulouris et al. 2, in the latter group of patients, expiratory FL may occur at different levels of exercise. This may partly explain the heterogeneous changes in Pa,CO2 exhibited by the non-FL patients from rest to peak exercise (fig. 2⇑).
The intensity of dyspnoea at peak exercise was essentially the same in FL and non-FL patients (table 3⇑). This unexpected finding could be explained by the higher intensity of exercise in the non-FL patients (table 3⇑) and, consequently, the different ventilatory demand at which the two groups were compared (table 2⇑). These data are also consistent with the results of Killian et al. 28 and Cloosterman et al. 23 who found that many patients with very severe COPD stopped exercise primarily because of leg fatigue rather than dyspnoea. The higher leg fatigue Borg scores at peak exercise in the present FL patients probably reflect muscle weakness due to deconditioning and/or muscle dysfunction 29, 30. However, Cloosterman et al. 23 found a higher leg fatigue Borg score in the COPD patients without than with CO2 retention during peak exercise. This discrepancy probably reflects the different criteria used to stratify patients in the present study (presence or absence of FL at rest) and in the study of Cloosterman et al. 23 (increase in Pa,CO2 or not, at peak exercise, relative to rest). In fact, when the present study's patients were stratified into the two groups of Cloosterman et al. 23 (hypercapnic and nonhypercapnic responders), the leg fatigue scores were not significantly different (7.79±0.3 versus 7.26±0.3).
In conclusion, the present study shows that in chronic obstructive pulmonary disease patients who are flow limited at rest with a consequent decrease of inspiratory capacity, the maximal tidal volume, and hence maximal oxygen consumption, are reduced. These patients also exhibit a significant increase in arterial carbon dioxide partial pressure and reduction in arterial oxygen partial pressure during peak exercise.
- Received June 26, 2000.
- Accepted January 16, 2001.
- © ERS Journals Ltd
References


