


Abstract
Obstructive sleep apnoea (OSA) occurs because of recurrent narrowing and occlusion of the velopharynx (VP) during sleep. The specific cause of OSA is unknown. Cephalometric radiography, fibreoptic nasopharyngoscopy, acoustic reflection techniques, and computerized tomography have limitations (dynamic and tridimensional evaluation) in the mechanism of occlusion investigation. Static and dynamic examination of the soft tissue structures surrounding the upper airway during the respiratory cycle in wakefulness and sleep, can lead to a better understanding of the process.
Ultrafast magnetic resonance imaging (one image per 0.8 s) was used to study the upper airway and surrounding soft tissue in 17 patients with OSA during wakefulness and sleep, and in eight healthy subjects whilst awake.
The major findings of this investigation in the 25 subjects were as follows: 1) the VP was smaller in apnoeic patients, only during part of the respiratory cycle; 2) the variation in VP area during the respiratory cycle was greater in apnoeic patients than in controls, particularly during sleep, suggesting an increased compliance of the VP in these patients; 3) VP narrowing was similar in the lateral and anterior-posterior dimensions, both in controls and apnoeic patients while awake; apnoeic patients during sleep have a more circular VP upon reaching the minimum area; 4) there was an inverse relationship between dimensions of the lateral pharyngeal walls and airway area, probably indicating that lateral walls are passively compressed or stretched as a result of changes in the airway calibre; and 5) soft palate and parapharyngeal fatpads were larger in apnoeic patients, although their role in the genesis of OSA is uncertain.
It was concluded that changes in the velopharynx area and diameter during the respiratory cycle are greater in apnoeic patients than in normal subjects, particularly during sleep. This suggests that apnoeic patients have a more collapsible velopharynx, this being the main mechanism of obstruction.
This study was supported by GlaxoWellcome.
Obstructive sleep apnoea (OSA) occurs because of recurrent narrowing and occlusion of the upper airway during sleep 1, and the site of obstruction is most commonly at the level of the velopharynx (VP). Unfortunately, the specific cause of this obstruction is unknown 2–4. Cephalometric analysis 5, 6, which provides information on the morphology of the upper airway, does not allow dynamic evaluation. Fibreoptic nasopharyngoscopy with the Müller manoeuvre 4, 7, 8 allows a dynamic evaluation of the pharyngeal airway, but is usually performed with the patient awake, and the changes in pressure and shape during the manoeuvre are not necessarily representative of the physiological changes during quiet breathing. Acoustic reflection has been used to demonstrate increased effective compliance of the pharynx during wakefulness in OSA patients in response to changes in pharyngeal intraluminal pressure and lung volume 9, 10. A major limitation of the acoustic reflection technique is its inability to access the region of the VP.
Studies with computerized tomography (CT) 2, 11, 12 and magnetic resonance imaging (MRI) 3, 13, 14 have detected structural upper airway narrowing in awake patients with OSA. It has been shown that the apnoeic airway has a circular or elliptic cross-sectional configuration, with the major axis oriented in the anterior-posterior dimension (lateral narrowing) 13, 14. Adipose tissue deposition adjacent to the pharyngeal wall has been suggested as one of the mechanisms of airway compression in obese apnoeic patients, with or without an increased collar size 15, 16. Most of these MRI studies, however, have been carried out by scanning over ∼3 min during awake nasal breathing. As a result, multiple respiratory cycles were involved and mean values were measured. Since apnoea and the respiratory cycle are dynamic processes, the findings to date are not necessarily applicable to what truly happens to patients during spontaneous physiological sleep. A study involving shorter scanning periods would provide a more realistic impression of the process. The recent advent of ultrafast MRI techniques has provided a means of obtaining multiple images at multiple locations with sufficient image quality and temporal resolution to allow a dynamic assessment of the pharyngeal musculature. Since these structures might be different during sleep and wakefulness 17, both states must be observed. As far as the authors are aware, no studies of OSA that have used ultrafast MRI have been carried out in patients during spontaneous sleep. Only one study used high-speed MRI to examine apnoeic patients who were asleep 18. However, as patients were given a sedative to fall asleep, the result may have been biased by the presence of the drug.
This report describes the use of ultrafast MRI for dynamic evaluation of the upper airway of OSA patients during wakefulness and spontaneous sleep, and in normal awake subjects, in order to characterize size and configuration of the VP and soft tissue in the different phases of the respiratory cycle or apnoea, as well as during sleep and awake periods. It was hypothesized that changes during the respiratory cycle in upper airway structure (shape and calibre) at the retropalatal level (VP) are different in OSA patients (awake and sleeping) and in normal awake subjects.
Methods
Between January 1994 and April 1996, a total of 17 patients with the diagnosis of OSA, and eight healthy subjects, agreed to participate in the MRI study. Inclusion criteria consisted of proved OSA as determined by the apnoea/hypopnoea index (AHI) >10·h−1, a morphotype allowing enclosure in the MRI cylinder, and absence of previous continuous positive airway pressure (CPAP) therapy or upper airway surgery. Control subjects were aged 30–50 yrs, with a body mass index (BMI) of 25–30 kg·m−2, a 2% desaturation index of <5·h−1 on overnight home oximetry and no history of habitual snoring, daytime hypersomnolence, or upper airway surgery, were included. All subjects underwent a thorough history (including the Epsworth somnolence questionnaire) and physical examination. The protocol was approved by the ethical review committee of the participating hospitals and each subject gave written informed consent before entering the study.
Polysomnography
Polysomnography was performed for one night on all patients with OSA in the Neurophysiology Unit of Hospital Luis Alcañiz (Játiva), using a 21-channel polygraph (Medelec, model 1A98, Surrey, UK). Sleep (and its various stages) was documented by standard electroencephalographic (EEG), electro-oculographic (EOG), and electromyographic (EMG) criteria. EEG was recorded with electrodes applied at C3-A2 and C4-A1 (according to international 10-20 System) 19. EMG activity was recorded from the genioglossus, anterior tibial, and diaphragm muscles. Apnoea was defined as cessation of airflow at the nose (two thermistors) and mouth (one thermistor) for longer than 10 s. Hypopnoea was defined as a 50% reduction in airflow for 10 s associated with a >4% fall in oxygen saturation and/or an arousal. Apnoea and hypoponea were obstructive when they occurred in the presence of (and usually progressively accentuated) thoracoabdominal movements. A single electrocardiogram (ECG) lead (modified V2) was monitored to detect cardiac arrhythmias. The polysomnograms were scored according to criteria of Rechtschaffen and Kales 19 by a specialist in clinical neurophysiology.
Magnetic resonance imaging
Patients were examined at the Diagnostic Imaging Service of Hospital General Universitario (Valencia) under continuous supervision by a radiologist and a pneumologist. Patients were refrained from sleep for 20 h prior to MRI studies and were not allowed to ingest alcohol or sedatives the day before the procedure. MRI was performed with a 1.5 T superconducting magnet (Horizon Echo-Speed, General Electric Medical System, Milwaukee, WI, USA). The sequences were acquired as follows: 1) Sagital localizer on the mid-line: spoiled gradient echo (SPGR), time repetition (TR) 18 msec, time of echo (TE) 40, field of view (FOV) 28 mm×28 mm, 10 mm thickness (THK), 256×128, 1 excitation. 2) Three sets of images were taken on this plane; in the VP, glossopharynx and hypopharynx with the following technique: 2D fast spoiled gradient echo (FSPGR) with multiphase, TR 9 msec, TE 4.2 msec, flip angle (FA) 30, band width (BW) 32 Khz, FOV 24 mm×18 mm, 10 mm THK, 60 phases, 256×128, 1 excitation, each set being taken in 57 s. Respiratory motion was monitored with a magnetic resonance (MR)-linked cuff placed around the ribcage. The respiratory gating system shows the respiratory cycle on the operators screen; it cannot be recorded on paper or video. The crest of the wave corresponds to inspiration and the valley to expiration. The system is calibrated every month by General Electric Medical System (GEMS) according to the clearance instructions of the Food and Drug Administration (FDA). Oxygen saturation was measured by a pulse oximeter (Model 8600FO, Nonin Medical Inc., Minneapolis, MN, USA), and snoring by the microphones of the MRI cylinder. Subjects were positioned supine with the head in a neutral anatomical position secured with tape. Examination was carried out with the subject first awake, and then asleep.
Patients and healthy controls were instructed to refrain from swallowing during scanning and to breathe through their nose with the mouth closed. Baseline oxygen saturation was determined. Wakefulness was documented through patient response to questioning by the radiologist; such verbal stimulation was made whenever it did not interfere with image acquisition, usually every minute, exceptionally after more than every minute, and at least every 3 min. Sleepiness was documented when snoring was heard through the microphones of the cylinder and when a decrease of ≥4% in oxygen saturation was registered. During the previous polysomnographic study, snoring and the decrease in oxygen saturation were observed to take place only when patients were asleep. Sagittal images centred about a midsagittal plane with adequate visualization of the C1 vertebra, and transverse images centred at the VP, were obtained using fast spoiled gradient multi-phase echo sequences with a posterior and anterior neck coil (Neurovas, Medrad Inc., Pittsburgh, PA, USA) and phased array dual connector (multichannel Medrad). The VP was defined from the level of the hard palate to the caudal margin of the soft palate. Images were acquired at the rate of one image per 0.8 s. Patients with OSA were then instructed to fall asleep spontaneously. To aid the onset of sleep, the authors completely darkened the MRI room and had the patients wear earplugs and headbands to minimize the machine noise.
Image analysis
Two observers measured airway and soft tissue structure dimensions after a previous selection of the most appropriate images, where different structures were clearly visible. The limits of these structures were traced by hand and a region of interest (ROI) was generated. The computer then adjusted each point around the circumference of this original ROI to determine an objective edge of the structure at that location, and a new ROI was generated. The authors could then quantify the area of the final ROI. A workstation with image processing software (Sun-Sparcs 20, Sun Microprocessor, Milwaukee, WI, USA) was used for MRI measurements. The measurements were validated by Advantage Windows (Sun Microsystems, Milwaukee, WI, USA). Areas and diameters were measured on two different occasions yielding a mean percentage variation of 4.1%. Measurements made from transverse MR images included the VP lumen (fig. 1⇓; area and anterior-posterior and lateral diameters), lateral pharyngeal wall width, and parapharyngeal fatpad area. The temporal resolution of the study allowed two measurements (maximum and minimum) to be obtained for the area and diameters of the VP and the lateral pharyngeal walls (fig. 2⇓). These changes in images went parallel to the respiratory motion monitored with the MR linked cuffs (GEMS) placed around the ribcage, and were observed to represent both different phases of the respiratory cycle and apnoeic episodes in asleep patients. The lateral pharyngeal wall width was defined as the distance between the lateral edge of the airway and the medial margin of the parapharyngeal fatpads, and was calculated both when the airway lumen was maximal and minimal. This calculation was performed for both the left and right lateral pharyngeal walls and the data were summed to determine the total pharyngeal wall thickness. Parapharyngeal fatpad areas were only calculated in apnoeic patients during wakefulness and expressed as the sum of the fatpads on each side. From sagittal MR images, the soft palate area and length were measured in healthy subjects and apnoeic patients.

Axial magnetic resonance image of the velopharynx in which the area and parapharyngeal fat pads have been limited by hand generating a region of interest.
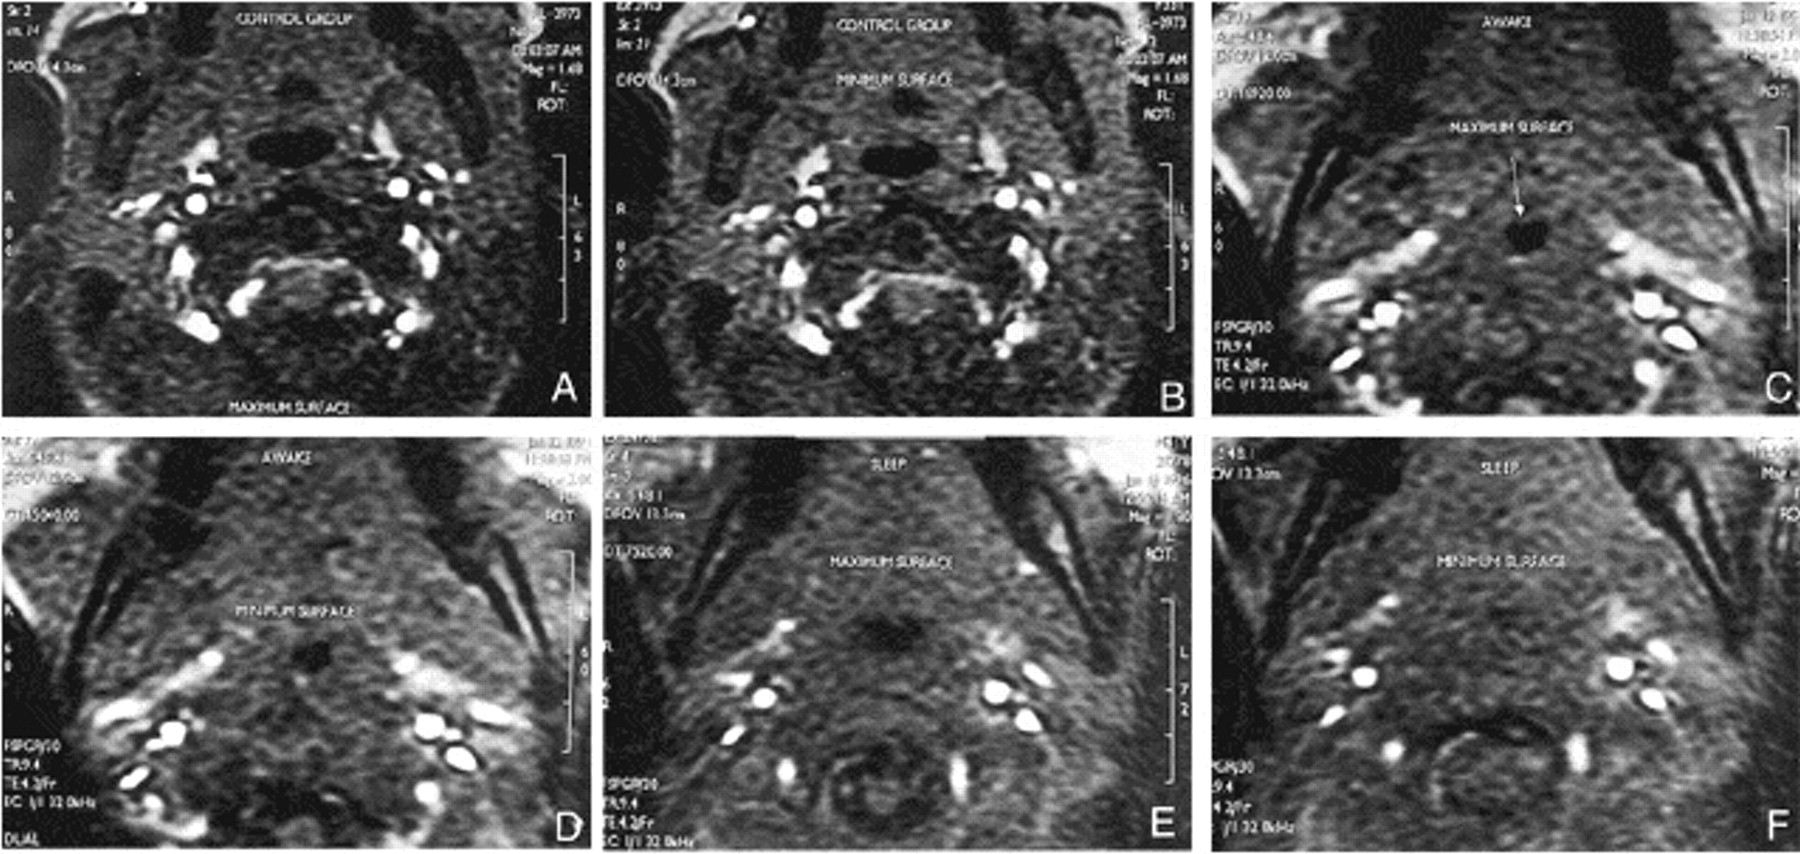
Comparison of an axial magnetic resonance image in the velopharynx region of a normal subject showing A) maximum and B) minimum area, an awake apnoeic patient showing C) maximum and D) minimum area and a sleeping apnoeic patient showing E) maximum and F) minimum area.
Statistical analysis
Statistical comparisons between pairs of means were performed via paired t‐tests. For comparisons of more than two means, a one-way analysis of variance (ANOVA) was used, and when statistically significant differences were found, the Bonferroni multiple-range test was applied to detect the statistically different groups. A probability level of p<0.05 was considered to be statistically significant. The independent contribution of obesity (BMI) and AHI to airway dimensions was assessed in a multivariate analysis using forward stepwise multiple linear regression.
Results
In the group of 17 patients with OSA, there were 14 males and three females with an age (mean±sd) of 46.4±9 yrs (range 31–64). Apnoeic patients had a BMI of 29.8±3.8 kg·m-2, Epsworth index of 19, and AHI of 70.4±29. The group of healthy subjects included six males and two females with an age of 39.0±8 yrs and BMI of 27.8±4 kg·m−2. There were no statistically significant differences in BMI and age between healthy subjects and apnoeic patients. All healthy subjects had an Epsworth index <4.
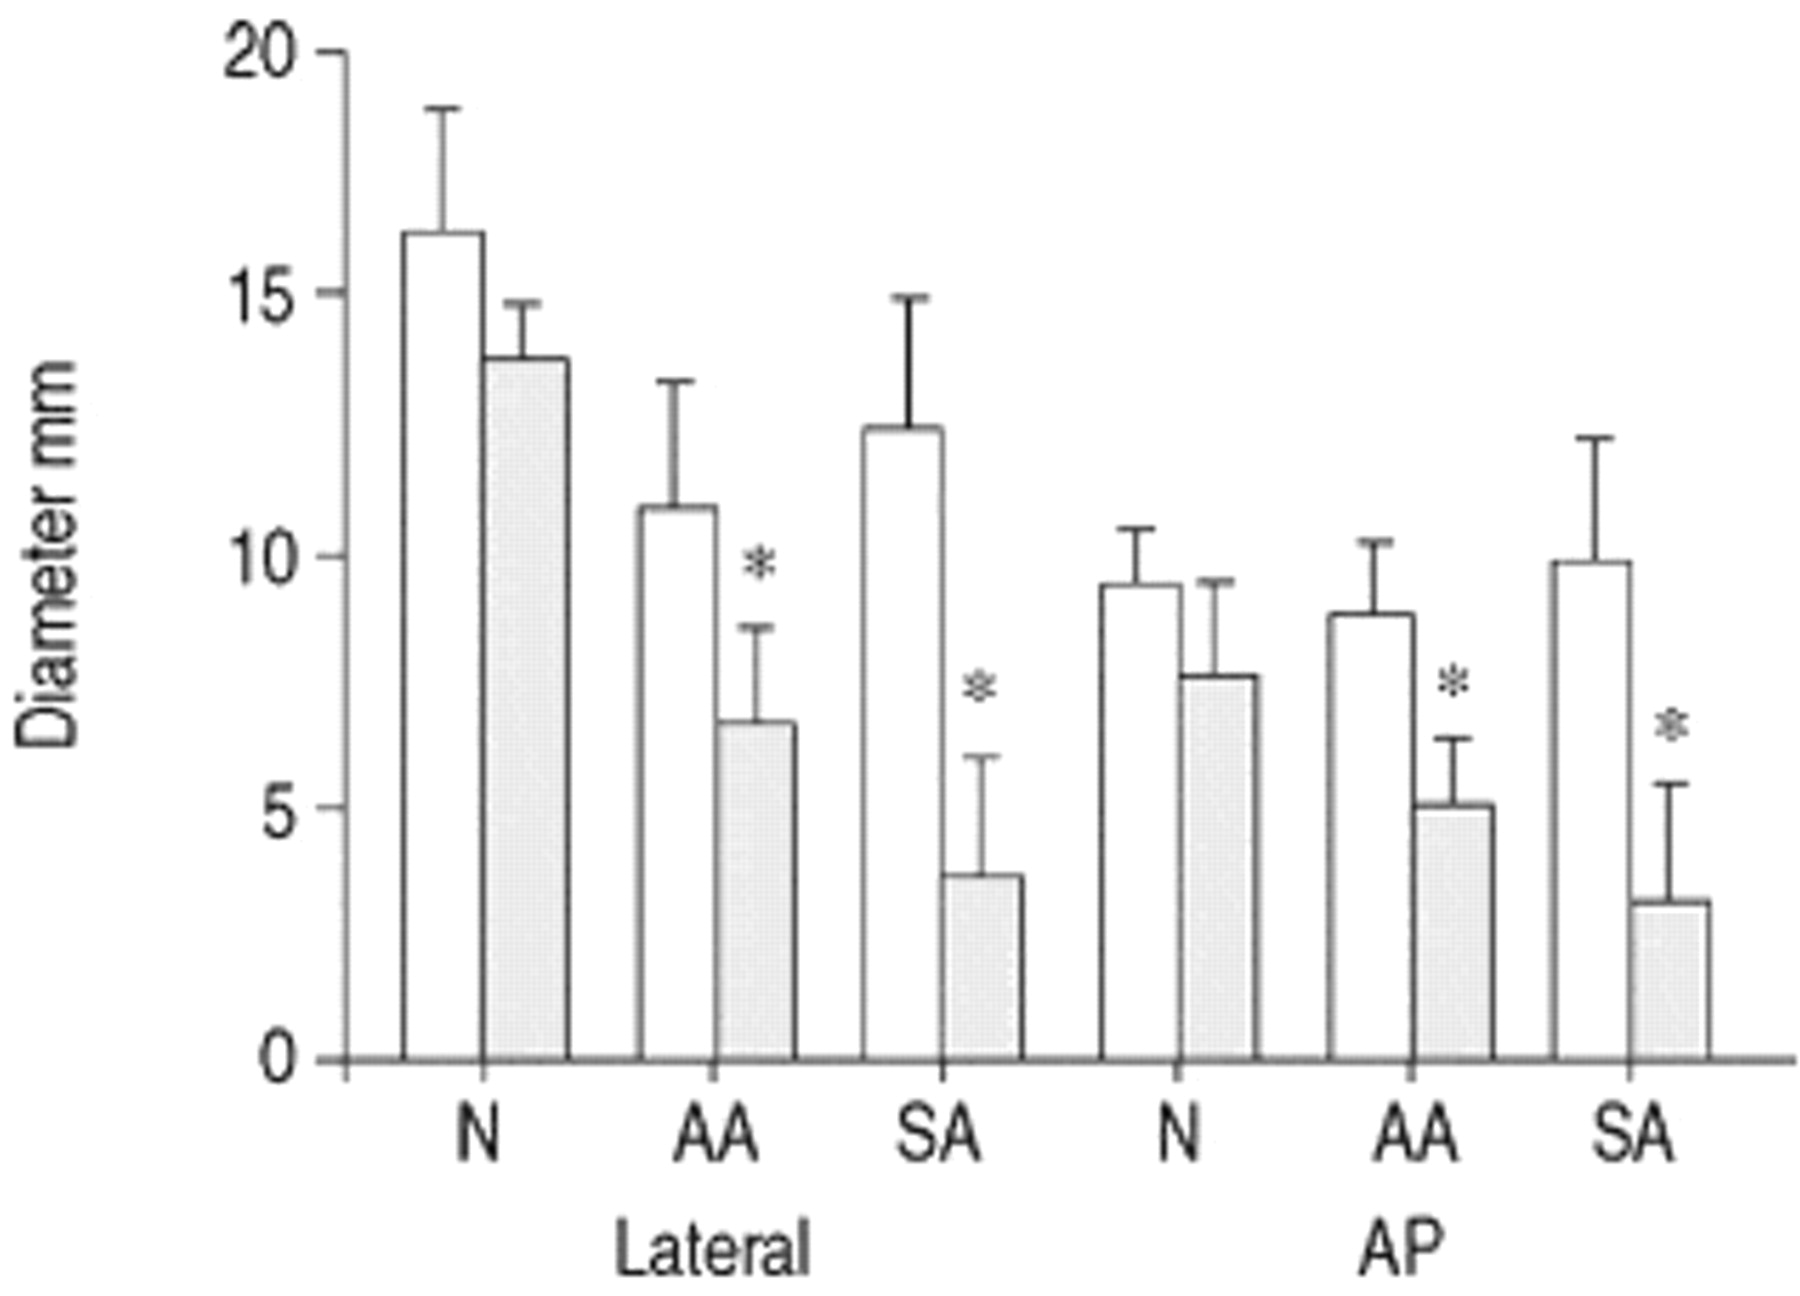
Pharyngeal dimensions from MRI in the study population are shown in table 1⇓. There were no statistically significant differences in maximum area of the VP among healthy subjects, awake apnoeic patients, and asleep apnoeic patients, whereas minimum area of the VP was significantly different between the groups (p<0.0001, ANOVA). It was significantly larger in controls (103±10 mm2) than in both awake (35±23 mm2) and asleep apnoeic patients (15±19 mm2) (fig. 3⇓). The decrease in the VP area from the maximum to the minimum values was significant in all the groups and varied from 12% in control subjects to 57% in awake apnoeic patients and 85% in apnoeic patients during sleep (fig. 4⇓). In healthy subjects, maximum and minimum values of both anterior-posterior and lateral diameters of the VP were similar. In contrast, as shown in figure 5⇓, minimum VP diameters were significantly lower (p<0.05, paired t‐test) than maximum in apnoeic patients, particularly during sleep. The variation between maximum and minimum values during wakefulness and sleep was 42 and 72%, respectively, for the anterior-posterior diameter, and 37 and 74%, respectively, for the lateral diameter. According to the anterior-posterior/lateral diameter ratio, healthy subjects had an elliptic configuration of the VP with the major axis oriented in the lateral dimension, while apnoeic patients had a more circular configuration, particularly during sleep when the VP area is minimal (fig. 6⇓).

Comparison of maximum and minimum areas of the velopharynx in healthy subjects (□) and patients with obstructive sleep apnoea during wakefulness (└) and sleep (┘). Data expressed as mean±sd. *: significant difference between groups (p<0.0001). +: Significant difference between awake and sleeping apnoeic subjects (p<0.05).

Comparison of maximum (□) and minimum (┘) areas of the velopharynx within the same population. Data expressed as mean±sd. *: significant difference (p<0.01) between maximum and minimum areas in the three populations.

Comparison of maximum (□) and minimum (┘) lateral and anterior-posterior (AP) diameters of the velopharynx in healthy subjects and patients with obstructive sleep apnoea during sleep and wakefulness. Data expressed as mean±sd. N: normal; AA: awake apnoeic; SA: sleeping apnoeic. *: Significant difference (p<0.05) between maximum and minimum diameters within the same population.

Schematic representation of the velopharynx changes in size and shape during the respiratory cycle within the three populations. The two rings refer to maximum and minimum sizes. The lateral (L) and anterior-posterior (AP) diameters are expressed in mm. N: normal; AA: awake apnoeic; SA; sleeping apnoeic.
Airway and soft tissue dimensions from magnetic resonance imaging in patients with obstructive sleep apnoea during sleep and wakefulness and in healthy subjects
The values in lateral pharyngeal wall width were higher when the area of the VP was minimal. When the area of the VP was maximal, lateral pharyngeal wall thickness was significantly higher in apnoeic patients during sleep (27.4±9 mm) than in healthy subjects (18.7±3.5 mm) (p<0.05), but when the area of the VP was minimal, significant differences (p<0.01) among the three groups were found (healthy subjects 22.3± 3.5 mm; awake apnoeic patients 27.9±7.1 mm; asleep apnoeic patients 36.8±9.9 mm, fig. 7⇓). There is an inverse relationship between pharyngeal wall width and lumen of the VP (r=−0.67, p<0.001) in the three groups of subjects. The values obtained for parapharyngeal fatpad, soft palate area, and soft palate length measurements were significantly higher in awake apnoeic patients than in healthy subjects (p<0.05; table 1⇑). In the multivariate stepwise regression analysis, neither BMI nor AHI have a significant relationship with the airway dimensions in patients with OSA.

Comparison of pharyngeal wall width when the velopharynx is maximum (Max width) and minimum (Min width) in healthy subjects (□) and patients with obstructive sleep apnoea during wakefulness (┘) and sleep (└). Data expressed as mean±sd. *: significant difference (p<0.05) between pharyngeal wall width (when maximal velopharynx area) in normal and sleeping apnoeics and (minimal velopharynx area) in the three groups. **: significant difference (p<0.01) between pharyngeal wall width (when minimum velopharynx area) in normals and sleeping apnoeics.
Discussion
The present results demonstrate that the VP area is smaller among OSA patients only during part of the respiratory cycle, and that this difference increases during sleep. The apnoeic patients have a more circular VP, compared to the elliptical shape of the controls, particularly during sleep and the minimum VP area. Thickness of lateral pharyngeal walls varied inversely to airway lumen. This probably indicates that pharyngeal walls are passively compressed or stretched as a result of pressure changes in the airway lumen.
MRI is a noninvasive technique that provides a means of obtaining accurate resolution and image quality of soft tissue structures of the neck. To the authors’ knowledge, no studies of OSA that have used MRI have been carried out in patients during spontaneous sleep. The present study has significant limitations resulting from the difficulty of precisely confirming patient sleep-wakefulness, and the fact that no precise correlation was possible between the different VP images obtained and the corresponding phases of the respiratory cycle. Both limitations were, in turn, attributable to shortcomings of the technology employed.
Although the patients wore earplugs and headbands to minimize the noise of the machine during the acquisition of images, and since there was a high degree of somnolence, ending of the procedure had to be anticipated in five patients, and only two patients were unable to fall asleep. Sleep and wakefulness were monitored through the patients’ answers to verbal orders, snoring and desaturations. Wakefulness was reasonably determined by answering questions usually every minute and the absence of snoring and desaturations. The sleeping state was documented with snoring and desaturations, since for these patients the previous polysomnography documented that this happened only when they were asleep. During the acquisition of MR images, it was impossible to be sure if the patient is sleeping or awake, since an EEG cannot be carried out (the only method that allows confirmation of the state of the patient). A method was used that reasonably indicated the patient’s state. Staley 20 has described a method to monitor the patient’s situation (asleep or awake) in the MRI using a latex balloon secured to the palm of the hand with a glove. Lack of response to the periodic inflation of the balloon signified sleep. The authors preferred to monitor the waking state by means of answering a verbal stimulus that was directed to the patient at least every 3 min. However, the interval between verbal stimuli was marked by the time needed for MR imaging (to avoid interfering with the image acquisition), usually one minute. So, the intervals of verbal communication with the patient, that assured the waking state, were usually every minute and in all the cases at least every 3 min.
Upper airway areas and diameters were measured by two investigators from stored images, and although the limits of these structures were traced by hand, measurements were carried out on two different occasions yielding a nonsignificant variability (mean of 4.1%). In addition, the rapid acquisition rate (one image per 0.8 s) provided various images every respiratory cycle. Regarding the VP area, the maximum and minimum values were selected, which corresponded to different phases of the respiratory cycle. Since simultaneous video or graphic recording of the VP images and respiratory movements was not possible, precise correlation of the respiratory cycle phase to the maximum and minimum values of VP area could not be made. Nevertheless, it was confirmed that the VP images obtained in cine-mode varied simultaneously with the respiratory movements. In asleep apnoeic patients, minimum values higher than zero were occasionally obtained, probably because the precise moment of occlusion of the airway was not registered, or the patient presented hypopnoea. Respiratory airflow could not be measured, and it was not possible to determine either the time corresponding to a VP area of 0, or whether significant desaturation followed; consequently, the minimum VP diameters could not be related to possible episodes of apnoea or hypopnoea. Maximum values in asleep patients varied between 191 and 28 mm2, higher values may be interpreted as the effort to reopen the airway at the termination of apnoea in some patients, being the lower value similar to that observed in awake patients.
The results of VP cross-sectional area are similar to those obtained by others. There were no statistically significant differences in maximum area of VP between healthy subjects and patients with OSA, although the minimum area was diminished in apnoeic patients especially during sleep. In this sense, Stauffer et al. 21 assessed pharyngeal cross-sectional area at functional residual capacity during wakefulness by CT, and no measure differed significantly between patients with OSA and controls. This suggested that a functional impairment of the pharynx, namely the inability to dilate on inspiration, may be present during wakefulness and even more pronounced during sleep.
The decrease in the VP area from the maximum to the minimum values varied from 12% in control subjects to 57% in awake apnoeic patients and 85% in apnoeics during sleep. This probably indicates increased effective compliance of pharyngeal walls in apnoeic patients principally during sleep, and/or an increase in upper airway resistance associated with nasal obstruction and/or abnormal mandibular positioning and tongue hypertrophy. This phenomenon is produced, in part, because compliance of the pharynx increases during sleep due to reduced activity of pharyngeal dilator muscles. Bradley et al. 10, using the acoustic-reflection technique, showed that, when lung volume decreased from functional residual capacity to residual volume, pharynges of patients with sleep apnoea were more collapsible than those of snorers without sleep apnoea and control subjects. Ryan and Love 4 used dynamic upper airway videoendoscopy in obese patients with OSA during a maximal vital capacity manoeuvre and found a more collapsible VP than in nonapnoeic control subjects. In these studies, however, patients were examined during wakefulness so that activity of the upper airway muscles cannot be excluded and, on the other hand, resistance of the upper airway may be altered by insertion of the nasopharyngoscope.
With regard to configuration of the airway, Rodenstein et al. 13 studied the pharynx using MRI, in sleep apnoea patients, simple snorers, and healthy subjects, on the midsagittal section and six transverse sections equally spaced from the hard palate to the base of the epiglottis. Although no statistically significant differences were found in the minimal pharyngeal area among the three groups, airway narrowing secondary to a reduction in the lateral diameter, which determined an elliptical shape of the pharynx with the long axis oriented in the sagittal plane, was observed in patients with sleep apnoea. However, when studies are centred in the VP and values obtained at other levels are not meaned, as in the study of Ryan and Love 4, both OSA patients and control subjects develop a more circular airway shape during the maximal vital capacity manoeuvre, due to a greater reduction in lateral than anterior-posterior diameters. In the present study, healthy subjects had an elliptical airway and apnoeic patients a more circular configuration, particularly during sleep when the VP area is minimal and when muscle activity is inadequate to maintain the patency of the airway.
Schwab et al. 14 reported that at the minimum airway area, thickness of the lateral pharyngeal muscular walls rather than enlargement of the parapharyngeal fatpads was the predominant anatomic factor causing airway narrowing in apnoeic subjects. Subsequently, Leiter 22 indicated that in awake subjects, the absence of effective muscles along the lateral aspect of the upper airway meant that the movement of the lateral walls was determined by the transmural pressure in the upper airway, and that the lateral walls collapsed inward during inspiration and dilated during expiration. During sleep in patients with sleep apnoea, inward collapse of the posterior and lateral walls of the pharynx is the dominant upper airway movement during apnoeic episodes. The present findings of an inverse relationship between pharyngeal wall width and lumen of the VP, probably indicating that lateral walls are passively constrained or stiffened as a result of changes in the intraluminal pressure, are in line with Leiter 22. In a further study, Schwab et al. 23 analysed the effect of CPAP on the soft tissue structures surrounding the upper airway using MRI, and reported that the lateral pharyngeal walls were more “compliant” than the soft palate and tongue, and that airway enlargement was greater in the lateral than in the anterior-posterior dimension.
The present findings of a slight increase in parapharyngeal fat in apnoeic patients, as compared with healthy subjects, are similar to those obtained by Horner et al. 24 and Shelton et al. 25. However, as stated by Schwab et al. 14, fatpad-to-fatpad distance was not reduced in patients with OSA and, moreover, maximal area of the VP was similar in apnoeic patients and healthy controls. This indicates that, although parapharyngeal fatpads may be enlarged in patients with sleep apnoea, the upper airway is not compressed by the extra fat adjacent to its walls. Improvements in sleep apnoea associated with weight loss in obese patients, may be explained by a decrease in muscle mass, improvement of airway compliance (decreased fat infiltration of the pharyngeal walls), and probably a reduction in the size of the soft palate and the tongue. In the present study, like others 13, 14, there was an increased size of the soft palate in apnoeic patients as compared with healthy controls. However, the relationship of this increased soft tissue structure and airway narrowing is unclear.
The lack of relationship between morphological parameters and BMI and AHI is similar to other reports 22, 26, which, in addition to morphological changes, also suggested a role was played by other factors, such as airway compliance, pharyngeal muscle activity, and central respiratory neuronal response to changes in the level of airway patency, and Pa,O2, Pa,CO2, and pH.
Techniques of mandibular and tongue protrusion probably increase upper airway calibre predominantly in the hypopharynx and oropharynx, while having a more variable effect on VP lumen 27, 28. According to Conradt et al. 28, the effectiveness of maxillomandibular advancement is probably due to a combination of a change in tension in the suprahyoid and VP muscles, even if the mechanical enlargement of the posterior airway space contributes to that effect. The present results also confirm that the main differences between patients with sleep apnoea and healthy subjects are related to minimum area of the VP, supporting therapeutic approaches that improve pharyngeal collapsibility.
In summary, dimensions and configuration of the upper airway in apnoeic patients, particularly during sleep, were different than in healthy subjects (i.e. smaller minimum area of the velopharynx and a more circular shape). This suggests that apnoeic patients have a more collapsible velopharynx, which tends to occlude the upper airway.
The inverse relationship between dimensions of the lateral pharyngeal walls and airway area probably indicates that lateral walls are passively constrained or stiffened as a result of changes in the airway lumen. Magnetic resonance imaging studies may contribute to the understanding of the mechanisms of apnoea in patients with obstructive sleep apnoea, especially when ultrafast techniques are used with the asleep patient.
Acknowledgments
The authors would like to thank M. Pulido, E. Marti and E. Morcillo for editing the manuscript and editorial assistance, and J.E. Peris for statistical advice.
- Received July 7, 1999.
- Accepted July 15, 2000.
- ©
References


