Article Text

Abstract
Background The effect of smoking cessation and smoking relapse on lung density was studied using low-dose CT.
Methods Spiral, multidetector, low-dose CT was performed on 726 current and former smokers (>20 pack-years) recruited from a cancer screening trial. Lung density was quantified by calculating the 15th percentile density (PD15), which was adjusted to predicted total lung capacity. Data were analysed by linear regression models.
Results At baseline mean PD15 was 45 g/l in former smokers (n=178) and 55 g/l in current smokers (n=548), representing a difference of 10 g/l (p<0.001). After smoking cessation (n=77) PD15 decreased by 6.2 g/l (p<0.001) in the first year, and by a further 3.6 g/l (p<0.001) in the second year, after which no further change could be detected. Moreover, the first year after relapse to smoking (n=18) PD15 increased by 3.7 g/l (p=0.02).
Conclusions Current smoking status has a major influence on lung density assessed by CT, and the difference in lung density between current and former smokers observed in cross-sectional studies corresponds closely to the change in lung density seen in the years after smoking cessation. Current smoking status, and time since cessation or relapse, should be taken into account when assessing the severity of diseases such as emphysema by CT lung density.
- CT
- densitometry
- emphysema
- imaging/CT MRI, etc
- pulmonary emphysema
- smoking cessation
- tobacco and the lung
Statistics from Altmetric.com
The lung contains air and therefore the density of lung tissue is low. Changes in lung density are important characteristics of lung diseases such as emphysema, pneumonia and pulmonary fibrosis. CT is ideal for density measurements because it is based on the attenuation of x-rays, which is closely related to the density of the tissue that is penetrated by the x-rays. CT is thus essentially densitometry, and the grey tones of the CT images visualise the densities of the picture elements (pixels). Therefore, CT densitometry has been used to monitor diseases such as emphysema in which loss of lung tissue plays a central role.1 2 However, the effect of smoking behaviour on lung density has not yet been fully investigated, and this may play a role in the evaluation of the severity and progression of lung diseases such as emphysema.
Pulmonary emphysema is a condition characterised by low lung density. It is defined as abnormal, permanent enlargement of airspaces distal to the terminal bronchioles, accompanied by the destruction of their walls and without obvious fibrosis.3 Emphysema leads to loss of pulmonary function (eg, decline in forced expiratory volume in the first second; FEV1), which leads to respiratory insufficiency and ultimately death.4 The precise mechanism behind the destruction of alveoli and the development of emphysema from smoking is not fully understood. Recent studies have highlighted the central role of inflammation in the pathogenesis of chronic obstructive pulmonary disease (COPD).5 6 Smoking is believed to be the main cause of inflammation both in the lung and systemic.7 8 Inhaled steroids have shown little effect in the treatment of COPD,9 and abstaining from smoking remains the most important intervention.10 Studies have shown smoking cessation to have a beneficial effect on cough, sputum production and FEV1.11 In their landmark study, Fletcher and Peto12 observed that decline in FEV1 decreased after smoking cessation. More recently, these findings were reproduced in another large landmark study, the Lung Health Study; which showed a slight increase in FEV1 during the first 2 years after smoking cessation, followed by a smaller decline in FEV1 thereafter, compared with continuous decline in smokers who continued to smoke.13 These findings underline the importance of smoking cessation in the treatment and prognosis of COPD.
The effect of smoking cessation on the underlying inflammation present in COPD patients remains a matter of debate. Some studies have found that some inflammation may persist following smoking cessation,14 15 whereas others have reported a clear reduction in inflammatory biomarkers in both blood and bronchial fluids.16 However, it is generally believed that inflammation plays an important role in the development and progression of emphysema, and that smoking cessation interferes with inflammatory mediators.17 Most studies to date have focused on pulmonary function tests, blood samples and bronchial fluids, and little is known about the short-term morphological changes that occur in relation to changes in smoking behaviour.
The purpose of our study was to evaluate the short-term effect of changes in smoking behaviour on lung density, both cross-sectionally and longitudinally, using repeated CT scans.
Methods
Study population
The study population was selected from the Danish Lung Cancer Screening Trial (DLCST),18 19 which is a 5-year trial investigating the effect of screening with low-dose CT on lung cancer mortality. In 2005, participants in the DLCST were randomly assigned to either annual CT or a control group. At the time the present study was performed, 726 participants in the DLCST had been randomly assigned to CT and had completed the baseline and 1-year follow-up scans, and these 726 subjects were included in the present study. The present study was approved by an institutional review board.
The inclusion and exclusion criteria for the DLCST have previously been published.18 In brief, participants were current or former smokers aged 50–70 years with a smoking history of more than 20 pack-years. Former smokers were only included if they had quit smoking after the age of 50 years and less than 10 years before inclusion. All subjects had to have an FEV1 at least 30% of predicted normal. Applicants with a body weight above 130 kg or previous treatment for lung cancer, breast cancer, malignant melanoma or hypernephroma were excluded. Individuals with a history of any other cancer within the previous 5 years, or tuberculosis within the previous 2 years, or any serious illness that would shorten life expectancy to less than 10 years, were also excluded.
Imaging
All CT scans were performed on a Multi Detector CT scanner (16 rows Philips Mx 8000, Philips Medical Systems, Eindhoven, The Netherlands). Scans were performed supine after full inspiration, with caudocranial scan direction including the entire rib cage and with a low dose technique with 140 kV and 40 mAs. Scans were performed with spiral data acquisition with the following acquisition parameters: section collimation 16×0.75 mm, pitch 1.5 and rotation time 0.5 s. Images were reconstructed with 1 mm slice thickness using a high spatial resolution algorithm (kernel D).
Image analysis
Images were analysed by the Image Group at the Department of Computer Science, University of Copenhagen,20 using inhouse developed software designed to segment the lung and calculate various densitometric parameters. The software also has an option that highlights low lung density areas, also called low attenuation areas (LAA), defined as pixels with densities below a certain threshold (eg, −950 Hounsfield units; HU).
The lung segmentation algorithm starts by detecting a point within the trachea by searching for a dark disc in the top slice of the CT. The centre point of the dark disc is then used to extract the trachea and main bronchi. A special region growing algorithm that stops at bifurcations was used for this purpose. Subsequently, the left and right lungs were segmented simultaneously with a competing region growing algorithm, using the main bronchi as seed points and a threshold of −400 HU for the interface between lung and extrapulmonary tissue. The trachea and main bronchi were excluded from the final segmentation of the lung. The analysis is fully automated.
The segmentations produced by the software were validated by two physicians experienced in CT anatomy (HA and GE) who, independently of each other, checked the lung segmentations of 200 CT scans selected from all 726 available scans in the DLCST. Of these 200 scans, 100 were selected as outliers with exceptionally large or small values for items such as lung volume, lung density, difference between left and right lung, etc. The next 100 scans were randomly selected from the remaining 626 scans. The observers checked whether the right and left lungs were segmented correctly, ie, whether all parts of the lung were included and whether air from surrounding structures such as the oesophagus or bowel was correctly excluded. Problems were detected in 4% of segmentations and these problems were all minor, corresponding to a CT volume less than 1 ml, except for one case in which the segmentation included 40 ml of bowel air. No error in the separation of left and right lung was found in the 200 scans reviewed.
After segmentation the CT volume and CT weight of the lung were computed. Based on voxel dimensions the volume of a single voxel was calculated, and from this the total lung volume (TLV) was calculated by adding up the volume of voxels marked as lung. Similarly, by adding 1000 to the density value (in HU) of the voxel, the density was transformed into g/l.
Finally, the software created a frequency distribution (histogram) of pixel densities from which the 15th percentile density (PD15) was calculated as the density in g/l at which 15% of the pixels have lower densities.21 22 The density of the lung is dependent on the amount of air in the lung, and therefore with the purpose of eliminating noise due to variations in inspiration level, PD15 was adjusted to the predicted total lung capacity (TLC) derived from reference equations based on the participant's sex and height. As the product of PD15 and TLV for a given patient was fairly constant and independent of the level of inspiration, we adjusted PD15 to predicted TLC by multiplying PD15 by TLV and dividing by TLC.23 Subsequently in this paper ‘adjusted PD15’ will be referred to as ‘PD15’.
Assessments
At baseline and 1-year follow-up smoking status was determined (self-reported) along with carbon monoxide level in exhaled air. A carbon monoxide level above 10 parts per million (ppm) was defined as indicating current smoking,24 and participants who claimed to be former smokers but who had carbon monoxide greater than 10 ppm either at baseline or follow-up were excluded from the study because of contradictory information about their smoking status. Smoking habits were further explored with a questionnaire that determined the number of cigarettes smoked per day in the previous month (0–10, 11–20, >20), number of pack-years and, for former smokers, the year they stopped smoking.
Definitions and design
Data were collected prospectively and analysed both longitudinally (within an observation window) and cross-sectionally (by comparing groups and subgroups) as described below. Former smokers were defined as participants who had abstained from smoking for at least 4 weeks before the baseline screening visit. Subjects were observed in a 1-year window from baseline to 1-year follow-up, and based on their smoking behaviour during this window they were divided in to four groups:
Continuous smokers: baseline smokers who were still smoking at 1-year follow-up;
Recent quitters: baseline smokers who had quit smoking at least 4 weeks before the 1-year follow-up;
Continuous ex-smokers: baseline ex-smokers who did not smoke at 1-year follow-up;
Re-starters: baseline former smokers who had resumed smoking at 1-year follow-up.
All continuous ex-smokers had stopped smoking within the previous 10 years before inclusion (ie, between 1995 and 2004), and these subjects were subdivided into 10 subgroups according to how many years they had been abstinent at baseline. For these subgroups the change in PD15 in the observation window from baseline to 1-year follow-up was calculated, and in that way it was possible to estimate the change in PD15 for each of the first 10 years separately after smoking cessation.
Statistics
The distribution of PD15 was approximately normal, and the influence of smoking behaviour on lung density by CT was analysed in two linear models with PD15 as the outcome variable. In the first cross-sectional model only baseline scans were analysed with smoking status, sex, age, pack-years and body mass index (BMI) as explanatory variables. In the second longitudinal model the change of PD15 between baseline and 1-year follow-up was analysed with time between scans, sex, year of smoking cessation, smoking relapse and baseline PD15 as explanatory variables. Using these two models, differences in PD15 seen in the cross-sectional model could be further explored by the longitudinal model. With the aim of making coefficients more easy to interpret age, pack-years and baseline PD15 were entered in the model after subtracting the mean, and for the longitudinal model it was assumed that the intercept (ie, outcome at time 0) was zero. All analyses were performed using R version 2.7.1 and a p value less than 0.05 was considered statistically significant.
Results
The baseline characteristics of the 726 subjects are shown in table 1. One former smoker was excluded from the study because of an exhaled carbon monoxide value above 10 ppm. At 1-year follow-up 471 subjects were continuous smokers, 77 were recent quitters, 160 were continuous ex-smokers and 18 were re-starters.
Baseline characteristics of subjects (mean values)
Cross-sectional analysis of baseline scans
Smoking status had a major influence on lung density at baseline; mean PD15 was 44.9 g/l in former smokers and 55.0 g/l in current smokers. The mean difference between the two groups was 10.1 g/l (95% CI 7.6 g/l to 12.8 g/l; p<0.001), and was largely unaffected (10.6 g/l, SE 4.5; p<0.001) by adjustment for female gender (14.9 g/l, SE 1.0; p<0.001), age (−0.36 g/l per year, SE 0.10; p<0.001), BMI (0.19 g/l, SE 0.13; p=0.14) or pack-years (0.12 g/l, SE 0.04; p=<0.001) in the cross-sectional model. However, when the ‘current smoking’ variable was replaced with a categorical variable that indicated the average number of cigarettes smoked per day in the previous month, divided into three levels, the following dose–response relationship for the difference between current and former smokers became apparent: 5.7 g/l (SE 1.7) for 0–10 cigarettes per day (n=85; p<0.001), 10.6 g/l (SE 1.3) for 11–20 cigarettes per day (n=244; p<0.001) and 11.4 g/l (SE 1.5) for more than 20 cigarettes per day (n=158; p<0.001).
Longitudinal analysis of baseline and follow-up scans
The changes in PD15 between baseline and 1-year follow-up analysed in a longitudinal model are shown in table 2.
Longitudinal linear regression analysis of change in PD15 during follow-up
In recent quitters a relatively large decrease in PD15 (−6.2 g/l (95% CI −7.6 g/l to −4.8 g/l; p<0.001) was observed in the 1-year observation window between baseline and 1-year follow-up. In continuous ex-smokers a smaller change (−3.6 g/l, 95% CI −5.7 g/l to −1.6 g/l; p<0.001) was observed when smoking cessation occurred in the year preceding baseline. When smoking cessation had occurred more than 1 year before baseline only small and insignificant changes in PD15 (ie, less than 1 g/l; p>0.1) were observed in the observation window (figure 1). Smoking relapse in the observation window between baseline and 1-year follow-up was associated with a modest increase in PD15 (3.7 g/l, 95% CI 0.6 g/l to 6.8 g/l; p=0.02). When the smoking cessation variable was replaced by a categorical variable indicating the average number of cigarettes smoked per day at baseline, the following coefficients were estimated for recent quitters: −3.2 g/l for 0–10 cigarettes per day (n=16, SE 1.5; p=0.035), −6.1 g/l for 11–20 cigarettes per day (n=36, SE 1.0; p<0.001) and −8.8 g/l for moe than 20 cigarettes per day (n=17, SE 1.5; p<0.001), again showing a dose–response relationship.

Loss of lung density at follow-up in relation to year of smoking cessation. The error bars indicate SE of mean. PD15, 15th percentile density.
Discussion
We found large differences in CT lung density in relation to different smoking behaviours. PD15 was, on average, 10 g/l (p<0.001) higher among current smokers compared with former smokers. The accumulation of soot and tar in the lungs (anthracosis) as a result of smoking may explain the higher lung density among current smokers.25 This accumulation of foreign material provokes inflammation, and the presence of inflammatory cells in the lung contributes to the higher density. Previous studies have shown that inflammation is present in active smokers.7 8 We found a clear dose–response relationship between the level of cigarette consumption and PD15 in current smokers, which strongly supports the hypothesis that smoking results in greater lung density. A dose–response relationship has also been reported between the number of cigarettes smoked and the inflammatory response in an earlier study.26
The cross-sectional difference in PD15 of 10 g/l between current and former smokers corresponded nicely to the rather dramatic changes in PD15 observed in the first 2 years after individuals had stopped smoking. PD15 decreased by 6.2 g/l during the first year after smoking cessation, and by a further 3.6 g/l (p<0.001) during the second year after smoking cessation (table 2), but no additional decrease in lung density could be detected more than 2 years after smoking cessation. This is consistent with the Lung Health Study,13 in which a beneficial effect of smoking cessation on pulmonary function was observed for 1–2 years post-cessation, but thereafter the decline in pulmonary function in ex-smokers was similar to the decline in non-smokers. Smoking cessation reduces PD15 resulting in an increasing number of LAA. We believe that during the first 1 or 2 years after smoking cessation the lung probably undergoes a cleansing process whereby the soot, tar and inflammation gradually diminish. Previous studies have shown decreased inflammatory response after smoking cessation.16 We found a dose–response effect between cigarette consumption at baseline and loss of lung density after smoking cessation, indicating that the higher the number of cigarettes smoked, the larger the effect of the cleansing process following smoking cessation.
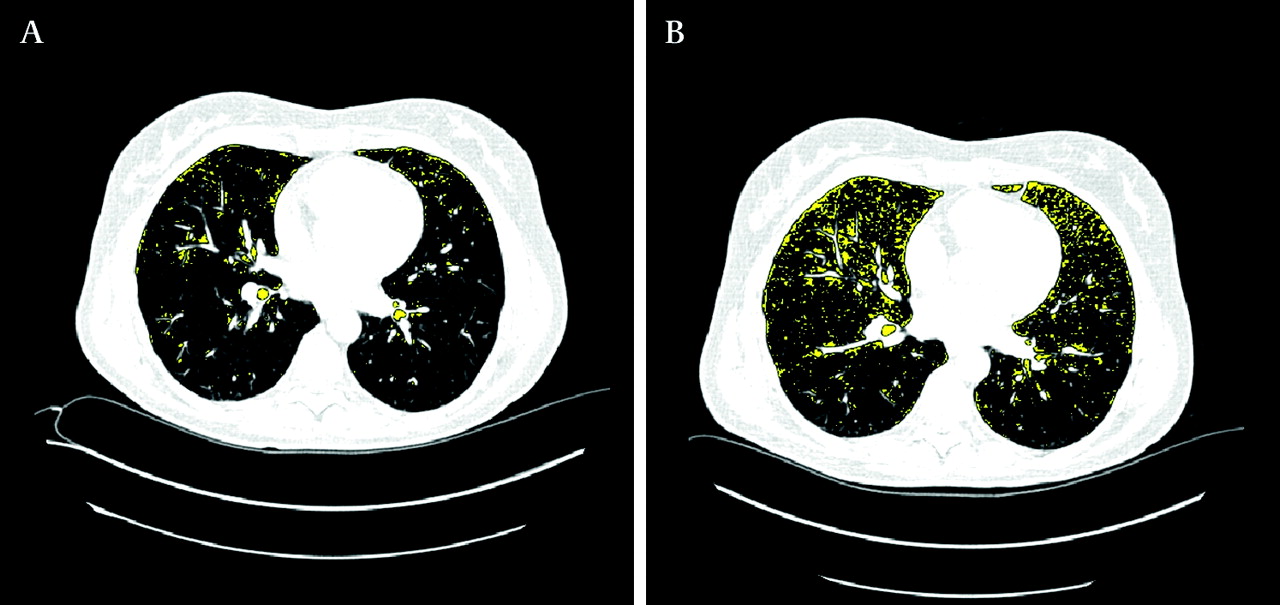
Relapse to smoking increased PD15 by 3.7 g/l, which is less than the difference of 10.1 g/l between current and former smokers noted in the cross-sectional analysis. Although relatively few subjects re-started smoking (n=18), this was a statistically significant finding (p=0.02), albeit with a broad CI (95% CI 0.5 to 6.9 g/l). Smoking relapse increases PD15 and thereby decreases the number of LAA (figure 2). We hypostasise that smoking relapse induces the accumulation of soot and tar, and it probably takes time to establish a full-blown inflammatory process in the lung. Therefore, lung density may rise for several years provided smoking is sustained. However, there are not yet any data to support this hypothesis.

Transverse CT scans from a participant who started smoking between baseline visit (A) and 1-year follow-up (B). Slice position and inspiration level were similar in the images (∆CT volume 0.04 l). Yellow areas highlight areas with lung density below −950 HU. Relapse to smoking diminishes low attenuation areas at follow-up.
Because smoking induces emphysema and alveolar destruction with loss of lung density, long-term smoking is associated with decreasing lung density.21 These opposite short and long-term effects of smoking should be taken into consideration when using CT lung density as an outcome measure in clinical trials of COPD, in which the presence of areas of low lung density, referred to as LAA, is the main CT characteristic of emphysema, and is commonly used as a surrogate marker for emphysema.1 2 In such trials a short-term decrease or increase in lung density following a change in smoking behaviour should not be misinterpreted as progression or improvement of emphysema (figure 2 and figure 3).

Transverse CT scans from a participant who stopped smoking between baseline (A) visit and 1-year follow-up (B). Slice position and inspiration level were similar in the images (∆CT volume 0.08 l). Yellow areas highlight areas with lung density below −950 HU. Smoking cessation revealed more low attenuation areas at follow-up.
Our study showed that lung density is greater in women (14.9 g/l; p<0.001) than men, which is in agreement with recent studies on gender differences in emphysema score by CT.27 We also found that the annual loss of PD15 was 0.9 g/l greater for women than for men (p=0.03, table 2), supporting previous studies that have shown that women are more susceptible to the deleterious effects of cigarette smoke and are more liable to develop COPD than men.28
The DLCST represents a unique opportunity to analyse the effect of smoking behaviour on CT lung density. Very little is known about the short-term effect of changes in smoking behaviour on lung density. One paper has described the relationship between lung density and smoking,29 but it did not include any subjects who changed their smoking behaviour during the study period.
Our study has strengths and limitations. The strengths include fairly equal gender distribution, carbon monoxide validation of smoking status, application of contemporary imaging techniques, and data analysis using linear modelling with a focus on statistical noise reduction. The principal clinical confounder in lung density measurements is the level of inspiration during scan acquisition, and controlling or adjusting for this factor is the key to improving physiological variability. Our study addressed this issue by a priori adjustment of PD15 by a simple physiological model based on the inverse relationship that exists between volume and density.21 23 We believe that these factors strengthen the validity of our findings.
Previous studies of lung density by CT have used other densitometric parameters such as the relative area of emphysema,29 that is the percentage of the lung volume with CT attenuation values below a predefined threshold, typically −950 HU. We chose PD15 because the rate of decline in PD15 has been shown to be consistent across a wide spectrum of disease severity, whereas the progression of the relative area increases with greater disease severity.30 A workshop on quantitative CT scanning in longitudinal studies of emphysema recommended that the primary outcome measure should be PD15,31 and PD15 has been gradually accepted as the most sensitive parameter for CT monitoring of emphysema development over time.32
Regarding study limitations, the first is that never-smokers were not included in the study; the inclusion of never-smokers could have allowed more direct assessment of the effect of smoking. Second, the time at which any change in smoking habit occurred was not precisely defined. We know that a change occurred at some time between the baseline visit and 1-year follow-up, and for subjects who were former smokers at baseline the year of smoking cessation is known. However, a more precise time frame would permit an even more comprehensive analysis of how changes in smoking behaviour affect lung density. Finally, it would have been interesting to explore the effect of smoking cessation on lung function. However, we did not see any significant change in FEV1 after smoking cessation (data not shown), which was probably due to the relatively low number of quitters.
Many experts in CT recommend the use of 3–5 mm slice thickness and low spatial resolution algorithm reconstruction for lung density measurements,21 but we used 1 mm high spatial resolution reconstruction algorithm (kernel D) images in this study. This was because the scans were primarily performed as part of a screening programme for lung cancer, in which thin slices and high spatial resolution reconstruction algorithm (kernel D) is usually recommended. However, we believe scan settings had little influence on the results because our study focused on changes in lung density over time, thus scans of the same subject were compared but scan settings were not changed over time.
In the future, further follow-up of these participants could be of interest, but these data are not yet available. However, follow-up studies are planned, and these may provide further insight into the effect of smoking status on lung density assessed by CT.
In conclusion, changes in smoking behaviour have much influence on lung density measured by CT. Cross-sectionally, lung density in current smokers was 10 g/l (p<0.01) higher than that in former smokers, and this difference was longitudinally accounted for by changes observed in subjects who stopped smoking and who showed a decrease in lung density of 6.2 g/l (p<0.001) in the first year and 3.6 g/l (p<0.001) in the second year post-cessation. At 1-year follow-up smoking relapse was associated with an increase in lung density of 3.7 g/l (p=0.02). The decontamination of the lung after smoking cessation thus lasted for more than 1 year, which is consistent with previous studies based on pulmonary function. Gradual remission of smoke-induced inflammation probably partly explains the protraction. On the basis of our findings, current smoking status and time since cessation or relapse to smoking should be taken into account when evaluating lung density by CT and quantifying the progress of emphysema.
Acknowledgments
Acknowledgements Dr Goutham Edula, Senior Scientist, AstraZeneca R&D, Sweden, is acknowledged for assisting in the validation of the segmentation of CT scans. Language revision was performed by medical writer Anne Hendrie, UK.
References
Footnotes
Funding The Danish Lung Cancer Screening Trial receives financial support from the Danish Ministry of Interior and Health. The densitometric measurements reported in this paper were supported by unrestricted grants from the Danish Council for Strategic Research under the Programme Commission for Nanoscience and Technology, Biotechnology and IT (NABIIT) and from AstraZeneca R&D, Sweden.
Competing interests MD has been employed at AstraZeneca in the past 5 years, and AstraZeneca has sponsored this study by unrestricted grants. MD holds stocks from AstraZeneca, as part of AstraZeneca bonus programme. The remaining authors report no conflicts of interest. The authors alone are responsible for the content and writing of the paper.
Ethics approval The Danish lung cancer screening trial was approved by the ethical committee of Copenhagen County on 31 January 2003. Approval of data management in the trial was obtained from the Danish Data Protection Agency on 11 February 2005.
Provenance and peer review Not commissioned; externally peer reviewed.