Article Text

Abstract
Aims To quantify right ventricular (RV) function in patients with chronic thromboembolic pulmonary hypertension (CTEPH) before and after pulmonary endarterectomy (PEA).
Methods Out of 33 patients, 16 were evaluated clinically and with echocardiography (conventional and myocardial deformation parameters) before PEA (preop) and at 1 week, 1 month, 3 months and 6 months after PEA. RV fractional area change (RVFAC), tricuspid annular plane systolic excursion (TAPSE) as well as mid-apical and basal peak ejection strain (S) and strain rate (SR) of the RV free wall were measured. Left ventricular (LV) apical lateral wall motion was regarded as indicating changes in overall heart rocking motion (RM). Heart catheterisation was performed before, within 1 week and at 6 months after PEA.
Results Clinical and haemodynamic parameters improved significantly after PEA. This correlated with the improvement in RVFAC, S and SR. TAPSE, on the other hand, showed a biphasic response (14.5 (4) mm preop, 8.5 (2.7) mm at 1 week and 11 (1.5) mm at 6 months). Changes in LV apical motion explain this finding. At baseline, TAPSE was enhanced by rocking motion of the heart as a result of the failing RV. Unloading the RV by PEA normalised the rocking motion and TAPSE decreased.
Conclusions RV function of CTEPH patients improves steadily after PEA. Unlike S, SR and RVFAC, this is not reflected by TAPSE because of postoperative changes in overall heart motion. Motion independent deformation parameters (S, SR) appear superior in the accurate description of regional RV function
Statistics from Altmetric.com
The evaluation of right ventricular (RV) function has become increasingly important in medical practice in light of new data emphasising the central prognostic role of the RV in various disorders: pulmonary hypertension (PH), congenital heart diseases, ischaemic heart disease and left ventricular (LV) dysfunction.1 2 Of these, PH stands out as the disease in which RV function dominates prognosis and long-term survival.3 So far, many studies have focused on describing RV dysfunction in PH but very few have aimed at assessing the functional recovery of RV contractile function in patients who undergo therapeutic interventions which normalise the haemodynamic environment of the right heart.
Chronic thromboembolic pulmonary hypertension (CTEPH) is a form of PH caused by recurrent thromboembolic events obstructing the pulmonary circulation.4 Patients with CTEPH benefit from pulmonary thrombendarterectomy (PEA), which results in an immediate and sustained decrease in pulmonary vascular resistance (PVR) and RV afterload.5 The outcome of the operation depends mainly on the reduction in pulmonary vascular resistance (PVR) and the preoperative and postoperative severity of RV dysfunction.5 6
How RV contractility recovers following pressure unloading and which parameter describes the functional status of the RV best remains a question to be answered. The most widely used tool for analysing the RV in clinical practice is echocardiography.7 However, describing RV function using conventional 2D echocardiography is challenging since the RV has a complex geometry and the trabeculated myocardium hampers endocardial delineation.8 Its retrosternal position limits the visualisation of the RV anterior wall by restricting the transthoracic window.9 Furthermore, a marked load dependence of conventional echocardiographic parameters of RV function complicates the result interpretation, especially in dramatic load changes such as after PEA.
Various echocardiographic surrogates for RV contractility have been described. RV ejection fraction (EF) assessment with 2D echocardiography lacks accuracy owing to the numerous geometric assumptions and is difficult to perform in clinical practice.10 RV fractional area change (RVFAC) has been shown to be a more robust tool, showing a good correlation with invasive haemodynamic data in patients with PH.11 The tricuspid annular plane systolic excursion (TAPSE) provides a rough estimate of the longitudinal function of the RV free wall, rendering the amount of displacement of the tricuspid ring relative to the transducer. Its simplicity makes it a very attractive tool in clinical practice and it was shown to have prognostic value in PH patients.12 Validation studies, however, provide conflicting results. Kaul et al showed an excellent correlation between TAPSE and radionuclide angiography derived RVEF,13 while Anavekar et al could not find any correlation between TAPSE and magnetic resonance derived RVEF.14
More novel, tissue Doppler-based echocardiographic parameters of myocardial deformation, such as strain (S) and strain rate (SR) were shown to be closely related to the intrinsic functional capacity of the myocardium15 16 and more sensitive in picking up subtle changes in the contractile properties of the heart muscle.17 18 They have been successfully applied to regional RV function assessment in normal individuals and in patients with PH.19 20
In this study we set out to assess the recovery of RV function using the aforementioned standard and novel echocardiographic parameters in patients with CTEPH who undergo PEA and thus allow a prospective interrogation of functional improvement in a pressure unloaded RV.
Materials and methods
Recruitment, study population
Patients
Between 2003 and 2007, 33 patients diagnosed with CTEPH who were planned to undergo PEA were recruited for the study. Clinical and echocardiographic evaluation was planned before (baseline) and at 1 week, 1 month, 3 months and 6 months after the operation. Right heart catheterisation was scheduled before and within 1 week after the operation as well as after 6 months. The New York Heart Association (NYHA) functional class and the unencouraged 6-minute walking distance were assessed at each stage, except 1 week post-operation. Sixteen patients (nine males, average age 60 (15) years), who had a baseline echocardiographic examination and at least two follow-up assessments, were included in the analysis; 17 patients were excluded because of death (2) and failure to attend (15).
Controls
Ten age-matched healthy volunteers (six males, average age 57 (9) years, p = NS vs CTEPH) served as controls for the echocardiographic parameters. None had a history of cardiovascular or pulmonary disease or respective signs or symptoms at physical examination, resting ECG and routine echocardiography.
All patients and controls had given informed consent before inclusion.
Echocardiographic examination
Patients and controls were scanned in a left decubitus position from the parasternal, apical and subcostal window, using Vivid 5, later Vivid 7 ultrasound scanners (GE Vingmed Ultrasound, Horten, Norway) with a 2.5 MHz transducer. A standard echocardiogram as well as colour tissue Doppler data was obtained. All images were stored digitally for offline analysis using dedicated software (EchoPac BT08, GE Vingmed Ultrasound, Horten, Norway).
Standard echocardiography
We measured the RV end-diastolic and end-systolic areas in the apical 4 chamber view and calculated the RVFAC as follows:
The systolic pulmonary arterial pressure (PAP) was determined from peak tricuspid regurgitant velocity and estimates of right atrial pressure as previously described.21 22 The left ventricular (LV) ejection fraction (EF) was calculated using Simpson's biplane method.
Doppler myocardial imaging
Colour-coded tissue Doppler images of the RV free wall from apical four-chamber views were acquired to extract regional S, SR and displacement parameters.
Longitudinal S and SR were analysed in two regions of interest (ROIs) of 12 mm length, positioned in the basal and mid-apical segments of the RV free wall. The two-segment model was chosen in accordance with the two portions of the RV free wall: the smooth inlet and trabeculated apex.23 The ROIs were manually tracked in order to remain within the same part of the myocardium throughout the entire cardiac cycle. Peak ejection values were calculated as peak negative SR and S between valve opening and closure. The S baseline was set to zero at pulmonary valve opening.
An ROI of 10×4 mm was placed at the level of the tricuspid ring in order to determine the displacement of the RV free wall. TAPSE was calculated as the difference between the nadir and peak of the displacement curves. A tissue Doppler technique was used to extract TAPSE to ensure spatial accuracy and high temporal resolution.24 In order to obtain an estimate of the changes in overall rocking motion of the heart, the apical lateral LV wall motion was measured with another ROI of 10×4 mm (see fig 3, lower panel).
All S, SR and displacement curves were averaged over three consecutive beats. Linear drift compensation was applied to strain and motion estimates. Timing information was imported from pulmonary and tricuspid valve Doppler traces.
Right heart catheterisation
A 7F, balloon-tipped, flow-directed pulmonary artery catheter was used for determining the following parameters: mean PAP (calculated as: (systolic PAP +2 × diastolic PAP)/3); pulmonary vascular resistance (PVR) and cardiac output. The indexed cardiac output (CI) was obtained by dividing the cardiac output with the body surface area (BSA = (weight (kg) × height (cm)/3600)1/2).
Endarterectomy
Details on the surgical procedure are published elsewhere.25 In brief, the open-thorax operation is performed with the body cooled to 20°C. An endarterectomy (PEA) is performed for each pulmonary artery during total circulatory arrest. The pericardium remains open after the operation.
Statistical analysis
The Kolmogorov-Smirnov test was used to test the normal distribution of each studied parameter. Data are presented as mean (SD) if normally distributed, otherwise as median and interquartile range. Accordingly, a paired two-tailed t test was used to compare S and SR values between the basal and the mid-apical RV segments and an unpaired t test to compare data from patients and controls. A Mann-Whitney test was used to compare the haemodynamic data obtained through right heart catheterisation before and at 3 days after the operation. The changes over time of clinical or echocardiographic parameters were assessed using mixed models with an unstructured covariance matrix and time as fixed effect. The analysis provides estimates of the parameter for each time point versus baseline and also the significance of the estimate. This type of statistical analysis was chosen to account for missing data in data sets from repeated measures.26 Univariate linear regression was used to estimate the correlation between clinical, echocardiographic and haemodynamic data. A p value of <0.05 was considered statistically significant. All data were analysed using SPSS, version 16.0.
Interobserver and intraobserver agreement
All imaging data were analysed by one observer (SG). The intraobserver agreement for myocardial deformation parameters was assessed by repeated analysis of 10 datasets 1 month after the initial analysis and blinded to the initial results. The interobserver agreement was assessed on the same datasets by a second, experienced observer (MM). The agreement between the two measurements was expressed using the 95% confidence interval and determined as the mean of the differences (SD 1.96).27
Results
Patients and controls characteristics at baseline are presented in table 1. The baseline echocardiographic evaluation was performed at a median of 1 day before PEA. Thirteen patients had the 1-week follow-up (median 9 days), 11 patients were evaluated at 1 month (median 28 days), 15 at 3 months (median 93 days) and 14 at 6 months (median 180 days). Right heart catheterisation was performed the same day as the PEA and at 3 days and 207 days after PEA. All patients were on optimal medical therapy before and after the operation. All patients had normal LV ejection fraction and none had significant left-sided valvular disease.
Baseline variables for the group study
Haemodynamic response to PEA
Compared to the preoperative status, we found a significant postoperative drop in PVR from 902 (662–1283) dyn * s/cm5 to 280 (181–318) dyn * s/cm5 (p<0.001) and in mean PAP from 43 (38–51) mm Hg to 28 (25–33) mm Hg (p<0.001) with a twofold increase in CI from 1.6 (1.3–1.8) to 3.2 (3–3.3)l/(min * m2) (p<0.001). At 6 months, all patients maintained a normal cardiac index, had clinically improved and were in stable condition. The echocardiography-derived systolic PAP dropped from 86 (12) mm Hg to 49 (12) mm Hg at 1 week (p<0.001), and remained stable during follow-up (fig 1A).

(A) Evolution of pulmonary artery systolic pressure (systolic PAP), estimated with echocardiography, preoperatively (preop) and at 1 week (1 w), 1 month (1 m), 3 months (3 months) and 6 months (6 m) follow-up. Data presented as mean (95% confidence interval. (B) 6-minute walking distance (6MWD) test preoperatively (preop) and at 1 month (1 m), 3 months (3 m) and 6 months (6 m) follow-up. Data presented as mean (95% confidence interval). *p<0.01versus preop, ‡p<0.01 versus 1 month.
Clinical status
A clear improvement in clinical status was seen over the study period. At 6 months, 10 patients were in NYHA class 1 and the reminder in NYHA class 2. Seven patients improved NYHA status by two classes, eight improved by one while one did not improve from a baseline of NYHA class 2. The 6MWD increased from 361 (103) months before the operation to 427 (128) months at 1 month after the operation (p = 0.008) with further improvement at 3 months versus 1 month (460 (87) months, p = 0.01) (fig 1B).
Conventional echocardiographic RV function parameters
The evolution of conventional echocardiographic parameters is summarised in figure 2A,D,E and exemplified in figure 3, lower panel. RVFAC improved acutely at one week versus preoperation values (28.2 (6.7% vs. 38.3 (6.5%, p<0.01) with further improvement at 1 month (42.5 (4.6%, p = 0.03) and no further change afterwards.

(A-E). Evolution over time for the studied parameters in CTEPH patients before the surgical intervention (preop), at 1 week (1 w), 1 month (1 m), 3 months (3 m) and 6 months (6 m) after PEA and in controls. Data are presented as mean (95% confidence interval). (A) Right ventricular fractional area change (RVFAC). (B) Strain (S) and (C) strain rate (SR), measured in the basal and mid-apical segment of the RV free wall. (D) Tricuspid valve ring motion (TAPSE). (E) Apical LV lateral wall displacement. *p<0.05 versus baseline, §p<0.05 versus 1 week and p<0.05 controls versus 6 months, ns = non-significant. (F) Correlation between the absolute acute change in RVFAC and the absolute acute change in mean pulmonary artery pressure.

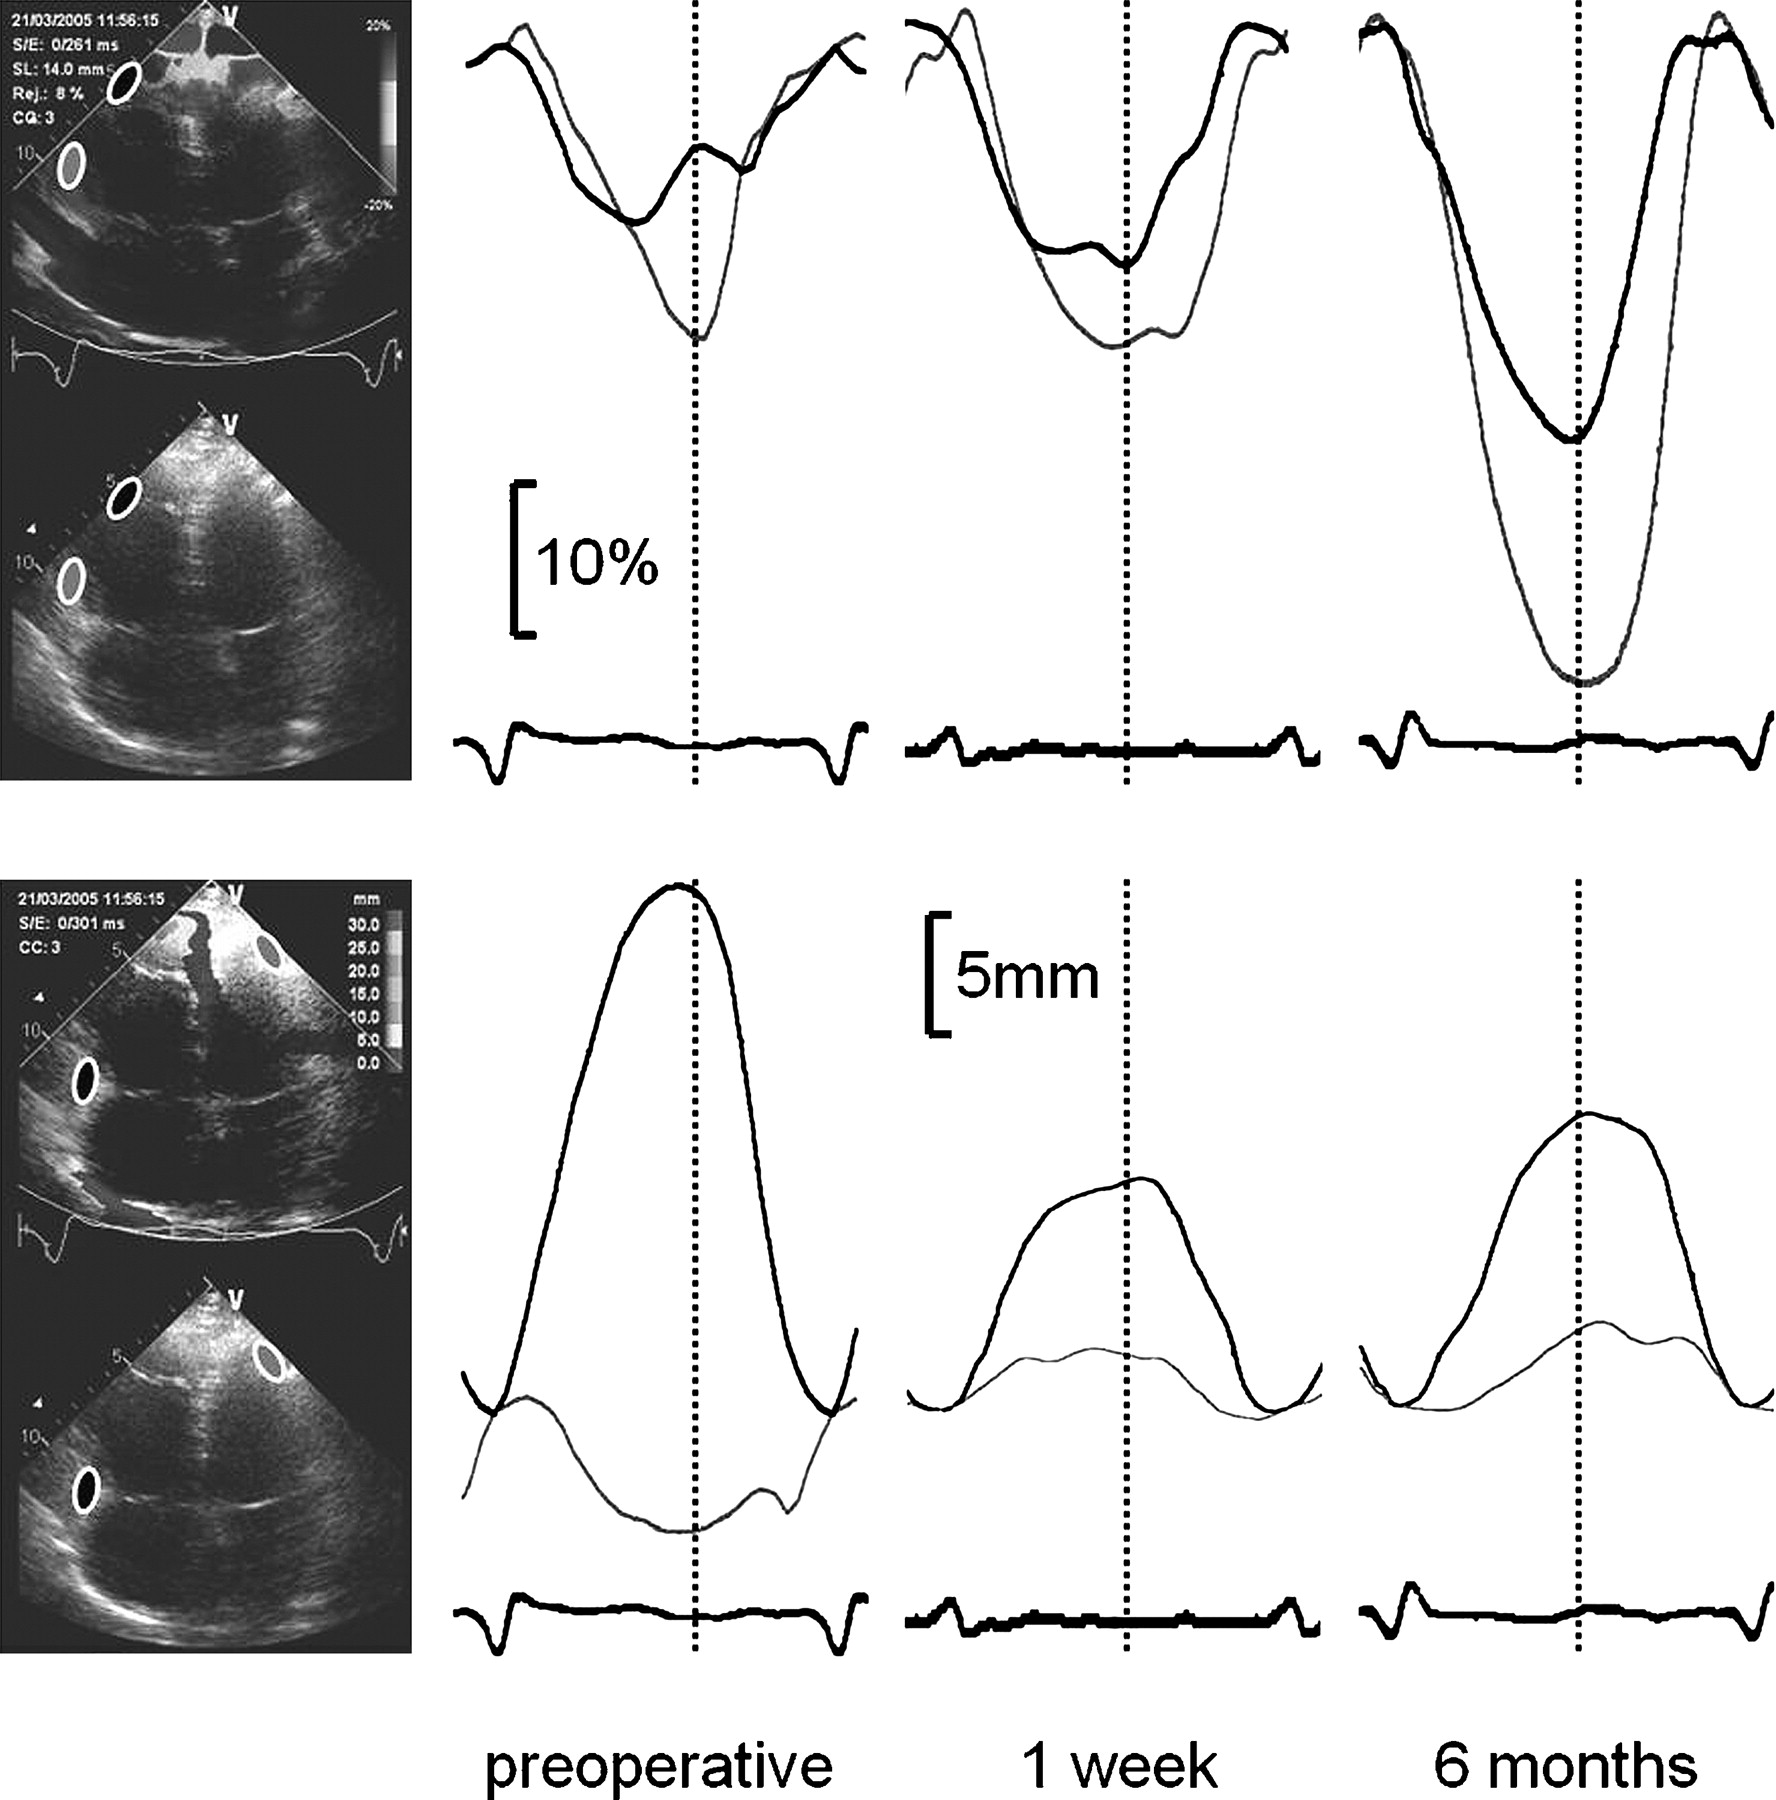
Typical evaluation of echocardiographic findings before PEA (preoperative) and during follow up (1 week, 6 months). Upper panel: RV free wall longitudinal strain (%). Black, mid-apical segment, grey, basal segment, bottom, ECG. Note the postoperative improvement in longitudinal strain during follow up. Lower panel: Longitudinal displacement (mm). Black, tricuspid ring motion (TAPSE), grey, displacement of the lateral LV apex, bottom, ECG. Note the biphasic response of TAPSE after operation and the change in motion direction of the lateral LV apex, reflecting the postoperative reduction in overall clockwise systolic rocking of the heart. Vertical broken lines, pulmonary valve closure.
In contrast to that, TAPSE decreased dramatically from 14.5 (4.4) mm to 8.5 (2.7) mm after the operation (p<0.01). It recovered during follow-up but failed to reach the preoperative value after 6 months (11 (1.5) mm, p<0.01 vs baseline).
The abnormal, basally directed systolic motion of the apical lateral LV wall indicated a marked clockwise rocking of the heart owing to the severely impaired RV and septal function at baseline. After unloading the RV with the PEA this motion pattern was inverted (−1.1 (3.7) mm vs 3.7 mm (2.1) mm, p<0.01), indicating a reduced rocking because of the improved RV function. The systolic motion of the apical lateral LV wall showed a trend towards further improvement at the following visits.
Deformation imaging
All deformation parameters of the RV free wall improved steadily after PEA (see fig 2B,C) and exemplified in figure 3, upper panel. For mid-apical S, changes became significant at the 1-month follow-up (−12.6% (4.1%) vs −8.8% (4.6%) at baseline, p = 0.03). In the basal segment, RV S improvement became significant at the 3-month visit (−20.7% (7.5%) vs −12.2% (4.6%) at baseline, p<0.01).
Segmental SR analysis revealed a significant improvement at 1-month follow-up in the mid-apical segment (−0.96 (0.37) s−1 vs −0.76 (0.34) s−1, p<0.01) and at the 1-week evaluation in the basal segment (−1.22 (0.37) s−1 vs −0.77 (0.27) s−1 at baseline, p<0.01).
The S values in the basal segment were significantly higher than mid-apical (p = 0.01) before PEA. SR values were not significantly different (p = 0.52). At the 6-month visit, both S and SR were significantly higher in the basal segment compared to mid-apical (−20.8% (5%) vs −14.4% (7%), p = 0.003 and −1.51 (0.5) s−1 vs −1.11 (0.45) s−1, p = 0.027, respectively).
Comparison with controls
At 6-month follow-up, RVFAC, S and SR remained significantly lower than values measured in healthy controls (except for basal SR, p = 0.26) (fig 2A–E). The base-apex gradient for deformation parameters found in patients at the 6-month visit was not present in controls.
Comparisons with the haemodynamic data
The clinical and echocardiography-derived RV functional parameters displayed a heterogeneous pattern of correlation with the catheterisation data. The mid-apical values for myocardial deformation parameters correlated strongly with heart catheterisation variables (see table 2). Similar correlations from basal segments were weak and failed to reach statistical significance. RVFAC correlated strongly and significantly with pulmonary pressures (fig 2F); 6MWD did not show any correlation.
Baseline correlates (r) of clinical and echocardiography-derived RV function parameters and their significance (p) with heart catheterisation data
Interobserver and intraobserver agreement
The interobserver agreement were 0.42% (7.2) and 0.06 s−1 (0.8) for S and SR respectively. The intraobserver agreement showed values of 0.44% (5.4) and 0.04 s−1 (0.45) for S and SR, respectively.
Discussion
Main findings of the study
Our study investigated conventional and novel RV functional parameters in patients with CTEPH before and at different time points after PEA. Haemodynamic parameters improved acutely after PEA. The clinical status showed a steady and sustained improvement. TAPSE showed a biphasic response after PEA and did not correlate with changes in all other parameters of RV function. Myocardial deformation parameters (S and SR) of the free RV wall reflected the functional improvement of the RV. Compared to controls, echocardiographic parameters that showed improvement did not fully normalise at the 6-month visit.
Right ventricular function after PEA
The acute load changes due to PEA lead to an increase in RVFAC, RV free wall shortening and shortening rate. This is in accordance with previous publications investigating RV myocardial function in animal experiments of imposing load changes by partial pulmonary artery occlusion and observations in humans of the recovery after pulmonary embolism.28 29
The functional improvement was immediate, but tended to continue during the follow-up period. Two possible mechanisms may contribute to this. First, exposure to chronic pressure overload exerts structural and functional changes in the myocardium with hypertrophy/dilation and decreased systolic performance.30 In reverse, unloading the ventricle results in morphological and functional improvement over time.31 32 Second, on pump cardiac surgery has been shown to result in RV dysfunction. The course of RV functional recovery is still a matter of controversy.33 34 To which extend each of these two factors contributes to the RV functional status cannot be distinguished in this clinical setting of PEA in CTEPH, leaving room for further clinical studies.
We found differences in the behaviour of basal and mid-apical segments of the RV free wall preoperatively and after unloading. S measured in the basal segment showed higher values compared to the mid-apical segment. This finding is in accordance with other studies that describe a similar difference.19 20 Postoperative S appeared to increase more in the basal segments, but the relative change was similar: deformation in both basal and mid-apical segments doubled during follow-up. Postoperative SR showed a more immediate and, during follow up, higher increase in the basal segments. To the best of our knowledge, this is the first study describing these regional differences over time. A possible explanation for this difference might be the shape of the RV free wall, which becomes more flattened after the operation, particularly in the apex, leading to a relatively higher load on the apical segment compared to the preoperative settings.19
The temporal difference in the response of S and SR is concordant with the observation of other authors who found SR to be more related to contractility while S is closely linked to geometric changes and thereby to chamber remodelling.16 35
Comparing the data to the control group reveals only partial normalisation of RV function parameters. Although RVFAC, S and SR showed a steady improvement throughout the study period, the 6-month values were still lower than in healthy individuals. Moreover, the base-apex gradient in the deformation parameters, which was still visible at 6 months, was not found in controls. This lack of full recovery may be explained by the short follow-up period. D'Armini et al32 found a slow functional improvement in the RV, which can last as long as three years. As an alternative, a permanent RV damage and an inability of complete functional recovery after CTEPH must be considered.
Overall heart motion
The visual analysis of the echo image loops revealed a striking rocking motion of the heart which could be proved by the motion assessment of the lateral apex of the LV. It showed a clearly abnormal, basally directed motion during systole before the operation. After PEA, the visual impression of overall heart rocking was reduced, and the motion direction of the lateral LV apex normalised. In parallel to the improvement of RV function, the amplitude of the lateral LV apex motion normalised further during follow-up (fig 4).

Diastolic (grey) and systolic (red) ventricular contours obtained from an apical four-chamber view of a study patient (same patient as fig 3) with CTEPH preoperatively and at 1 week and 6 months after PEA. Myocardial motion is indicated by arrows. Myocardial deformation is coded in shades of red. Note the preoperative rocking motion of the entire heart elevating the measured TAPSE despite decreased RV free wall deformation and causing an abnormal, basally directed motion of the apical lateral LV wall. Postoperative normalisation of motion patterns along with the improvement of myocardial deformation after unloading the RV. See figure 3 for the position of the regions of interest.
Function assessment using TAPSE
In clinical use, TAPSE is supposed be a simple and robust measure of RV function, correlating well with RVEF and other haemodynamic data. In this study, however, TAPSE showed a biphasic response with an immediate postoperative decrease and a later improvement. Thus, there are arguments that contradict the assumption that TAPSE truly reflects changes in RV function. At first, a significant deterioration of RV function because of the operation, outweighing the effects of load reduction, can be excluded since both RVFAC and myocardial deformation improved directly after the operation. Second, despite significant unloading, TAPSE was higher before the operation than during the entire follow-up.
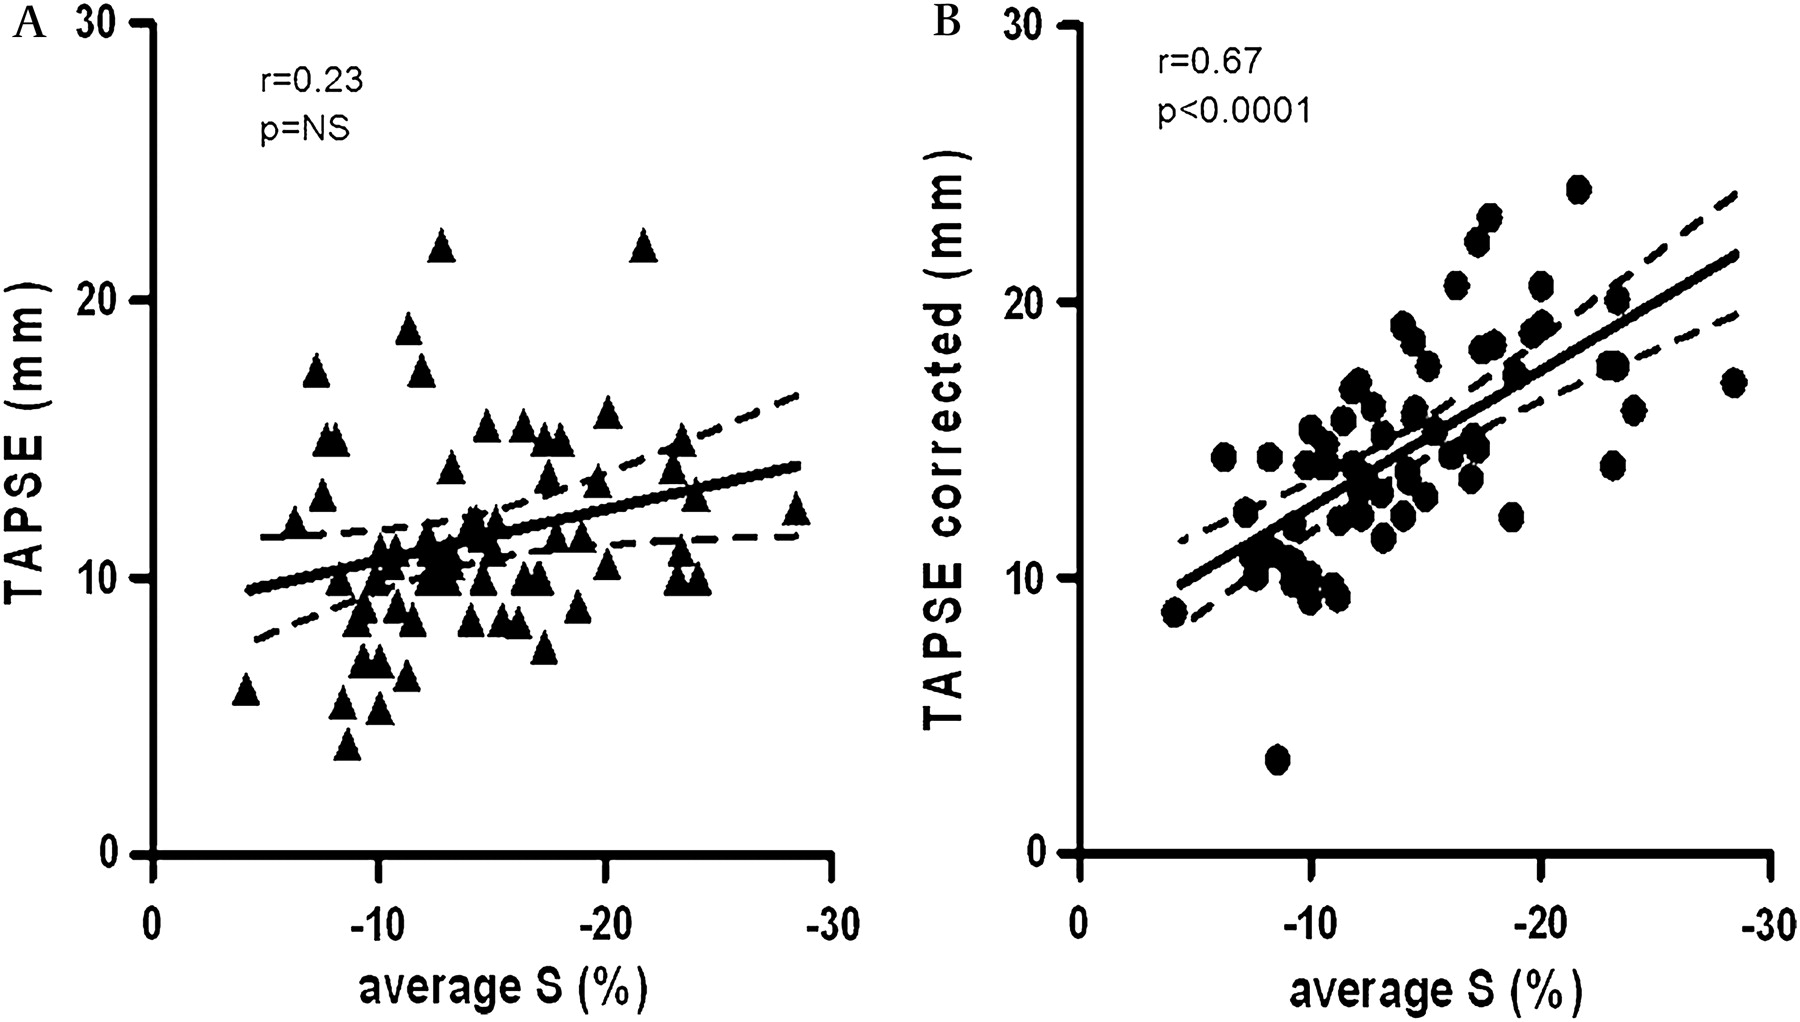
Therefore, we rather suggest that tricuspid ring motion is only loosely related to RV function and is—as any parameter that is measured against an external (the transducer) rather than an intrinsic reference system (the myocardium itself)—strongly influenced by overall heart motion. To test this theory, we tried to correct TAPSE for the observed overall rocking motion of the heart by adding the changes of lateral LV apex motion to the TAPSE values. As can be seen in figure 5, this approach led to a significant correlation with the deformation parameters.

Univariate correlations of tricuspid annular plane systolic excursion (TAPSE) (A) and TAPSE corrected for apical motion (B) with average right ventricular (RV) free wall strain (average S, obtained as average of basal and mid-apical segmental strain (S)). Solid line, linear regression. Broken lines, 95% confidence interval of the regression model.
Clinical perspective
Our study reveals clearly that compared to measuring systolic excursion of the tricuspid ring, myocardial deformation parameters provide a more accurate picture of the contractile status of the RV free wall. S and SR are closely related to myocardial function and are not influenced by the overall motion of the wall.15 16 They not only offer the possibility to investigate regional function of the RV, but also appear more suited for the follow-up of RV function after open heart surgery, which may heavily influence overall heart motion by opening the pericardium and by the imposed haemodynamic changes. TAPSE measurements may be used as a follow-up parameter if no major loading changes are expected and no thoracic surgery was performed.
Limitations
In this study, we only investigated RV longitudinal function as it can be measured in an apical four-chamber view. Previous studies have shown that RV fibre orientation is predominantly longitudinal and that principal myocardial deformation occurs in this direction.36 We therefore assume that the longitudinal component of RV function is a good reflector of the functional status of the RV myocardium.
Deformation calculations were based on tissue Doppler imaging, which is susceptible to misalignment between Doppler beam and wall motion direction. To avoid any bias arising from angle problems, we measured the angle between the ROI and the direction of the ultrasound beam in all datasets. For the basal ROI, the angle was 7 (4–11) degrees and for the mid-apical ROI 4 (2–7) degrees, both lower than the accepted limit of 15 degrees.
We used tissue Doppler based displacement of the tricuspid ring as measure of TAPSE instead of M-mode. We do not expect discrepancies in the behaviour of both assessment methods but see it as advantage that tissue Doppler-based measurements can be repeated and corrected during post-processing of the data. Furthermore, data provide better spatial accuracy and temporal resolution.24
We used the Doppler-based displacement of the apical segment of the LV lateral wall as an estimate of the overall rocking motion of the heart. Modern tracking of the apical motion maybe a more straightforward approach to this, but Voigt et al recently described an algorithm for measuring this motion using the displacement traces from both LV apical segments of four-chamber view, which was also based on Doppler data and which was shown to be robust and reproducible.37
Conclusions
Patients with CTEPH who undergo PEA benefit greatly from surgical intervention with an acute haemodynamic improvement in the pulmonary circulation. The RV shows a constant and steady improvement in functional parameters in a 6-month follow-up period. TAPSE, being highly dependent on the overall motion of the heart, fails to reflect RV longitudinal function accurately. Particularly in the clinical setting of perioperative patient follow-up, myocardial deformation parameters (S and SR) provide a more reliable description of RV function.
References
Footnotes
VD is now affiliated to the European Commission, Brussels, Belgium; CS is now affiliated to the St Maarten Hospital, Mechelen, Belgium; LH is now affiliated to the Virga Jesse Hospital, Hasselt, Belgium.
Competing interests None.
Provenance and peer review Not commissioned; externally peer reviewed.