Article Text

Abstract
Objectives: To determine whether results from questionnaires, exposure measurements, and laboratory tests, commonly used in occupational health practice, can predict the presence or absence of sensitisation in workers exposed to high molecular weight (HMW) allergens. The study aims to develop and validate a diagnostic rule to predict sensitisation in laboratory animal workers. The main reason for such research is efficiency.
Methods: Baseline data from 551 laboratory animal workers participating in an ongoing cohort study, bridging a period of 3 years, were used for diagnostic research. Data from 472 workers participating in the study during the first period were used to develop a prediction rule; these workers represented the derivation set. Data from 79 workers, participating during the second period, were used to evaluate the rule's performance—the validation set. Serum samples were analysed for specific immunoglobulin E (IgE) antibodies against common and laboratory animal allergens. Questionnaire items, exposure determinants, IgE serology, skin prick tests (SPTs), and lung function tests were analysed, corresponding to diagnostic investigation, in a multiple logistic regression model. The accuracy of the model was evaluated by receiver operating characteristic (ROC) curve analysis, and by comparison of the predicted and observed prevalences.
Results: Asthmatic symptoms, (work related) allergic symptoms, sex, occupational exposure to rats, and a positive SPT to common allergens, showed the best performance in discriminating workers at high or at low risk of being sensitised.
Conclusion: High and low risk categories for work related sensitisation can be distinguished from simple questionnaire data and SPT results. The method can easily be applied in occupational medical practice and may markedly increase the efficiency of occupational health surveillance in laboratory animal workers as well as other workers exposed to HMW allergens.
- sensitisation
- occupational allergens
- diagnostic research
- SPT, skin prick tests
- HMW, high molecular weight
- IgE, immunoglobulin E
- OD, optical density
- FVC, forced vital capacity
- FEV1, forced expiratory volume in 1 second
- RUA, rat urinary aeroallergen
- MUA, mouse urinary aeroallergen
- ROC, receiver operating characteristic
- AUC, area under the curve
- HMW, high molecular weight
Statistics from Altmetric.com
- SPT, skin prick tests
- HMW, high molecular weight
- IgE, immunoglobulin E
- OD, optical density
- FVC, forced vital capacity
- FEV1, forced expiratory volume in 1 second
- RUA, rat urinary aeroallergen
- MUA, mouse urinary aeroallergen
- ROC, receiver operating characteristic
- AUC, area under the curve
- HMW, high molecular weight
Occupational exposure to high molecular weight (HMW) protein derived agents causes allergic sensitisation through mechanisms mediated by immunoglobulin E (IgE). More than a hundred allergens have already been listed and new agents are being reported regularly.1 Several studies have reported a high prevalence (20%–40%) of sensitisation in working populations.2–4 Exposure response studies provide evidence that at extremely low exposure to laboratory animal urinary proteins a considerable risk for sensitisation may exist.5 Control measures to reach even lower levels of exposure are likely not to be feasible technically and practically. This stresses the need for early detection of allergic sensitisation in individual workers and identification of high risk groups in working populations. However, there exists no validated, easy to use, and generally accepted procedure to predict sensitisation to HMW allergens. Besides, most of the allergens, especially those to which only few workers are exposed, are not always commercially available. And, due to strict regulations these allergens can nowadays not be readily prepared and used for skin testing or provocation testing.
Diagnosis of occupational allergic diseases normally relies on the presence of symptoms (resulting form taking occupational and medical history) and signs (physical examination, changes in lung function, IgE serology, and skin prick testing), combined with information on the likelihood of exposure. Although each of these diagnostic features is indicative of occupational allergic disorders, none have been tested in a combined way to detect whether combinations of variables are more strongly associated with sensitisation to laboratory animals, as a hallmark of these clinical manifestations. The complexities of the diagnostic process and the unavailability of many occupational allergens are important reasons for sensitisation not to be spotted.
The objective of this study is to determine whether easily obtainable results from questionnaires commonly used in occupational health practice, result from exposure measurements, and subsequent laboratory tests can predict the presence or absence of sensitisation in workers exposed to laboratory animal allergens. The study aims at developing and validating a diagnostic rule to predict laboratory animal workers at high or low risk of being sensitised, using these potential diagnostic determinants. A strategy for occupational health services about the content and frequency of medical examinations can be based on results of this approach. The main reason for such research is efficiency.
POPULATION AND METHODS
Population
Baseline data from employees participating in an ongoing cohort study among Dutch laboratory animal workers to investigate exposure-response relations, were used for diagnostic research. This study was carried out between June 1992 and June 1995 in laboratory animal facilities of four universities, two research institutes, and a pharmaceutical company, bridging a period of about 3 years. From 750 eligible subjects, 677 (90%) participated during this period. Eighty three workers reported no exposure to laboratory animals. No skin prick test (SPT) results were available for 43 (7.2%) workers, leaving 551 subjects for the analyses. Data were incomplete for four workers.
Data from laboratory animal workers participating in the study during the first period (June 1992 until December 1993) were used to develop a prediction rule; these workers represented the derivation set (the group used for deriving the model). Data from workers, participating in the study between September 1993 and June 1995, were used to evaluate the performance of the rule; the validation set. Questionnaire
All participants completed a questionnaire before the survey. This self administered questionnaire was based on a Dutch version of an internationally accepted respiratory questionnaire, which has been used previously in other studies on occupational respiratory diseases in The Netherlands.6,7 The questionnaire contained 59 questions about age, sex, respiratory symptoms, personal and family history of allergic symptoms, hyperresponsiveness, and smoking. Additional questions were asked about absence due to illness, use of medication, employment history, intensity of contact with laboratory animals, and about allergic symptoms due to working with laboratory animals during working hours, after finishing work, and over the past year.
People were considered to have work related symptoms if they experienced chest tightness (asthma), running nose or sneezing, running or itching eyes, and itching skin during contact with laboratory animals. Subjects were considered to have a history of allergy if they reported at least one eye, nasal, or respiratory symptom when exposed to common allergens such as house dust, domestic animals, food, or pollen. Increased airway hyperresponsiveness was defined as experiencing breathing problems after exposure to changes in temperature, fog, gases, and fumes, tobacco smoke, and cooking smells.
Never smokers were defined as people who had never smoked or smoked less than a total of 10 packs during their lifetime. Ex-smokers were defined as people who stopped more than a year ago and current smokers were defined as those who smoked more than one cigarette a day for at least 1 year.
Tests for sensitisation
Five common aeroallergens (house dust mites, grass pollen, tree pollen, cat fur, and dog fur), six occupational allergens (rat urine, mouse urine, rat fur, mouse fur, guinea pig fur, and rabbit fur) and positive and negative controls were used for skin prick testing. Allergen preparations were produced by ALK Benelux, Houten. All SPTs were performed by two skilled technicians. A weal diameter of 3 mm or more was regarded a positive response, after subtraction of any response to the negative control.
IgEs against five common allergens (house dust mite, grass pollen, birch pollen, cat fur, and dog fur) were measured with a sandwich enzyme immunoassay developed at the Environmental and Occupational Health Group, University of Utrecht, The Netherlands.8 An optical density (OD492) exceeding the OD+0.05 of the reagent blank (no serum control) was interpreted as a positive reaction. Total IgE was measured by a sandwich enzyme immunoassay and regarded as positive above 100 kU/l.
Definition of the outcome
Sensitisation to laboratory animals was defined as a positive SPT response to one of the laboratory animal allergens (rat, mouse, guinea pig, rabbit).
Spirometry
Lung function (forced vital capacity (FVC), forced expiratory volume in 1 second (FEV1,), and the FEV1/FVC ratio) were measured with a dry rolling seal Vicatest V (Jeager, Breda, The Netherlands). Measurements were performed according to the lung function protocol of the European Community for Steel and Coal.9 To compare the actual to the reference FEV1/FVC ratio, we used standardised residuals (standardised residual=(observed−predicted)/residual SD). This dimensionless index indicates how far the observed value is removed from the reference value, and therefore how likely it is that the observed FEV1/FVC ratio occurs in the reference population. Exposure
Average concentrations of rat urinary aeroallergen (RUA) and mouse urinary aeroallergen (MUA) were calculated for each person with a job exposure matrix by job title and work area (or facility) based on more than 250 personal samples. Details of analysis of RUA and MUA have been reported elsewhere.10 A large variation of exposure to RUA and MUA has been detected within each job title group and could be attributed to differences in duration of exposure and differences in tasks performed.
Data analysis
To establish a diagnostic rule, we assessed the independent contribution of all documented diagnostic (history, exposure, and laboratory) findings by multivariate logistic regression analyses. In accordance with the chronology of documentation in occupational medical practice, we first included determinants from the questionnaire, to identify a subset of variables that were independent of sensitisation. Each variable entering the model was required to yield an improvement χ2 of <0.01. Then, all results obtained from serology and SPTs were added separately to the questionnaire model. Laboratory variables and SPT results were considered to additionally contribute to the prediction of sensitisation if they also yield an improvement χ2 of less than 0.01 and thus remained in the final model. Interaction terms were also tested as candidate variables in the logistic regression; however, none of these terms fulfilled the entering criteria. For all variables included in the prediction models, β coefficients and odds ratios with 95% confidence interval (95% CI) were calculated.
We developed three prediction models to identify subjects at an increased risk of sensitisation to laboratory animal allergens. The first prediction model was based on personal and work related information from the questionnaires, and exposure determinants. In a second prediction model the added value of serological examinations (total IgE>100 kU/l and positive IgE against one of the common allergens) was assessed. In the third prediction model the serological results were withdrawn in favour of variables derived from skin prick testing, to allow a comparison of more or less equivalent diagnostic instruments. Because a positive SPT to cat and dog allergens has been shown to be a strong predictor in rat and mouse allergy, we used the results from SPT to non-animal allergens (house dust mite, tree pollens, and grass pollen) independently from the SPT results for cat and dog allergens.
The Hosmer and Lemeshow2 test is used as a test of goodness of fit by comparing the observed and expected results in batches of 10 groups. The accuracy of the models in discriminating workers with and without sensitisation, in the three derivation sets, was evaluated by calculating the areas under a receiver operating characteristic (ROC) curve.11 The area under the curve (AUC) is a measure of the diagnostic power of a test, independent of cut off points, and represents the proportion in which workers with the outcome (sensitisation) have a higher symptom probability than workers without the outcome. An AUC with a value over 0.8 can be interpreted as a good discriminative power.12 The performance of the rule was tested in a validation set using ROC curve analysis. For every case, the probability of sensitisation to laboratory animal allergens was estimated on the basis of the coefficients of the seven independent determinants (risk factors) in the final model. The risk score for an individual worker was simplified by assigning one point for each risk factor present, and adding the results. The mean predicted probability and the observed prevalence of sensitisation in the derivation and the validation set were estimated, and stratified according to four different risk groups (no risk factor, 1–2 factors, 3–4 factors, and ≥5 factors).
The final model was transformed into a two step decision rule. By assigning one point for each variable present from the questionnaire and adding the results, a score was obtained. According to the value of these scores, an SPT can be applied or withheld in the second step. All analyses were performed with SPSS 9.0 for Windows (Statistical Products and Service Solutions, Chicago). Sensitivity and specificity were calculated according to standard methods. Two sided 95% CIs were used.
RESULTS
The general characteristics of 551 workers in the derivation set and validation set are given in table 1. For all laboratory animal workers, data were available for personal and work related characteristics, respiratory symptoms, smoking, lung function, skin prick tests, IgE antibodies, and exposure determinants. From 25 people (4.5%) no values for serum total IgE were available. Laboratory animal workers in the derivation set were of significantly higher age, had been longer employed, and had been longer exposed (years) to laboratory animals than workers in the validation set. Animal caretakers and animal technicians had the highest concentrations of personal exposure to RUA and MUA and spent the highest proportion (mean 27 and 16 hours/week respectively) of their working day in handling animals. Unfortunately, exposure concentrations of rat and mouse aeroallergens from workers in the validation set were not available. Therefore hours spent/week working with these animals was used as a proxy of these concentrations of exposure. No differences in working hours between the two sets was found. In the validation set a significantly higher proportion of women workers were found. The prevalence of workers sensitised to laboratory animals was 27.3% in the derivation set and 24.1% in the validation set (2; p>0.10).
General characteristics of the derivation and the validation set
Table 2 gives the univariate characteristics of sensitisation in the derivation set. Compared with workers not sensitised, sensitised workers more often had a history of asthmatic symptoms, respiratory symptoms (cough, phlegm, dyspnoea, or wheeze), work related allergic symptoms, symptoms suggesting atopy or hyperresponsiveness, and more hours/week working with rats. However, there was no difference in years of employment, total years exposed to laboratory animals, and smoking. Serum concentrations of total IgE>100 kU/l, positive specific IgE to (animal or non-animal) common allergens, and positive SPTs to one of the (animal or non-animal) common allergens were significantly more prevalent in sensitised workers.
Univariate characteristics of sensitisation in the derivation set
The variables finally included in the three diagnostic models to predict the probability of sensitisation are given in table 3. Asthmatic symptoms, allergic symptoms during work, allergic symptoms during the past year, sex, and working for more than 20 hours/week with rats, were identified as significant independent predictors of sensitisation by applying the questionnaire to all laboratory animal workers. When serological results were added to the questionnaire model, total IgE>100 kU/l and positive IgE to one of the common allergens were independent predictors (model 2). The third prediction model showed positive SPT to non-animal allergens (house dust mite, grass, or tree), and positive SPT to cat and dog allergens as independent predictors of the presence of sensitisation when SPT results were added to the questionnaire model.
Independent predictors of sensitisation to laboratory animal allergens in three diagnostic models
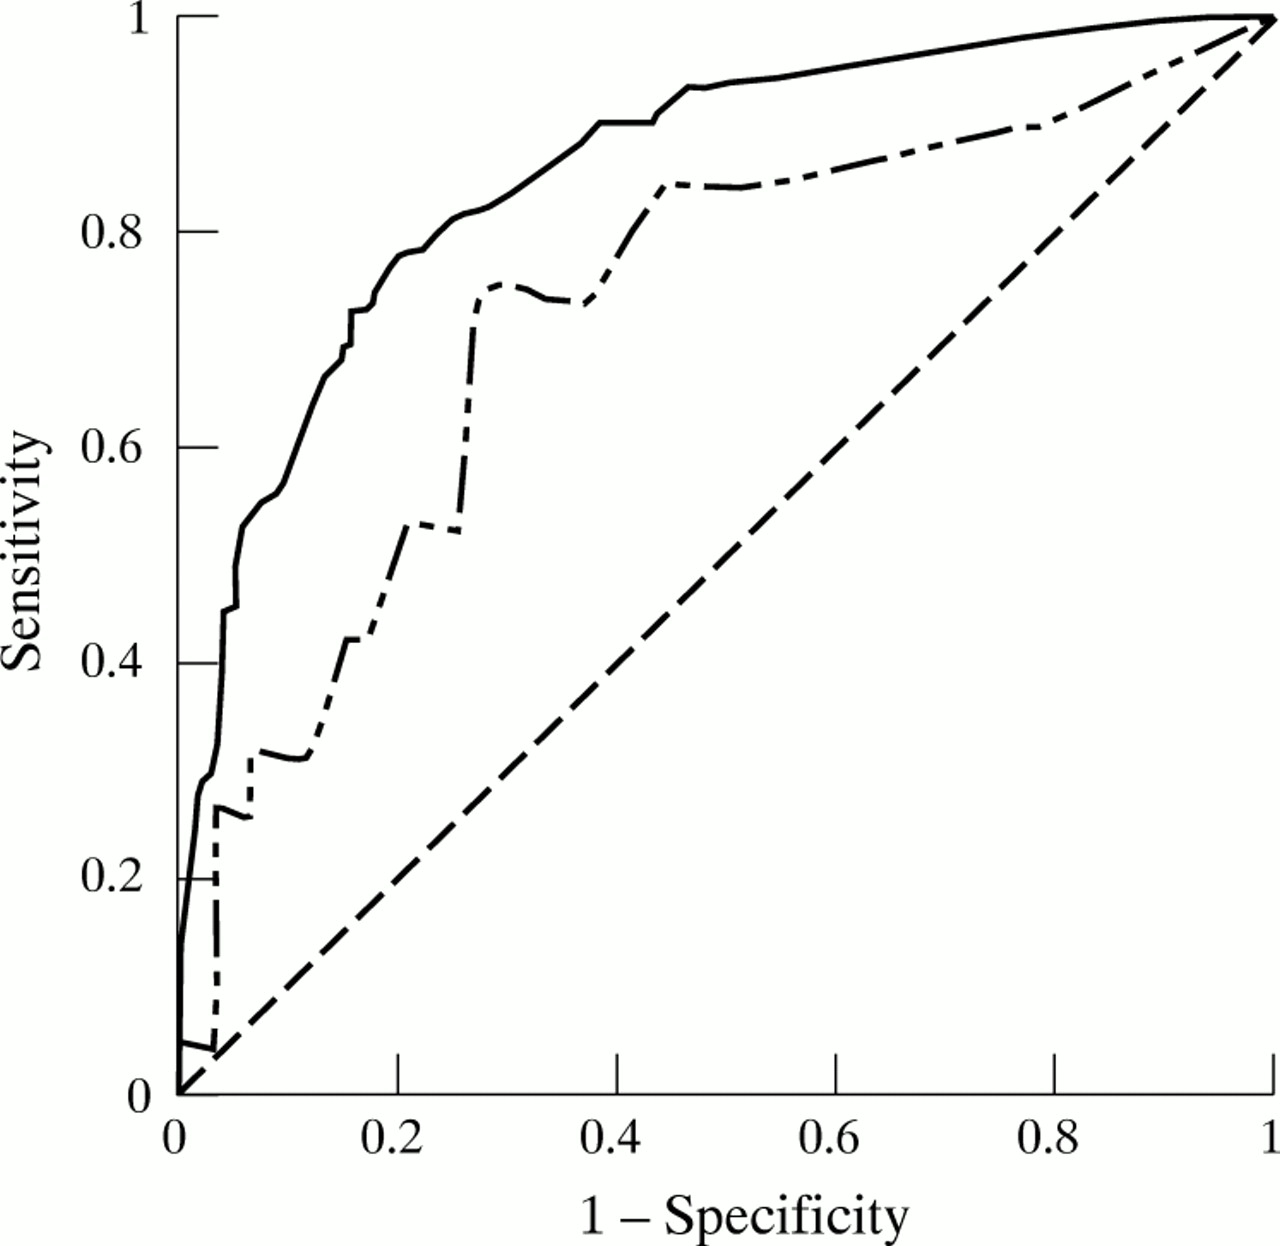
The area under the ROC in prediction model 3 was 0.86 (95% CI 0.82 to 0.89) and showed the best performance (fig 1). When applied to the validation set, the model discriminated sensitised and non-sensitised workers with an AUC of 0.73 (95% CI 0.60 to 0.87). Although the AUC of the derivation set had a larger surface area than the AUC of the validation set, the difference was not significant at the 5% level. How closely the observed and predicted probabilities of the model 3 matched was evaluated by the Hosmer and Lemeshow goodness of fit test, which showed a significance of 0.62, indicating a good fit.
Receiver operating characteristic (ROC) curves for a prediction model based on questionnaire results and additional results from skin prick tests to common allergens in the derivation set () compared with the results in the validation set (———). Derivation set AUC 0.86 (95% CI 0.82 to 0.89); validation set AUC 0.73 (95% CI 0.60 to 0.87).
The questionnaire model applied in the validation set showed reasonable performance (AUC 0.70; 95% CI 0.53 to 0.86). The questionnaire+IgE model could not be applied in the validation set because specific IgE for common allergens in these workers was not available. So, prediction model 3, including (work related) allergic and respiratory symptoms, male sex, exposure to rats, any positive SPT to animal and to non-animal common allergens, seems most attractive in detecting sensitisation in workers exposed long term to laboratory animals. As table 4 shows, the agreement between the actual prevalence and predicted probability of sensitisation to laboratory animal allergens was generally good, using prediction model 3.
Performance of the questionnaire+SPT model in the derivation and validation set
To develop a decision rule for medical investigation in workers exposed to HMW allergens, a two step procedure was evaluated (table 5). In the first step the results of the questionnaire were scored and stratified into the four risk groups. In workers with two or more risk factors SPT results were added as a subsequent test. This cut off point showed that for workers with two risk factors or more in the first step, the mean predicted probability of sensitisation was equal to the actual prevalence, and markedly higher than the frequency in the total population. The rule performed best in workers with two to three risk factors in which the SPT had a positive predictive value of 66% (55/84) and a negative predictive value of 83% (58/70). In workers with two or more risk factors and a positive SPT the rule showed a positive predictive value of 68% (75/110). A negative predictive value of 78% (60/77), was found in these workers with a negative SPT.
Performance of the decision rule (mean predicted probability and observed prevalence of laboratory animal sensitisation relative to the number of risk factors derived from a questionnaire (step 1), and results from SPTs to common allergens in step 2)
DISCUSSION
Our study shows that identification of laboratory animal workers, at high or low risk of being sensitised to laboratory animal aeroallergens, is feasible using specific items from a medical questionnaire and skin prick tests to five common allergens. Relevant independent determinants of work related sensitisation were; presence of work related allergic symptoms, occurrence of asthmatic and allergic symptoms during the past year, male sex, more than 20 hours/week exposed to rats, and a positive SPT for one of the non-animal or animal common allergens. A diagnostic model based on these factors correctly classified 86% of the laboratory animal workers in sensitised and non-sensitised workers.
Our study had some methodological limitations. Firstly, sensitisation was defined as a positive SPT to one of the laboratory animal allergens, which may represent an imperfect standard for sensitisation. Some sensitised workers may not have positive SPT reactions, and some workers with positive skin prick tests may ultimately prove not to be sensitised. Also, our data were collected as part of a study of which the primary goal was not the development of a prediction rule. However, in this study the variables collected consisted of identical items from a questionnaire normally used in respiratory and occupational medical care. Tests for sensitisation were performed according to daily medical practice, and were examined without knowledge of the questionnaire responses, so it is unlikely that test review bias significantly influenced our results.
To test rates of misclassification we validated our prediction model in a group of laboratory animal workers, participating in the study about 2 years later. We used identical questionnaires and diagnostic tests in this population with the same prevalence of sensitisation to laboratory animals. Application of our diagnostic model to this validation set, showed a somewhat reduced performance, which may be explained by slight differences in age, sex, exposure, and years in employment. Despite this difference, the results support generalisability of the prediction rule in workers exposed to high molecular weight (HMW) allergens.
Various signs and symptoms have been recommended for the evaluation of laboratory animal allergy in epidemiological studies as well as in clinical diagnosis.13 Unfortunately, there is no consensus on which determinants should be included. Several studies have shown sensitisation as a hallmark of occupational allergic disease.2–5 Consequently, we used sensitisation to laboratory animal allergens as the outcome and not a clinical stage of occupational allergic disease or occupational asthma.
Most previous studies on the diagnosis of occupational allergic diseases were limited by relying on single test results in discriminating between the presence and absence of disease.13–19 This may lead to erroneous conclusions because risk variables obtained from personal and occupational history, information on exposure, and laboratory function tests may be mutually dependent and generate the same information. Therefore, all variables commonly documented should be considered potential predictors to establish a diagnosis of sensitisation in laboratory animal workers.
Such assessments are possible from stepwise multivariate logistic regression analyses in accordance with the diagnostic chronology of documentation in occupational practice, as done in this study. This analysis directly estimates the probability of the disease, given potential diagnostic determinants.
The predictors of our rule have been reported in other epidemiological studies that investigated occupational allergy to animals.2–4,20–22 Most of the cross sectional and longitudinal studies have shown an association between atopy and laboratory animal allergy, although the independent contribution of the specific combination of questionnaire items to the diagnostic accuracy has not been described before.
In the absence of information on a safe concentration of exposure, regular surveillance for occupational allergic diseases has been advocated and seems to be warranted. Therefore, efforts to identify (groups of) sensitised workers early and to counsel these workers is critical. These subjects should be followed very closely, particularly in those at risk of allergic asthma. However, examining all workers regularly would lead to unacceptable costs. Surveillance of selected occupational risk groups may be considered a useful alternative.
We propose a two step decision procedure to preselect subjects at low or high risk of being sensitised with the results from a questionnaire in the initial survey. The initial survey should be used only to identify workers with symptoms that warrant further evaluation. In the second survey, SPTs should be applied to workers with two or more risk factors derived from the questionnaire for selection of workers with the highest likelihood of being sensitised. For example, by preselecting workers with two or more risk factors scored from the questionnaire, only 40% (187/472 in our study) of the working population would be referred for the next investigation. Application of the SPTs in the second survey identified 110 positive results from which 75 workers were sensitised, yielding a positive predictive value of 68% and a negative predictive value of 78% (60/77). With this selection criterion, 42% (54/129) of all sensitised workers could not be included by the rule. However, included workers showed a significantly higher prevalence (80%–90%) of work related asthmatic symptoms, absenteeism, visit to the doctor, and loss of lung function (standardised residual FEV1/FVC ≤–1.64) compared with sensitised subjects not included.
If the objective of the medical surveillance was to follow up workers with one or more risk factors, 80% (379/472) of the population would have been involved. This preselection resulted in 117 included cases, 25 more than in the previous selection procedure. From these 25 sensitised cases 18 were included by a positive SPT (data not shown). By applying this rule to 80% of the population at risk only 28% ((12+7+12+5)/129) of the sensitised workers were not identified by the rule.
Our study shows that a two step decision rule provides a useful guideline to the occupational physician in predicting the probability of being sensitised in any worker exposed to laboratory animal allergens and in deciding to choose which (group of) workers should be followed up for sequential medical examination. However, application of our decision rule for prognostic purposes would require validation of the risk variables in a longitudinal study.
In conclusion, in workers exposed to laboratory animal allergens a two step prediction rule, based on the combined results from a questionnaire, and SPTs indicating atopy, accurately discriminated workers sensitised and non-sensitised to laboratory animal allergens. The prediction rule was prospectively validated, without a significant decrement in discriminatory power. Our method, obtained from individual question scores and relatively simple medical investigations, can easily be applied in occupational medical practice, and could markedly increase the efficiency of medical surveillance by occupational professionals. Before surveillance programmes for occupational allergies are initiated, the benefits of such programmes have to be weighted against the costs. Such analyses are not possible on the basis of our data. It seems likely that by applying this strategy, best use is made of time and resources in occupational practice by not evaluating more subjects than necessary to identify those with occupational allergic disease.
More than 100 allergens have already been listed and new agents are being reported regularly. Most of these specific workplace allergens are not generally available for use in skin test or immunoassay and are costly. Our approach may be of great significance in large populations at risk in which reduction in costs can be considerable, but also in small populations for which specific allergen preparations are difficult to obtain.