


Abstract
To predict the degree of accumulation of hepatic metabolic inhibitors in the liver from the in vitro data, we investigated the relationship between cell/medium concentration ratios (C/M ratios) in isolated rat hepatocytes and liver/blood unbound concentration (KBf) after i.v. administration of various metabolic inhibitors such as itraconazole, ketoconazole, verapamil, diltiazem, enoxacin, ciprofloxacin, clarithromycin, cimetidine, and nizatidine. The C/M ratios of itraconazole were ∼6000 and 200 at the concentrations of 0.1 and 10 μg/ml, respectively, and the uptake of ketoconazole and verapamil into the hepatocytes also showed a concentration dependence, although the degree was smaller than that of itraconazole. The uptake of diltiazem, enoxacin, ciprofloxacin, and clarithromycin into the hepatocytes showed linear profiles on concentration dependence. There was an excellent correlation between C/M ratios and KBf values of all nine drugs with a slope of 1. This finding suggested the possibility of predicting drug concentrations in the liver (CH) from C/M ratios, the blood concentrations of drugs (CB) and unbound fraction in blood (fB), which was expressed by CH = (C/M) · CB · fB. It may be possible to predict the drug concentrations in human liver from KBf values estimated with isolated human hepatocytes and concentrations in the blood in a similar manner as in rats.
In clinical cases, many adverse effects on drug-drug interactions have been reported. The metabolic inhibition of one drug by another in the liver and/or gut is one of the most important events among pharmacokinetic drug-drug interactions (Fee et al., 1987; Olkkola et al., 1993, 1994, 1996; Backman et al., 1994; Ahonen et al., 1995; Baldwin et al., 1995). We can estimate the degree of interactions quantitatively to some extent if the metabolic inhibition constants are obtained by using liver microsomes, primary cultured hepatocytes, and/or CYP-expressed cells (Pichard et al., 1990;Gascon and Dayer, 1991; Wrighton and Ring, 1994; Ghosal et al., 1996). However, the predicted increase ratios of area under the concentration-time curve (AUC)1 of the interacting drugs were sometimes much underestimated by using the unbound concentration in plasma as the concentration of inhibitors in vivo. We could predict the increase ratio of the concentration (or AUC) of midazolam (MDZ) in the plasma by the metabolic inhibition from in vitro experiments quantitatively, when itraconazole (ITZ) and ketoconazole (KTZ), azole antifungal agents, and cimetidine (CIM) and nizatidine (NIZ), histamine H2 receptor antagonists, were concomitantly administered as inhibitors (Takedomi et al., 1998; Yamano et al., 1999). The predicted values were considerably underestimated by using unbound concentrations in the plasma as concentrations of inhibitors near the metabolic enzymes, whereas the predicted values with unbound concentrations in the liver were very close to the observed values, suggesting the necessity to take account of the concentrative uptake of inhibitors into liver. In a clinical situation, the concentrations of the inhibitors in human liver are required to predict the increase ratio of the concentration; however, it is difficult to measure drug concentration in the liver directly. It is thus necessary to develop a methodology to estimate the concentration in the liver from the concentration in the plasma, which can be measured actually. In this study, we tried to predict the concentration in the liver with in vitro uptake data into isolated hepatocytes in rats. We examined the correlation between cell/medium concentration ratios (C/M ratios) and the liver/blood unbound concentration (KBf) values of liver in rats.
Experimental Procedures
Materials.
ITZ and KTZ were supplied by Janssen-Kyowa Co. (Tokyo, Japan). Enoxacin (ENX) and ciprofloxacin (CPFX) were supplied by Dainippon Pharmaceutical Corp. (Osaka, Japan). Clarithromycin (CAM) was supplied by Taisho Pharmaceutical Co. (Tokyo, Japan). Verapamil (VER) hydrochloride and diltiazem (DLZ) hydrochloride were purchased from Wako Pure Pharmaceutical Co. (Osaka, Japan). All other chemicals used as reagents were of reagent grade and reagents for HPLC.
Animals.
Sprague-Dawley male rats (230–260 g) were purchased from Nippon Bio-Supply Center (Tokyo, Japan). The rats were allowed access to water and food pellets ad libitum.
Preparation of Drug Solutions.
ENX and CPFX were dissolved in a small volume of 1 N NaOH, neutralized with a small volume of 0.5 N HCl, and then diluted with saline to prepare 5 mg/ml ENX or CPFX solutions. VER and DLZ were dissolved in saline to prepare 5 and 20 mg/ml VER or DLZ solutions. CAM was dissolved in equimolar HCl, neutralized with a small volume of 0.1 N NaOH, and then diluted with saline to prepare 5 mg/ml of solution.
Concentrations in Liver and Plasma (Blood) and Liver/Blood (Unbound) Concentration Ratios.
Under light ether anesthesia, rats were cannulated through the femoral vein and artery. After recovery from the anesthesia, ENX (10 mg/kg), CPFX (10 mg/kg), CAM (10 mg/kg), VER (5 mg/kg), or DLZ (5 mg/kg) was administrated by bolus injection through the femoral vein. At 2, 5, 10, 20, 30, 45, 60, 90, 120, and 180 min after the administration of each drug, blood samples were collected from the femoral artery and were centrifuged at 12,000 rpm for 2 min to obtain the plasma. The liver was then removed at 180 min after the administration and the plasma and liver were stored at −20°C until analyzed. The liver was homogenated with 4 volumes of ice-cold distilled water. The concentrations of each drug in the plasma and liver were determined by the methods described later, and the liver/plasma concentration ratios at 180 min after the administration were regarded as the apparent liver/plasma concentration ratio (KP) values.
Plasma concentration profiles were analyzed by fitting the following biexponential equation with the nonlinear least-squares method (MULTI) (Yamaoka et al., 1981):
Additionally, for VER, DLZ, ENX, CPFX, and CAM, the realKP values were calculated by correcting the apparent KP values as follows. Rats were cannulated in the femoral artery and portal vein under light ether anesthesia. After recovery from the anesthesia, ENX (10 mg/kg), CPFX (10 mg/kg), CAM (10 mg/kg), VER (20 mg/kg), or DLZ (20 mg/kg) was administrated by bolus injection through the portal vein. Blood samples were collected at 2, 5, 10, 20, 30, 45, 60, 90, 120, and 180 min after the administration of each drug and drug concentrations in the plasma were determined as described above. The pharmacokinetic parameters were calculated by the nonlinear least-squares method (MULTI) (Yamaoka et al., 1981). The hepatic extraction ratios (E) were calculated from AUC after i.v. administration (AUCi.v.) and AUC after intraportal administration (AUCpv) regarded as eq. 5:
The real liver-to-blood concentration ratios (KB) values were calculated according to eq. 7 (Lin et al., 1982):
The apparent KP(KP,app) values of ITZ, KTZ, CIM, and NIZ were cited from our reports (Takedomi et al., 1998; Yamano et al., 1999). Hepatic clearances of ITZ and KTZ were much smaller than the hepatic blood flow rate. For KTZ, CIM, and NIZ, theKP,app values when the concentrations in plasma after infusion of drugs became at the steady state (β = 0), were used as KP,app values (Takedomi et al., 1998; Yamano et al., 1999). Therefore, theKP,app values of ITZ, CIM, NIZ, and KTZ were regarded as the real KP values.
The real concentration in liver/unbound concentration in blood ratios (KBf) of various drugs were calculated according to eq. 8:
The fP of VER, DLZ, ENX, CPFX, and CAM were evaluated using the equilibrium dialysis method. Dialysis was performed with an apparatus made of clear acrylic resin and consisted of two 1.5-ml chambers separated by a cellulose dialysis membrane (SC-101-M10H; Diachema, Zurich, Switzerland). Each drug was added to the rat fresh plasma at a concentration of 5 and 20 μg/ml and applied to one chamber and isotonic phosphate buffer (pH 7.4) was applied to the other. After incubation at 37°C for 6 h, 0.1 ml of sample was collected from both chambers for assay. The fP of various drugs was calculated according to eq. 9. The fP of ITZ, CIM, and NIZ was cited from our reports (Takedomi et al., 1998; Yamano et al., 1999).
The CB/CP ratios of various drugs were measured as follows. Each drug was added to the rat fresh blood at a concentration of 0.5, 2, or 10 μg/ml and 1 ml of blood sample was incubated at 37°C for 15 min. Then, 0.2 ml of sample was taken, and the plasma was obtained by centrifugation and CB/CP ratios were calculated. From the preliminary experiment, we confirmed that CB/CP ratios were substantially constant after incubation at 37°C for 15 min and each drug was stable during incubation.
Uptake Kinetics by Isolated Rat Hepatocytes.
Rat hepatocytes were isolated according to the procedure of Baur et al. (1975). Cell viability for each experiment was checked by the trypan blue exclusion test and was in the range of 85 to 95%. Protein concentration was determined by the colorimetric method of Lowry et al. (1951). All experiments were completed within 2 h after cell preparation, at which time the viability had not changed appreciably.
The time courses of the uptake of various drugs into isolated rat hepatocytes were investigated as follows. Isolated rat hepatocytes (protein concentration, 20 mg/ml) were suspended in Krebs-Henseleit buffer. Then, 0.3 ml of a hepatocyte suspension and 2.7 ml of Krebs-Henseleit buffer (albumin-free) were mixed and preincubated at 37°C for 5 min. Thirty microliters of a standard solution of various drugs was added to each hepatocyte suspension at a concentration of 1 μg/ml and incubated at 37°C. At 20, 40, 60, 120, or 300 s after addition of drugs, 400 μl of the cell suspensions was removed. For ITZ, a sample also was taken at 600 s. The cell suspensions were placed in 1.5-ml polyethylene tubes previously layered with 500 μl of silicone-oil (specific gravity, 1.050) and 200 μl of 3 N KOH. The samples were then centrifuged for 10 s in a table-top microfuge capable of extremely rapid acceleration to separate the cells from the medium. The samples were frozen at −20°C, and then the sample tubes were cut at the middle of the oil layer. The concentrations in the upper layers (medium) and lower layers (hepatocytes) were measured to investigate the time courses of the uptake into isolated rat hepatocytes. The uptake of drugs was corrected for the adherent fluid volume and then converted to true intracellular concentration. The values of adherent fluid (2.2 μl/mg protein) and intracellular space (5.2 μl/mg protein) were obtained from the literature (Miyauchi et al., 1993).
Concentration dependence on uptake of drugs into isolated rat hepatocytes was investigated as follows. The concentrations of drugs were 0.1, 0.2, 0.5, 1, 2, 5, and 10 μg/ml for ITZ, KTZ, VER, and DLZ and 0.1, 1, and 10 μg/ml for ENX, CPFX, and CAM. Uptake experiments into isolated rat hepatocytes were performed as described above. Incubation times for each drug were enough to reach equilibrium (5 min for KTZ, VER, DLZ, ENX, CPFX, and CAM; 10 min for ITZ).
Measurement of the Concentrations of Various Drugs.
The concentrations of ITZ and KTZ in the plasma and blood were measured according to the methods reported previously (Yamano et al., 1999).
For the determination of VER and DLZ concentrations in the plasma, blood, and liver, 0.1 ml of plasma or blood, or 0.5 ml of 20% liver homogenate were mixed with 0.1 ml of methanol, 0.5 ml of 1 N NaOH, and 2.5 ml of isopropylether and shaken for 5 min, followed by centrifugation at 3000 rpm for 5 min. Two milliliters of the organic phase was transferred to another tube and evaporated under nitrogen gas. The residue was dissolved in 0.2 ml of the mobile phase and 75 μl was injected into HPLC. The chromatographic system consisted of an autosampler 717 (Waters, Tokyo, Japan), a pump LC-10AD, and an SPD-10A variable-wavelength UV detector (Shimadzu Corp., Kyoto, Japan) operating at 229 nm and 237 nm for VER and DLZ, respectively. The column was a reversed-phase Inertosil ODS, 4.6 mm × 250 mm (GL Science, Osaka, Japan) and was maintained at 40°C. The mobile phases were acetonitrile-10 mM phosphate buffer (pH 6.5) (80:20, v/v) for VER and acetonitrile-10 mM phosphate buffer (pH 3.0) (35:65, v/v) for DLZ and were pumped isocratically at a flow rate of 1 ml/min. The lower limit of quantification was 50 ng/ml for plasma and blood and 500 ng/g for liver.
For the determination of VER and DLZ in separated cells or medium, 0.5 ml of 1 N NaOH and 5 ml of isopropylether were mixed and shaken for 5 min and then centrifuged at 3000 rpm for 5 min. Four milliliters of the organic phase was then transferred to another tube and back-extracted with 3 ml of 0.1 N HCl. To 2 ml of the aqueous phase, 0.5 ml of 1 N NaOH was added and extracted with 2.5 ml of isopropylether. Two milliliters of the organic phase was transferred to another tube and evaporated under nitrogen gas. The residue was dissolved in 0.2 ml of the mobile phase and 75 μl was injected into HPLC. The HPLC condition was the same as that of the plasma concentration of VER and DLZ.
The concentrations of CIM and NIZ in the plasma and blood were measured by a modification of the method of Takedomi et al. (1998). In brief, 0.1 ml of plasma or blood, 0.1 ml of methanol, 0.5 ml of 1 N NaOH, and 5 ml of dichloromethane were mixed and shaken for 5 min, and then centrifuged at 3000 rpm for 5 min. Four milliliters of the organic phase was then transferred to another tube and evaporated under nitrogen gas. The residue was dissolved in 0.2 ml of the mobile phase and 40 μl was injected into HPLC. For detection, a wavelength of 228 nm was used. The column was a reversed-phase YMC-Pack Pro C18, 3.0 mm × 150 mm (YMC, Kyoto, Japan) and was maintained at 40. The mobile phase was acetonitrile-10 mM phosphate buffer (pH 6.5, 15:85, v/v), and was pumped isocratically at a flow rate of 0.4 ml/min. The lower limit of quantification was 100 ng/ml for both plasma and blood.
For the determination of ENX and CPFX concentrations in the plasma, 0.1 ml of plasma, 0.2 ml of methanol, 1 ml of 100 mM phosphate buffer (pH 7.4), and 5 ml of chloroform containing 1% ethyl chloroacetate were mixed and shaken for 10 min and then centrifuged at 3000 rpm for 5 min. Four milliliters of the organic phase was then transferred to another tube and evaporated under nitrogen gas. The residue was dissolved in 0.2 ml of the mobile phase and 75 μl was injected into HPLC. The HPLC system was the same as for the determination of the concentration of ITZ and KTZ. The wavelength of the UV detector was set at 270 nm. The column was a reversed-phase YMC-Pack ODS-H, 4.6 mm × 250 mm (YMC) and was maintained at 40. The mobile phase was acetonitrile-10 mM phosphate buffer (pH 3.0, 50:50, v/v) and was pumped isocratically at a flow rate of 1 ml/min. The lower limit of quantification in the plasma was 100 ng/ml for both ENX and CPFX.
For the determination of ENX and CPFX concentrations in the blood, liver, hepatocyte suspension, or medium, 0.1 ml of blood or 0.5 ml of 20% liver homogenate, 0.2 ml of methanol, 1 ml of 100 mM phosphate buffer (pH 7.4), and 5 ml of chloroform containing 10% isopropylalchol were mixed with the sample and shaken for 10 min and then centrifuged at 3000 rpm for 5 min. Four milliliters of the organic phase was then transferred to another tube and back-extracted with 3 ml of 0.01 N NaOH. To 2 ml of the aqueous phase, 0.4 ml of 0.05 N HCl and 1 ml of 100 mM phosphate buffer (pH 7.4) were added and extracted with 5 ml of chloroform containing 1% ethyl chloroacetate. The lower limit of quantification was 100 ng/ml for blood and 500 ng/g for liver.
For the determination of CAM concentrations in the plasma and liver, 0.1 ml of plasma or 0.5 ml of 20% liver homogenate, 0.5 ml of 0.5 N NaOH, and 3 ml of tert-butyl methylether were mixed and shaken for 5 min and then centrifuged at 3000 rpm for 5 min. Two milliliters of the organic phase was then transferred to another tube and evaporated under nitrogen gas. The residue was dissolved in 50 μl of the mobile phase and 20 μl was injected into HPLC. The chromatographic system consisted of a pump LC-10AD and an ECD-10A electron chemical detector (Shimadzu Corp.). The detector cell potential for the oxidation was 1300 mV. The column was a reversed-phase TSKgel 80TM ODS, 4.6 mm × 150 mm (Toso, Tokyo, Japan) and was maintained at 30. The mobile phases were acetonitrile-100 mM phosphate buffer (pH 6.4, 50:50, v/v) and were pumped isocratically at a flow rate of 1 ml/min. The lower limit of quantification was 300 ng/ml for both plasma and blood and 1000 ng/g for liver.
For the determination of CAM in separated cells or medium, 0.5 ml of 0.5 N NaOH and 5 ml of tert-butyl methylether were mixed and shaken for 5 min and then centrifuged at 3000 rpm for 5 min. Four milliliters of the organic phase was then transferred to another tube and back-extracted with 3 ml of 100 mM phosphate buffer (pH 4.0). To 2 ml of the aqueous phase, 0.5 ml of 1 N NaOH was added and extracted with 2.5 ml of tert-butyl methylether. Two milliliters of the organic phase was transferred to another tube and evaporated under nitrogen gas. The residue was dissolved in 50 μl of the mobile phase and 20 μl was injected into HPLC. The HPLC condition was the same as that of the plasma concentration of CAM.
In all measurements, coefficients of variation were <10% and within-run accuracies were <±10%. When the concentrations in the samples were below the limit of quantification, levels were determined by increasing the amount of sample.
Statistical Analysis.
Statistical analysis was performed using Student’s t test. Differences were regarded as statistically significant whenp values were <.05.
Results
Plasma Concentration Profiles and Hepatic Extraction Ratios of Various Drugs.
Figure 1 and Table1 show plasma concentration profiles and the pharmacokinetic parameters of VER, DLZ, ENX, CPFX, and CAM after intraportal and i.v. administration. The hepatic extraction ratios of VER, DLZ, ENX, CPFX, and CAM were 0.797, 0.782, 0.228, 0.529, and 0.088, respectively.

Plasma concentration profiles of VER (A), DLZ (B), ENX (C), CPFX (D), and CAM (E) after bolus i.p. (●) and i.v. (○) injection of VER, DLZ, ENX, CPFX, and CAM to rats.
VER, DLZ, ENX, CPFX, and CAM were administered through the femoral vein at doses of 5, 5, 10, 10, and 10 mg/kg, respectively. VER, DLZ, ENX, CPFX, and CAM were administered through the portal vein at doses of 20, 20, 10, 10, and 10 mg/kg, respectively. Each point and vertical bar represent the mean ± S.D. (n = 4–7).
Pharmacokinetic parameters of VER, DLZ, ENX, CPFX, and CAM in rats
CB/CP Ratios,KB Values, and fP of Various Drugs.
Table 2 shows the CB/CP ratios of various drugs. In all drugs CB/CPratios were within the range of 0.68 to 1.1 and were constant within the concentration range of 0.5 to 10 μg/ml.KB values of various drugs were calculated by eq. 8 and are listed in Table 3. The average KB,app at 15 min, 1, 4, 8, and 24 h after i.v. administration was used for ITZ. TheKB,app values at the steady state obtained previously were used for KTZ, CIM, and NIZ (Takedomi et al., 1998;Yamano et al., 1999). Because the KB,appvalues of ENX, CPFX, CAM, VER, and DLZ reached a pseudosteady state (at β phase) at 3 h after i.v. administration in a preliminary experiment, the KB,app values at 3 h after i.v. administration were used for these drugs.
Blood/plasma concentration ratio of various drugs
Plasma protein binding and uptake into liver of inhibitors
Table 3 shows the fP of various drugs. The fP varied from 0.0034 for ITZ to 0.96 for NIZ. The maximum of apparent KBf(KB,app/fP) and the minimum were 6100 for ITZ and 3.0 for NIZ, respectively.
Because the KB,real values of VER and DLZ may be much larger than the KB,app values due to their large hepatic extraction ratio, hepatic extraction ratios were determined to calculate the KB,realvalues. The real KBf values of VER and DLZ were 600 and 73 and were 4.9- and 4.6-fold compared with the apparentKBf values, respectively. The realKBf values of ENX, CPFX, and CAM were 9.3, 11, and 36, respectively, and were very close to the apparentKBf values.
Uptake of Various Drugs into Isolated Rat Hepatocytes.
Figure 2 shows the time course of uptake of various drugs into isolated rat hepatocytes. The uptake of KTZ, VER, DLZ, ENX, CPFX, and CAM reached equilibrium in 5 min, whereas it took 10 min to reach equilibrium for ITZ. In the concentration-dependence study, incubation times were set to reach equilibrium for each drug.
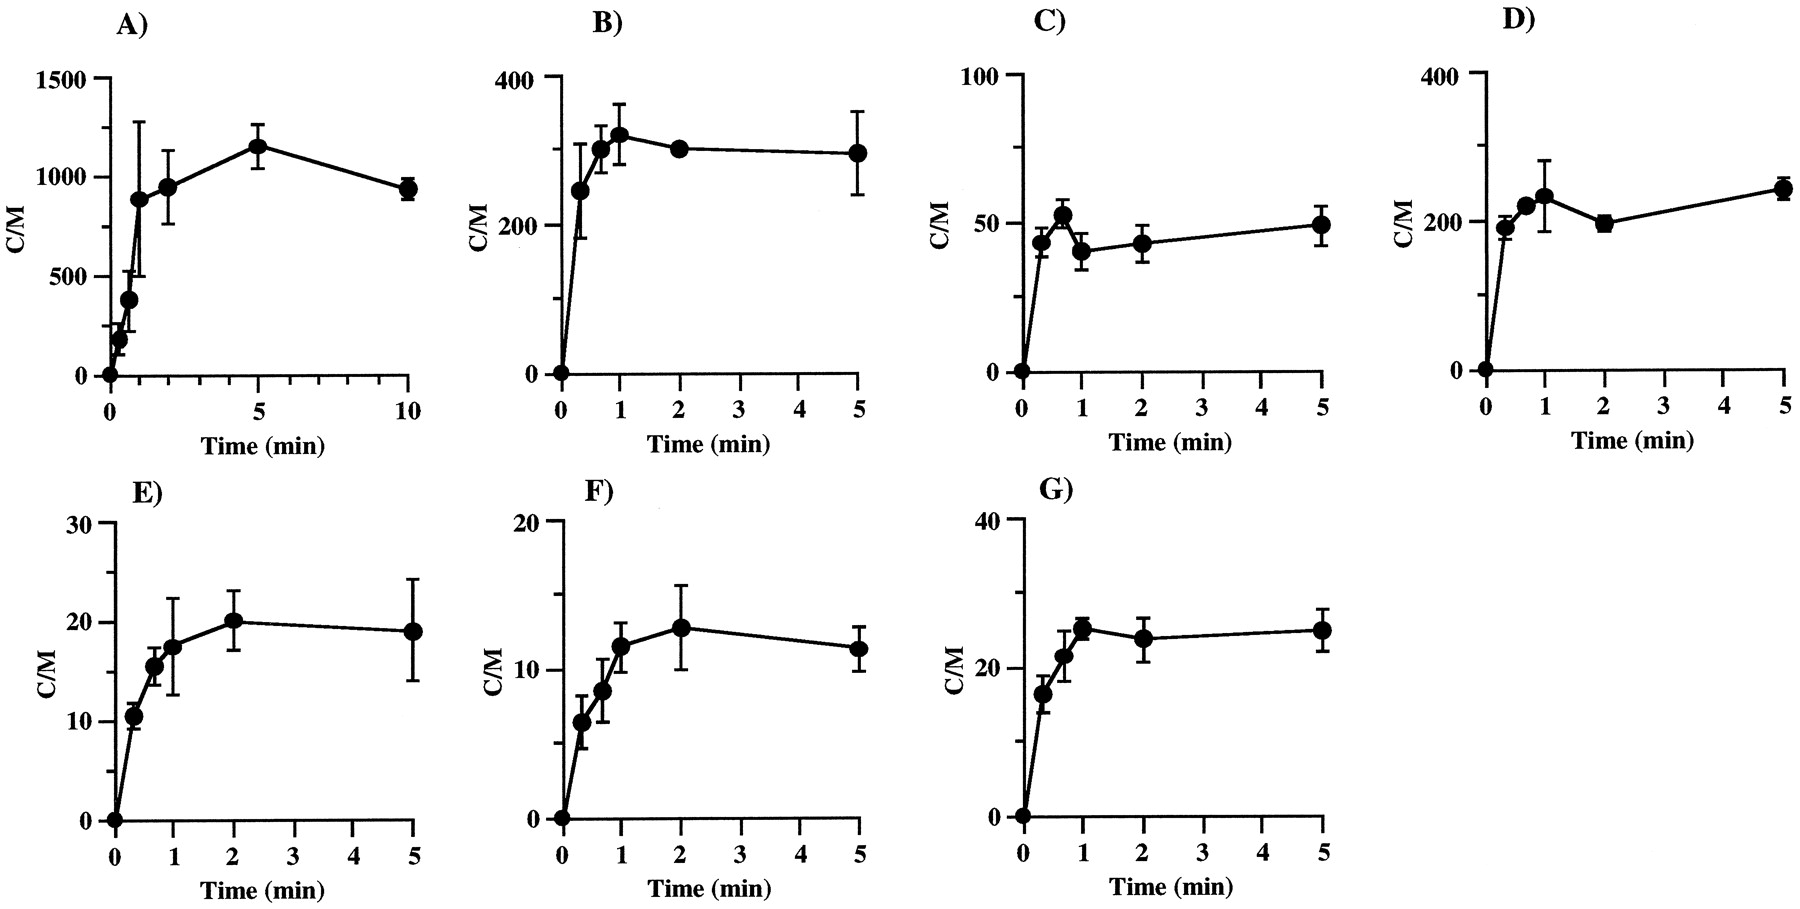
Time courses of ITZ (A), KTZ (B), DLZ (C), VER (D), ENX (E), CPFX (F), and CAM (G) uptake by isolated rat hepatocytes.
The concentrations of drugs in the incubation medium were 1 μg/ml. Each point and vertical bar represent the mean ± S.D. (n = 3).
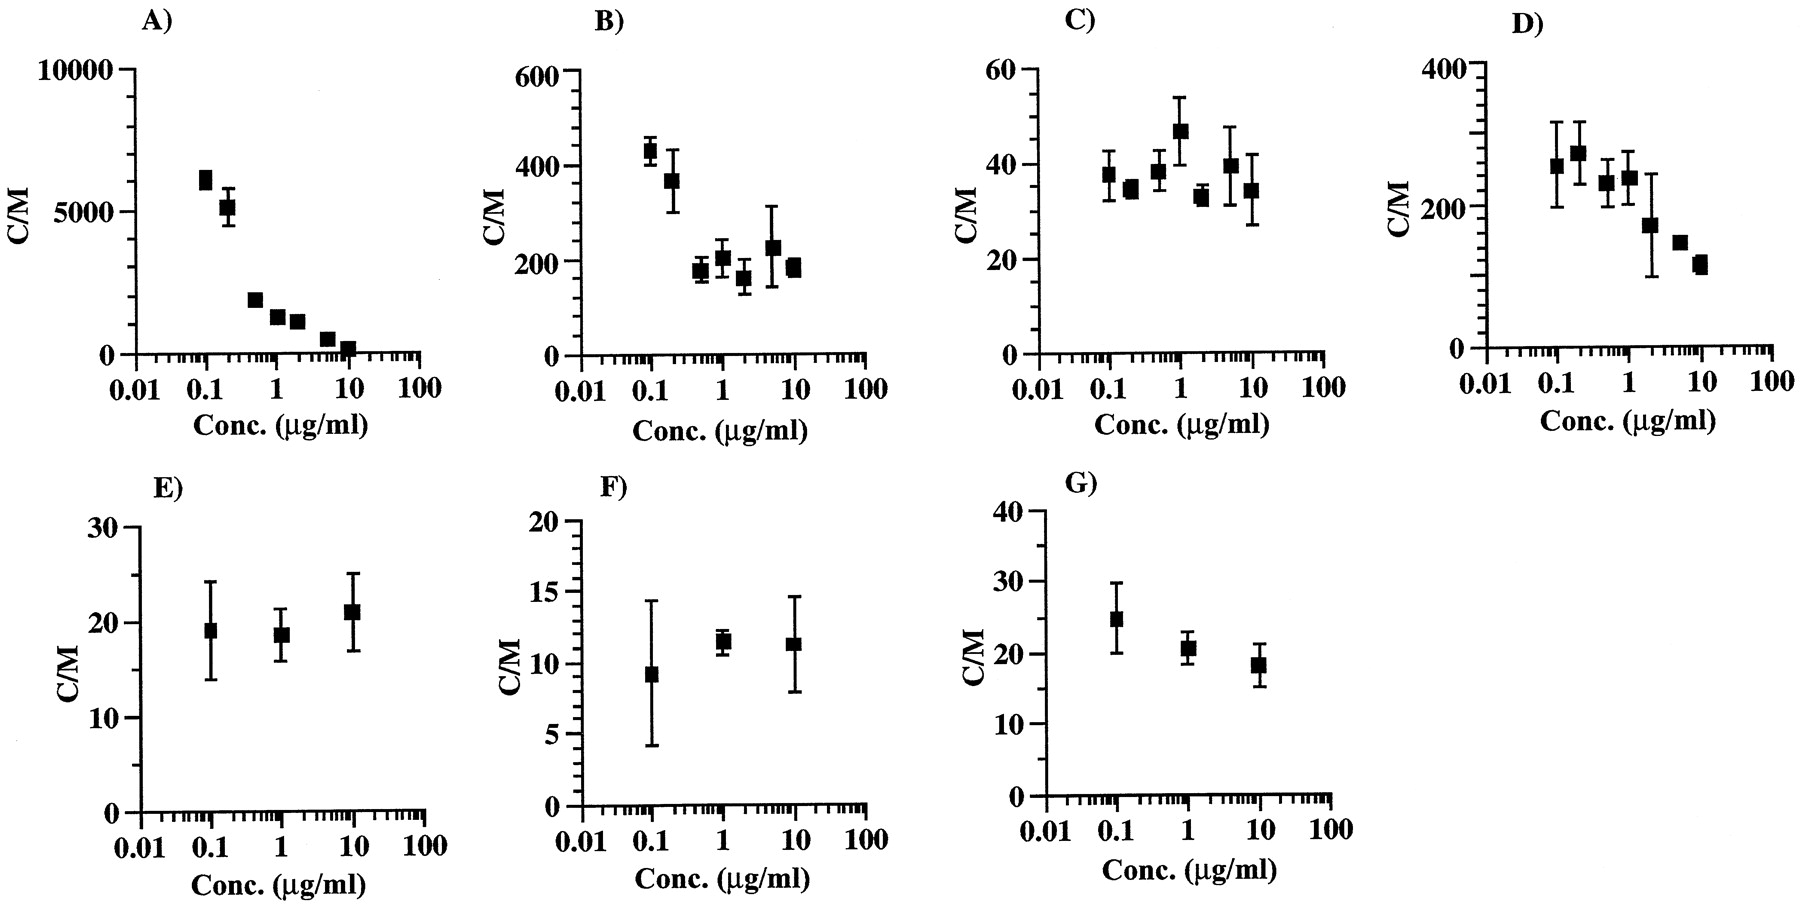
Figure 3 shows the concentration dependence on uptake of various drugs into isolated rat hepatocytes. The uptake of ITZ showed marked concentration dependence. The C/M ratios of ITZ were ∼200 and 6000 at the concentrations of 10 and 0.1 μg/ml, respectively. The concentration-dependence degree of uptake of KTZ and VER was smaller than that of ITZ, whereas the concentration dependence for DLZ, ENX, CPFX, and CAM was negligible.

Concentration dependence of ITZ (A), KTZ (B), DLZ (C), VER (D), ENX (E), CPFX (F), and CAM (G) uptake by isolated rat hepatocytes.
The incubation times for ITZ and other drugs were 10 and 5 min, respectively. Each point and vertical bar represent the mean ± S.D. (n = 3).
Correlation between In Vivo Distribution to Liver and In Vitro Uptake by Isolated Rat Hepatocytes.
The correlation between C/M ratios of drugs on the uptake into isolated rat hepatocytes and KBf values in rat liver was investigated for the evaluation of the usefulness of the in vitro experiments for predicting the concentrations in the liver after administration of the inhibitors. C/M ratios at concentrations nearly equal to the unbound concentrations in the plasma were used to investigate the correlation between C/M ratios and theKBf values of each drug except for ITZ. Because the unbound concentrations of CIM and NIZ after infusion at the rate of 5.7 and 11.4 mg/h/body to rats were 0.5 to 5 and 1 to 5 μg/ml, respectively, C/M ratios at the added concentrations of 3 μM (0.76 μg/ml) and 3 μM (0.99 μg/ml) were quoted for CIM and NIZ (Nakamura et al., 1994), respectively. The unbound concentrations of ITZ in the plasma after i.v. administration at the dose of 20 mg/kg to rats were within the range of 5 to 20 ng/ml, but it was difficult to determine C/M ratio of ITZ at such a low concentration. In this study, C/M ratio at an added concentration of 100 ng/ml was used because there was no significant difference between C/M ratios at the added concentrations of 0.1 and 0.2 μg/ml, suggesting constant C/M ratios at the lower concentration. Figure 4shows the correlation between C/M ratios andKBf values of the nine drugs. There was an excellent correlation with a slope of unity between logarithm of C/M ratios and KBf values (r = 0.981).

Correlation between C/M ratios on uptake by isolated rat hepatocytes and liver/blood concentration ratios.
Discussion
To develop a methodology to predict the risk of drug-drug interactions quantitatively, it is necessary to solve four problems: 1) prediction of the disposition of inhibitors in the liver is very important because many drugs are transported into the liver by carrier-mediated hepatic uptake systems (Meijer et al., 1990; Yamazaki et al., 1996) and unbound concentrations in the liver are higher than those in the plasma; 2) prediction of the concentrations of inhibitors in the portal vein or the hepatic vein is necessary because in the clinical field, most drugs are orally administered and the drug concentration in the portal vein is higher than that in the systemic circulation (Hoffman et al., 1995; Tabata et al., 1995; Fujieda et al., 1996); 3) prediction of drug-drug interactions on the metabolic process in the intestine (jujunal, ileum) as well as in the liver is necessary because CYP3A4 activity in the intestine is half as much as that in the liver. It was reported that MDZ and cyclosporin were metabolized by CYP3A4 in the intestine (Paine et al., 1996; Thummel et al., 1996); and 4) prediction of the drug-drug interactions on the absorption process is necessary because P-glycoprotein exists in the intestine and takes part in the secretion of drugs.
However, we suggest that it is difficult to solve all above-mentioned problems at the same time. To evaluate the extent of drug-drug interactions concerning metabolic inhibition in the liver quantitatively, we tried to predict the plasma concentration increasing ratio (R) of MDZ in rats by using MDZ with concomitant administration of ITZ, KTZ, CIM, and NIZ as inhibitors (Takedomi et al., 1998; Yamano et al., 1999). Assuming that the interaction of drug metabolism is of a competitive inhibition type, the increasing ratio of plasma concentration can be estimated with the following equation: Equation 10where I and Ki represent the concentration of inhibitor and inhibition constant, respectively. The increasing ratios predicted with the unbound concentration in the plasma were underestimated, whereas the increase ratios predicted with the unbound concentration in the liver were very close to the observed increase value. The liver unbound concentration to the plasma unbound concentration ratios of the inhibitors were >1, suggesting a concentrative uptake of these drugs into the liver. Because the metabolic enzymes are localized on the endoplasmic reticulum in the hepatocytes and are physically separated from the blood by the plasma membrane, the unbound concentrations in the liver may be more appropriate for predicting the increase rate of plasma concentration quantitatively. In humans, the liver unbound concentrations of the inhibitors are required. However, it is difficult to measure directly the liver unbound concentrations of the inhibitors; therefore, a methodology to predict the concentrations in the liver after administration of the inhibitors is necessary. We tried to predict the concentrations in the liver after administration of drugs to rats. First, we investigated the correlation between theKBf values in rats and C/M ratios of the uptake into isolated rat hepatocytes. Second, we examined the possibility of the prediction of the concentration in the liver with C/M ratios and the concentrations in the plasma or the blood.
As C/M ratios of the uptake into isolated rat hepatocytes were the values when the uptake of drugs reached equilibrium, theKBf values in rats when the liver concentrations were in parallel with the concentrations in the plasma or blood were used. As for VER and DLZ, the liver is the main disappearance organ and the majority of the total clearance is the hepatic clearance. The total clearances after i.v. administration of VER and DLZ were 43.4 ± 4.2 and 63.9 ± 6.3 ml/min/kg (mean ± S.D., n = 4), respectively, and were similar to the hepatic blood flow rates. TheKB,real values of VER and DLZ may be much larger than the KB,app values because of their large hepatic extraction ratio. Therefore, their hepatic extraction ratios were calculated from AUC after intraportal and i.v. administration and then the KB,real values were calculated according to eq. 7. The total clearances after i.v. administration of ENX and CPFX were 38.7 ± 2.0 and 51.9 ± 14.4 ml/min/kg (mean ± S.D., n = 4), respectively, but the elimination routes were both via hepatic metabolism and renal excretion and the hepatic clearances of ENX and CPFX were 12 and 25 ml/min/kg, respectively (Davis et al., 1995) and were much less than the hepatic blood flow rate. Therefore, theKBf values calculated from the hepatic clearance and the hepatic blood flow rate were close to the realKBf values.
The concentration-dependent uptake of ITZ, KTZ, and VER into isolated rat hepatocytes was observed and suggested saturable carrier-mediated uptake, whereas the uptakes of other drugs into isolated rat hepatocytes were not dependent on drug concentrations. Figure 4 shows the good correlation between C/M ratios of drugs and realKBf values in rats. Therefore, drug concentrations in the liver (CH) after administration to rats can be predicted from C/M on the uptake into rat isolated hepatocytes and drug concentrations in blood, as in eq. 11:
Footnotes
-
Send reprint requests to: Katsuhiro Yamano, Biopharmaceutical and Pharmacokinetic Research Laboratories, Fujisawa Pharmaceutical Co., Ltd., 1-6, Kashima 2-chome, Yodogawa-ku, Osaka 532-8514, Japan.
- Abbreviations used are::
- AUC
- area under the concentration-time curve
- MDZ
- midazolam
- ITZ
- itraconazole
- KTZ
- ketoconazole
- CIM
- cimetidine
- CAM
- clarithromycin
- NIZ
- nizatidine
- C/M
- concentration in cells to concentration in medium ratio
- KBf
- liver concentration to unbound concentration in blood ratio
- ENX
- enoxacin
- CPFX
- ciprofloxacin
- CAM
- clarithromycin
- VER
- verapamil
- DLZ
- diltiazem
- KP
- liver/plasma concentration ratio
- AUCiv
- area under the plasma concentration-time curve after i.v. administration
- AUCpv
- area under the plasma concentration-time curve after intraportal administration
- KB
- real liver/blood concentration ratio
- KB,app
- apparent liver/blood concentration ratio
- QH
- hepatic blood flow rate
- VH
- volume of liver
- fb
- unbound fraction in blood
- fP
- unbound fraction in plasma
- CB
- concentration in blood
- CP
- concentration in plasma
- R
- increasing ratio
- Received February 16, 1999.
- Accepted June 15, 1999.
- The American Society for Pharmacology and Experimental Therapeutics


