


Figures
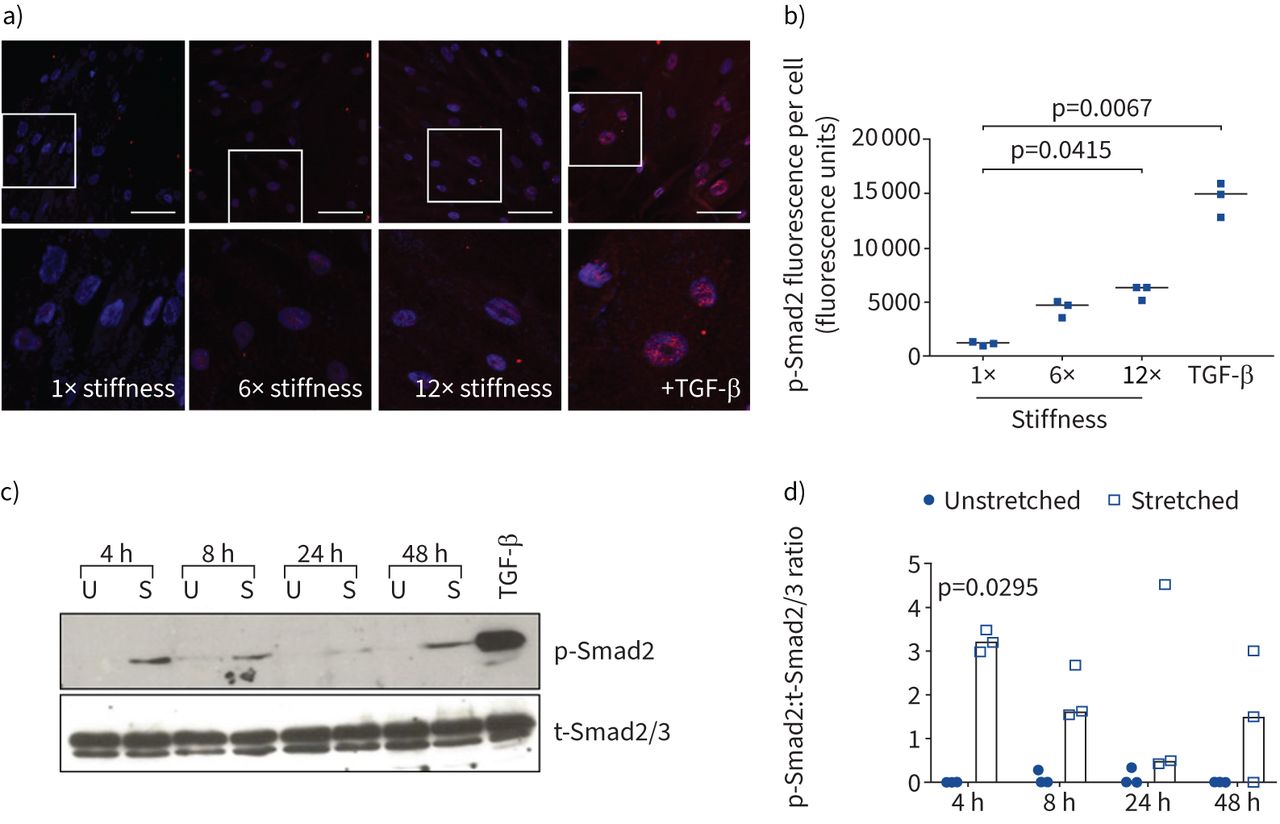
- FIGURE 1
Matrix stiffness and cell stretching mediates transforming growth factor-β (TGF-β) activation. a) Representative images of airway smooth muscle (ASM) cells cultured on gelatin methacrylol substrates of increasing stiffness (1×, 6× and 12× that of physiological stiffness [22]) and stained for phosphorylated Smad2 (p-Smad2) and 4′,6-diamidino-2-phenylindole. TGF-β (5 ng·mL−1) was used as a positive control. Scale bar: 50 μm. Boxed area is shown at higher magnification to better visualise nuclear p-Smad2. b) Nuclear p-Smad2 in a) was quantified. Data are presented as median fluorescence units from cells of three individual donors. Cell number analysed was 106–305 per donor per condition. The experiment was independently repeated twice. The Kruskal–Wallis nonparametric test with Dunn's multiple comparison test was used. c) ASM cells were stretched (15%, 0.3 Hz (S)) or left unstretched (U). p-Smad2 and total Smad2/3 (t-Smad2/3) were measured by Western blotting. Blot shown is representative of n=3 donor cells. d) Densitometric analysis of the Western blots outlined in c) was performed and data are presented as median p-Smad2:t-Smad2/3 ratio. The Kruskal–Wallis nonparametric test with Dunn's multiple comparison test was used.
- FIGURE 2
Basal transforming growth factor-β (TGF-β) activation is enhanced in asthma and influenced by the extracellular matrix (ECM). a) TGF-β activity in airway smooth muscle (ASM) cells was measured by the transformed mink lung epithelial cell (TMLC) reporter cell assay. Data are presented as median fold change in TGF-β activity in pg·mL−1 per 104 cells versus the mean data for nonasthmatic cells. The nonparametric Mann–Whitney test was used. b) Basal phosphorylated Smad2 (p-Smad2) levels were measured by ELISA. Data are presented as median optical density at 450 nm (OD450). The nonparametric Mann–Whitney test was used. c) Cell contractility was measured using a collagen gel contraction assay. Data are presented as median percentage contraction of the collagen gel. The nonparametric Mann–Whitney test was used. d) Basal TGF-β activity in a) was correlated with basal cell contractility in c) using a Spearman correlation and the R2-value calculated. e) Nonasthmatic (NA) ASM cells were cultured on asthmatic (A) ECM and vice versa prior to determination of TGF-β activity by the TMLC assay. Data for cells from individual donors are presented as relative levels when cultured on the cell's own ECM. Blue dotted line denotes no change in TGF-β activity. Data are presented as mean±sd relative TGF-β activity. The one-sample t-test was used.
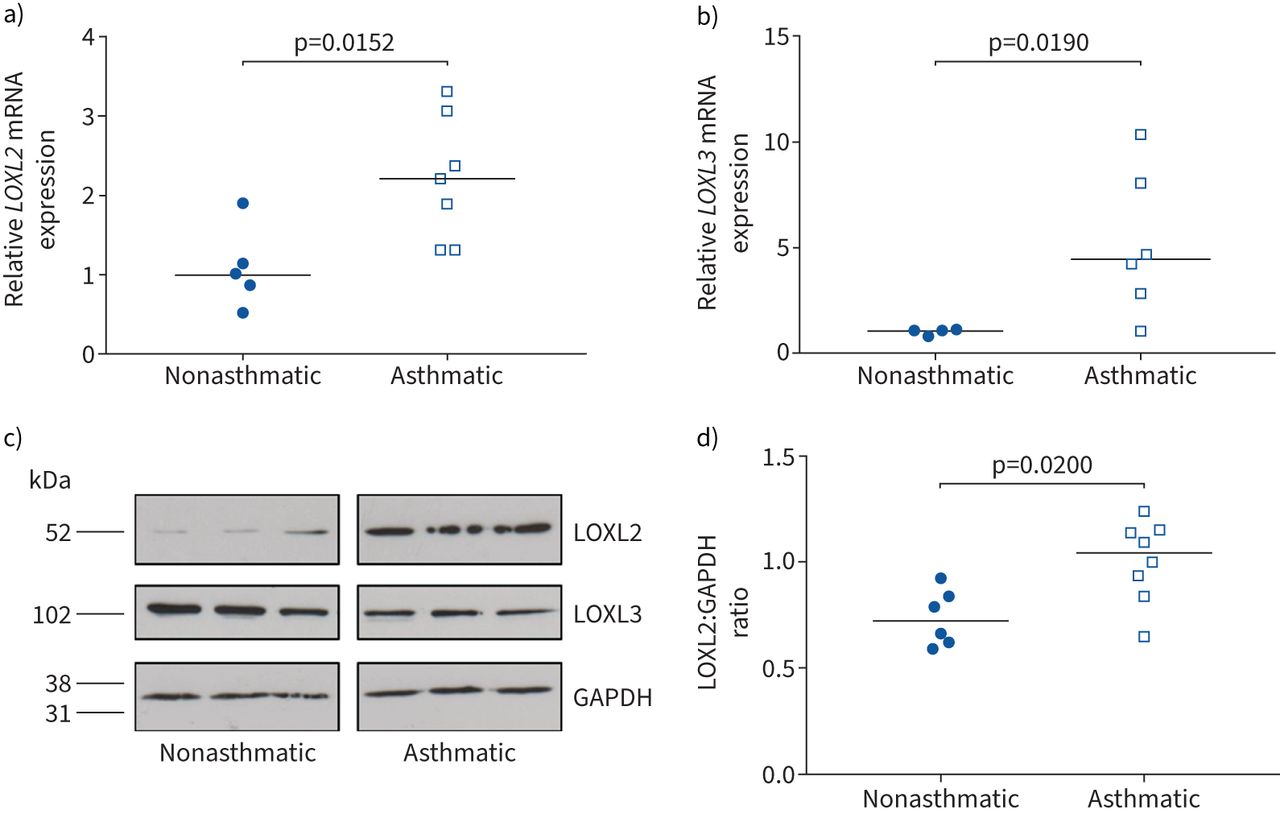
- FIGURE 3
Lysyl oxidase like 2 (LOXL2) expression is increased in asthmatic airway smooth muscle (ASM) cells. a, b) Expression of a) LOXL2 and b) LOXL3 mRNA was determined by quantitative reverse transcriptase-PCR. Data are presented as median fold change versus mean of the nonasthmatic group. The nonparametric Mann–Whitney test was used. c) Representative Western blots for LOXL2, LOXL3 and GAPDH in nonasthmatic (n=3) and asthmatic (n=3) ASM cells. d) Densitometric analysis of Western blots for LOXL2 in c). Data are presented as median LOXL2:GAPDH ratio. The nonparametric Mann–Whitney test was used.
- FIGURE 4
Lysyl oxidase like 2 (LOXL2) is increased in asthmatic bronchial biopsies. a) Representative images demonstrating α-smooth muscle actin (α-SMA) and LOXL2 immunostaining in parallel sections from biopsies from a nonasthmatic and an asthmatic donor. Scale bar: 500 μm. b) Quantification of LOXL2 staining in human bronchial biopsies described in a) shown as percentage of α-SMA-positive regions that were positive for LOXL2. The nonparametric Mann–Whitney test was used.
- FIGURE 5
Lysyl oxidase like 2 (LOXL2) inhibition affects airway smooth muscle (ASM) matrix stiffness in vitro. a) Atomic force microscopy of extracellular matrix (ECM) deposited cells cultured with LOXL2 inhibitor (PAT1251; 1 µM) or dimethyl sulfoxide (DMSO) vehicle control. Data are presented as median ECM stiffness (kPa). The Kruskal–Wallis nonparametric test with Dunn's multiple comparison test was used. b) Asthmatic ASM cells were cultured for 3 days with LOXL2 inhibitor (PAT1251; 1 µM) or DMSO control and then TGF-β activity assessed. Data are presented as median TGF-β activity relative to DMSO control. The one-sample t-test was used.
- FIGURE 6
Lysyl oxidase like 2 (LOXL2) inhibition in vivo protects mice against ovalbumin (OVA) challenge-induced weight loss. a) Body mass data from mice challenged with OVA and treated with either vehicle control or LOXL2 inhibitor (PAT1251; 30 mg·kg−1). Data are presented as median with interquartile range. Two-way ANOVA was used. b) The total number of bronchoalveolar lavage fluid (BALF) inflammatory cells was quantified and presented as mean±sem number of inflammatory cells. The Kruskal–Wallis nonparametric test with Dunn's multiple comparison test was used. c) Representative images of haematoxylin/eosin-stained lung tissue. Images are representative of n=8 animals per group. Scale bar: 100 μm.
- FIGURE 7
Lysyl oxidase like 2 inhibition in vivo reduces chronic ovalbumin (OVA) challenge-induced airway remodelling. a) Representative images of Masson's trichrome-stained lung tissue. Images are representative of n=8 animals per group. Scale bar: 100 μm. b) Representative images of α-smooth muscle actin (α-SMA) and 4′,6-diamidino-2-phenylindole-stained lung tissue. Images are representative of the following group sizes: PBS+vehicle control n=8, PBS+PAT1251 n=7, OVA+vehicle n=7 and OVA+PAT1251 n=8. Scale bar: 100 μm. A negative control image is shown in supplementary figure S4. c) α-SMA staining around small airways (<100 µm radius) was quantified. Data are presented as mean α-SMA area per µm radius. The Kruskal–Wallis nonparametric test with Dunn's multiple comparison test was used.


Supplementary Materials
Supplementary Material
Please note: supplementary material is not edited by the Editorial Office, and is uploaded as it has been supplied by the author.
Supplementary methods ERJ-04361-2020.Methods
Supplementary figure S1. a) GelMa substrates (5, 10 and 15% GelMa wt/vol) were subjected to compressive modulus using texture analyser to determine the relative stiffness. 5% GelMa was approximately equivalent to the described stiffness of tracheal smooth muscle [22] and so was denoted as 1x stiffness. b) TGFB1 mRNA was determined by qRT-PCR. Data is expressed as median fold change versus mean of the non-asthmatic group. Non-parametric Mann Whitney test was used. c) TGFB2 mRNA was determined by qRT-PCR. Data is expressed as median fold change versus mean of the non-asthmatic group. Non-parametric Mann Whitney test was used. d) TGFB3 mRNA was determined by qRT-PCR. Data is expressed as median fold change versus mean of the non-asthmatic group. Non-parametric Mann Whitney test was used. ERJ-04361-2020.Figure_S1
Supplementary figure S2. a) Basal traction force was determined using traction force microscopy. Data is presented as median root mean square traction (n) across all donor cell lines tested. Non-parametric Mann Whitney test was used. b) ASM cells were subjected to stretch (15%, 0.3Hz (S)) or left unstretched (U) for 4 h. PSmad2, total Smad2/3 and GAPDH were measured by western blotting. Figure shown is representative of n=6 non-asthmatic and n=6 asthmatic donor cell lines. Densitometrical analysis of all blots was performed and data is expressed as ratio PSmad2:tSmad2/3. Kruskall Wallis non-parametric test with Dunn’s multiple comparison test was used. c) Data from figure 2e are expressed here in a format that allows comparison of the effect of ECM on basal TGF-β activity for both non-asthmatic and asthmatic ASM cells. Mann Whitney was used to test for a difference between the ECM effect delta between non-asthmatic and asthmatic cells (p=0.0159). ERJ-04361-2020.Figure_S2
Supplementary figure S3. a) TGM2 mRNA in ASM cells was determined by qRT-PCR. Data is expressed as median fold change versus the mean data from the non-asthmatic group. Non-parametric Mann Whitney test was used, b) LOX mRNA in ASM cells was determined by qRT-PCR. Data is expressed as median fold change versus the mean data from the non-asthmatic group. Non-parametric Mann Whitney test was used. c) LOXL1 mRNA in ASM cells was determined by qRT-PCR. Data is expressed as median fold change versus the mean data from the non-asthmatic group. Non-parametric Mann Whitney test was used. d) LOXL4 mRNA in ASM cells was determined by qRT-PCR. Data is expressed as median fold change versus the mean data from the non-asthmatic group. Non-parametric Mann Whitney test was used. e) Densitometrical analysis of LOXL3 western blots (figure 3c). Data is expressed as median ratio LOXL3:GAPDH. Non-parametric Mann Whitney test was used. ERJ-04361-2020.Figure_S3
Supplementary figure S4. a) Starting body mass data from mice in the in vivo model of asthma. Non-parametric Kruskall-Wallis with Dunn’s multiple comparison test was used. b) The median percentage of eosinophils within the inflammatory cell population of BALF (figure 6b) was determined by differential cell count. Non-parametric Kruskall-Wallis with Dunn’s multiple comparison test was used. c) The median percentage of neutrophils within the inflammatory cell population of BALF (figure 6b) was determined by differential cell count. Non-parametric Kruskall-Wallis with Dunn’s multiple comparison test was used. d) The median percentage of lymphocytes within the inflammatory cell population of BALF (figure 6b) was determined by differential cell count. Non-parametric Kruskall-Wallis with Dunn’s multiple comparison test was used. e) The median percentage of macrophages within the inflammatory cell population of BALF (figure 6b) was determined by differential cell count. Non-parametric Kruskall-Wallis with Dunn’s multiple comparison test was used. f) Representative negative control image for α-SMA immunofluorescence staining in figure 7b. g) Representative images of picro-Sirius red stained mouse lung tissue from the ovalbumin model. Tissue from animals treated with vehicle control was imaged using polarised light microscopy (i) and under brightfield light (ii). Similarly, tissue from animals treated with the LOXL2 inhibitor (PAT1251) was imaged using polarised light microscopy (i) and under brightfield light (ii). ERJ-04361-2020.Figure_S4
Supplementary table S1. Table detailing materials used in the manuscript, including suppliers and clone details of all antibodies used. ERJ-04361-2020.Table_S1
Supplementary table S2. Table describing primer sequences for qRT-PCR. All primers were designed using Primer3 online software. ERJ-04361-2020.Table_S2
Supplementary Material
This one-page PDF can be shared freely online.
Shareable PDF ERJ-04361-2020.Shareable


