


Figures
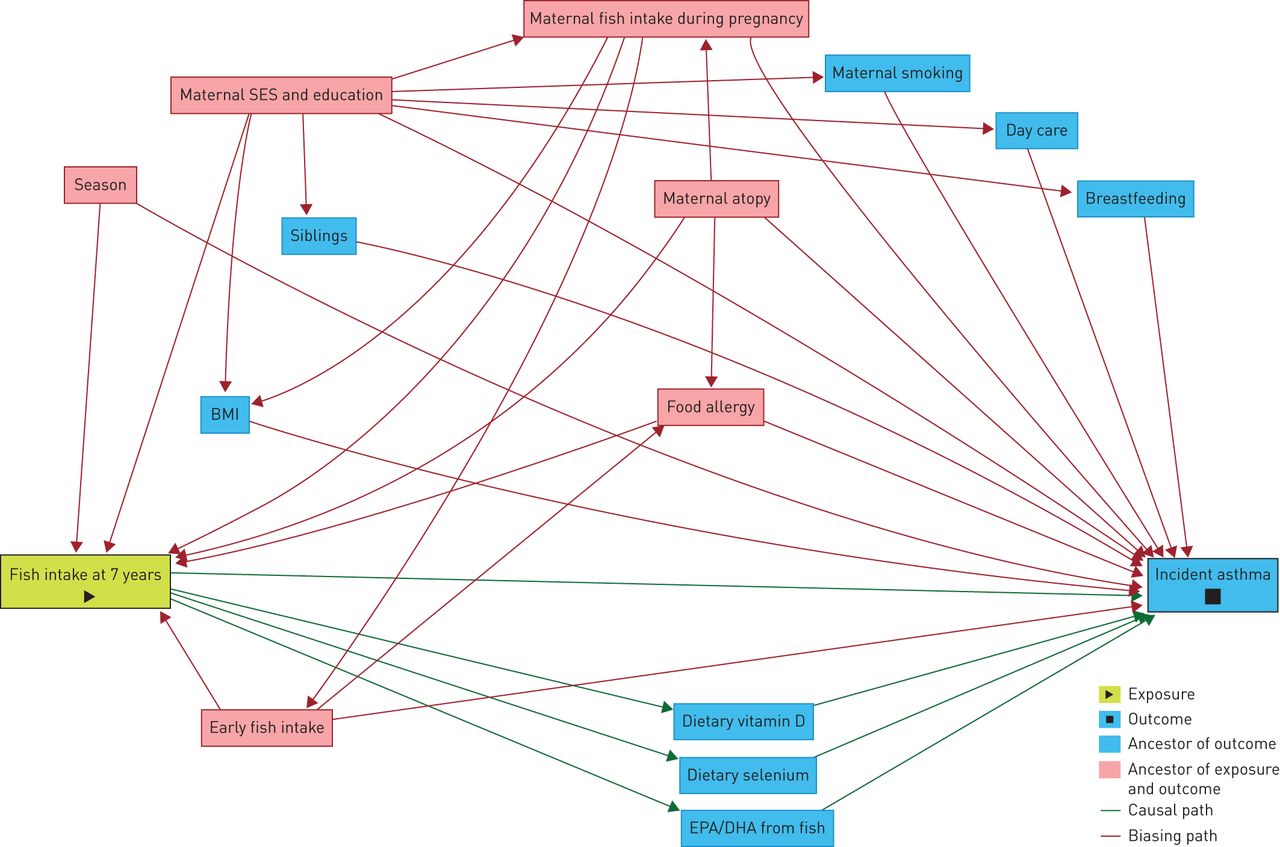
- FIGURE 1
Directed acyclic graph to study covariates and potential structural confounding bias for the association between child's fish intake at 7 years and incident asthma risk. SES: socioeconomic status; BMI: body mass index; EPA: eicosapentaenoic acid; DHA: docosahexaenoic acid.
- FIGURE 2
Dose–response relationship between eicosapentaenoic acid (EPA) plus docosahexaenoic acid (DHA) from fish and risk of incident asthma a) overall, b) in those homozygous for the major A allele and c) in carriers of the minor G allele using restricted cubic spline analysis in the Avon Longitudinal Study of Parents and Children. The model was adjusted for sex, total energy intake at 7 years, maternal education, housing tenure during pregnancy, financial difficulty during pregnancy, maternal ethnicity, maternal history of atopic disease, maternal age at delivery, exclusive breastfeeding, childcare by day nursery at 15 months of age, maternal smoking, older sibling, younger sibling and season when the food frequency questionnaire was completed. 56.3% of children were in the rs1535 GA/GG genotype group. The range of EPA plus DHA intake from fish was 0–675 mg·day−1 with skewness, so this was truncated for presentation purposes.

Tables
- TABLE 1
Participant characteristics according to quartiles of eicosapentaenoic acid (EPA) plus docosahexaenoic acid (DHA) intake from fish at 7 years# of age in the Avon Longitudinal Study of Parents and Children
Quartiles of EPA plus DHA intake from fish p-value Quartile 1 Quartile 2 Quartile 3 Quartile 4 Participants 1050 (23.1) 1028 (22.6) 1325 (29.2) 1140 (25.1) EPA plus DHA intake mg·day−1 5.46±4.49 21.6±2.46 42.4±11.4 129±77.8 Male 540 (51.4) 543 (52.8) 590 (44.5) 560 (49.1) <0.001 Total energy intake kJ·day−1 7084±1653 7486±1649 7696±1660 7952±1772 <0.001 BMI kg·m−2 16.1±1.9 16.2±1.9 16.1±1.9 16.1±2.0 0.74 BMI at 13.5 years kg·m−2 20.2±3.30 20.4±3.42 20.1±3.20 20.0±3.12 0.11 Health-conscious dietary pattern score −0.14±1.08 −0.28±0.80 −0.01±0.84 0.43±0.97 <0.001 Any supplement use 360 (34.3) 329 (32.0) 425 (32.1) 431 (37.8) 0.01 Season of dietary information collection 0.52 Winter 286 (27.2) 283 (27.5) 326 (24.6) 285 (25.0) Spring 323 (30.8) 306 (29.8) 389 (29.4) 338 (29.6) Summer 271 (25.8) 275 (26.8) 381 (28.8) 340 (29.8) Autumn 160 (15.2) 158 (15.4) 212 (16.0) 166 (14.6) Missing 10 (1.0) 6 (0.6) 17 (1.3) 11 (1.0) Breastfeeding at 3 months <0.001 Never 177 (16.9) 196 (19.1) 189 (14.3) 114 (10.0) Stopped/non-exclusive 466 (44.4) 486 (47.3) 630 (47.5) 522 (45.8) Exclusive 359 (34.2) 313 (30.4) 451 (34.0) 453 (39.7) Missing 48 (4.6) 33 (3.2) 55 (4.2) 51 (4.5) Age at fish introduction <0.001 ≥9 months 316 (30.1) 207 (20.1) 264 (19.9) 168 (14.7) 6– <9 months 276 (26.3) 288 (28.0) 372 (28.1) 280 (24.6) <6 months 450 (42.9) 529 (51.5) 687 (51.8) 686 (60.2) Missing 8 (0.8) 6 (0.5) History of food allergy 177 (16.9) 148 (14.4) 196 (14.8) 224 (19.6) 0.002 Childcare by day nursery at 15 months 0.048 No 950 (90.5) 937 (91.1) 1172 (88.5) 1018 (89.3) Yes 65 (6.2) 60 (5.8) 119 (9.0) 92 (8.1) Missing 35 (3.3) 31 (3.0) 34 (2.6) 30 (2.6) Older siblings 585 (55.7) 527 (51.3) 658 (49.7) 583 (51.1) 0.03 Younger siblings 487 (46.4) 533 (51.8) 735 (55.5) 581 (51.0) <0.001 FADS genotype (rs1535) 0.38 AA 356 (42.9) 351 (43.1) 472 (43.8) 429 (47.1) GA 385 (46.4) 383 (47.0) 482 (44.7) 382 (41.9) GG 88 (10.6) 81 (9.9) 124 (11.5) 100 (11.0) Maternal factors Age years 29.5±4.5 29.3±4.5 29.2±4.3 29.9±4.3 <0.001 Education <0.001 Secondary or vocational 217 (20.7) 217 (21.1) 233 (17.6) 156 (13.7) O-level 342 (32.6) 392 (38.1) 490 (37.0) 337 (29.6) A-level or degree 482 (45.9) 404 (39.3) 591 (44.6) 629 (55.2) Missing 9 (0.9) 15 (1.5) 11 (0.8) 18 (1.6) Housing tenure during pregnancy 0.049 Mortgaged/owned 879 (83.7) 863 (83.9) 1138 (85.9) 979 (85.9) Council rented 61 (5.8) 73 (7.1) 57 (4.3) 48 (4.2) Non-council rented 67 (6.4) 50 (4.9) 68 (5.1) 70 (6.1) Missing 43 (4.1) 42 (4.1) 62 (4.7) 43 (3.8) Financial difficulty 0.07 No 891 (84.9) 898 (87.4) 1113 (84.0) 971 (85.2) Yes 153 (14.6) 125 (12.2) 211 (15.9) 163 (14.3) Missing 6 (0.6) 5 (0.5) 6 (0.5) Ethnicity 0.004 White 1028 (97.9) 1000 (97.3) 1302 (98.3) 1093 (95.9) Non-White 13 (1.2) 10 (1.0) 10 (0.8) 26 (2.3) Missing 9 (0.9) 18 (1.8) 13 (1.0) 21 (1.8) History of atopy 0.45 No 529 (50.4) 551 (53.6) 718 (54.2) 595 (52.2) Yes 485 (46.2) 444 (43.2) 563 (42.5) 497 (43.6) Missing 36 (3.4) 33 (3.2) 44 (3.3) 48 (4.2) Smoking when child 7 years old 0.50 No 864 (82.3) 821 (79.9) 1085 (81.9) 929 (81.5) Yes 162 (15.4) 168 (16.3) 205 (15.5) 179 (15.7) Missing 24 (2.3) 39 (3.8) 35 (2.6) 32 (2.8) EPA plus DHA intake from fish at 32 weeks of gestation mg·day−1 91.4±101 107±105 136±116 174±132 <0.001 Data are presented as n (%) or mean±sd, unless otherwise stated. BMI: body mass index; FADS: fatty acid desaturase. #: child characteristics pertain to 7 years of age unless otherwise stated.
- TABLE 2
Odds ratio for incident asthma at 11 or 14 years according to intake of fish at 7 years of age, stratified by child's fatty acid desaturase (FADS) genotype in the Avon Longitudinal Study of Parents and Children
Quartiles of fish intake ptrend- value# pinteraction- value Quartile 1 Quartile 2 Quartile 3 Quartile 4 Median (IQR) intake g·day−1 6.07 (0.00–8.57) 14.6 (13.7–20.4) 27.2 (24.3–29.3) 46.5 (40.4–58.6) Cases/non-cases 104/1034 55/586 138/1518 98/1086 Model 1 1.00 0.92 (0.65–1.30) 0.86 (0.66–1.13) 0.83 (0.61–1.11) 0.21 Model 2 1.00 0.92 (0.65–1.29) 0.86 (0.65–1.12) 0.82 (0.61–1.11) 0.20 Model 3 1.00 0.94 (0.67–1.33) 0.87 (0.66–1.14) 0.83 (0.62–1.13) 0.22 FADS genotype (rs1535): AA Cases/non-cases 28/360 24/198 61/540 32/385 Model 3 1.00 1.67 (0.92–3.02) 1.41 (0.87–2.30) 1.06 (0.61–1.85) 0.81 FADS genotype (rs1535): GA/GG Cases/non-cases 54/456 23/271 55/671 39/491 Model 3 1.00 0.66 (0.39–1.12) 0.64 (0.43–0.97) 0.59 (0.37–0.93) 0.03 0.22 Data are presented as n/n or OR (95% CI), unless otherwise stated. IQR: interquartile range. #: linear trend was tested by treating the median values of quartiles as a continuous variable. Multivariable model 1: sex and total energy intake at 7 years. Multivariable model 2: further adjusted for maternal education, housing tenure during pregnancy, financial difficulty during pregnancy and maternal ethnicity. Multivariable model 3: further adjusted for maternal history of atopic disease, maternal age at delivery, exclusive breastfeeding, childcare by day nursery at 15 months of age, maternal smoking, older sibling, younger sibling and season when the food frequency questionnaire was completed.
- TABLE 3
Odds ratio for incident asthma at 11 or 14 years according to intake of eicosapentaenoic acid (EPA) plus docosahexaenoic acid (DHA) from fish at 7 years of age, stratified by child's fatty acid desaturase (FADS) genotype in the Avon Longitudinal Study of Parents and Children
Quartiles of EPA plus DHA intake from fish ptrend- value# pinteraction- value Quartile 1 Quartile 2 Quartile 3 Quartile 4 Median (IQR) intake mg·day−1 5.51 (0.00–6.67) 22.1 (22.1–22.1) 41.9 (32.2–48.7) 94.0 (78.9–141) Cases/non-cases 100/950 81/947 112/1213 97/1043 Model 1 1.00 0.80 (0.59–1.09) 0.86 (0.65–1.14) 0.86 (0.64–1.15) 0.56 Model 2 1.00 0.80 (0.59–1.09) 0.85 (0.64–1.14) 0.86 (0.63–1.16) 0.55 Model 3 1.00 0.82 (0.60–1.11) 0.87 (0.65–1.16) 0.86 (0.64–1.17) 0.56 FADS genotype (rs1535): AA Cases/non-cases 26/330 28/323 48/424 43/386 Model 3 1.00 1.10 (0.62–1.95) 1.51 (0.90–2.55) 1.43 (0.83–2.46) 0.19 FADS genotype (rs1535): GA/GG Cases/non-cases 54/419 39/425 43/563 32/450 Model 3 1.00 0.71 (0.45–1.10) 0.54 (0.35–0.83) 0.49 (0.31–0.79) 0.006 0.006 Data are presented as n/n or OR (95% CI), unless otherwise stated. IQR: interquartile range. #: linear trend was tested by treating the median values of quartiles as a continuous variable. Multivariable model 1: sex and total energy intake at 7 years. Multivariable model 2: further adjusted for maternal education, housing tenure during pregnancy, financial difficulty during pregnancy and maternal ethnicity. Multivariable model 3: further adjusted for maternal history of atopic disease, maternal age at delivery, exclusive breastfeeding, childcare by day nursery at 15 months of age, maternal smoking, older sibling, younger sibling and season when the food frequency questionnaire was completed.
- TABLE 4
Odds ratio for incident asthma at 12 or 16 years of age, according to intake of eicosapentaenoic acid (EPA) plus docosahexaenoic acid (DHA) from fish at 8 years of age, stratified by fatty acid desaturase (FADS) genotype in BAMSE (replication study)
Quartiles of EPA plus DHA intake from fish ptrend- value# pinteraction- value Quartile 1 Quartile 2 Quartile 3 Quartile 4 Median (IQR) intake mg·day−1 33.7 (18.5–47.4) 90.5 (70.5–117) 178 (158–197) 291 (248–362) Cases/non-cases 45/476 39/486 33/514 33/511 Model 1 1.00 0.85 (0.54–1.33) 0.67 (0.42–1.07) 0.67 (0.42–1.07) 0.07 Model 2 1.00 0.85 (0.54–1.33) 0.66 (0.41–1.07) 0.61 (0.38–1.00) 0.04 Model 3 1.00 0.90 (0.57–1.41) 0.65 (0.40–1.06) 0.58 (0.35–0.96) 0.02 FADS genotype (rs1535): AA Cases/non-cases 16/166 14/174 13/164 15/164 Model 3 1.00 0.88 (0.41–1.92) 0.75 (0.33–1.70) 0.84 (0.37–1.88) 0.64 FADS genotype (rs1535): GA/GG Cases/non-cases 24/257 22/268 20/298 15/283 Model 3 1.00 0.96 (0.51–1.79) 0.72 (0.37–1.37) 0.52 (0.25–1.07) 0.05 0.03 Data are presented as n/n or OR (95% CI), unless otherwise stated. BAMSE: Swedish abbreviation for Children, Allergy, Milieu, Stockholm, Epidemiology; IQR: interquartile range. #: linear trend was tested by treating the median values of quartiles as a continuous variable. Multivariable model 1: sex and total energy intake at 8 years. Multivariable model 2: further adjusted for maternal education, parental occupation and maternal ethnicity. Multivariable model 3: further adjusted for maternal history of atopic disease, maternal age at delivery, exclusive breastfeeding, childcare by day nursery at 2 years of age, maternal smoking, older sibling and season when the food frequency questionnaire was completed.
Supplementary Material
Please note: supplementary material is not edited by the Editorial Office, and is uploaded as it has been supplied by the author.
Supplementary material ERJ-03633-2020.SUPPLEMENT
Supplementary Material
This one-page PDF can be shared freely online.
Shareable PDF ERJ-03633-2020.Shareable


