


Figures
- FIGURE 1
Schematic representation of analysed cell populations identified during flow cytometric analysis. Hierarchal organisation of all haematopoietic derived CD45+ cells of both lymphoid and myeloid lineages. NK: natural killer cells; NKT: natural killer T-cells; PMN: polymorphonuclear neutrophils; Baso: basophils; Eos: eosinophils; Mono: monocytes; Int: intermediate monocytes; Nonclass: nonclassical monocytes; DC: dendritic cells; pDC: plasmacytoid DC; Macs: macrophages. Italic letters (a–p) represent common cell populations, as identified in figure 2.
- FIGURE 2
Overview of gating strategy used in flow cytometric analysis. Analysed populations were first gated to remove cell clumps and debris, and dead cells were removed by viability exclusion. All leukocytes were selected using CD45-positivity and then divided into separate cell populations as shown. FSC-H: forward scatter height; FSC-A: forward scatter area; SSC: side scatter; HLA-DR: human leukocyte antigen – antigen D related; pDCs: plasmacytoid dendritic cells; NK: natural killer cells; NKT: natural killer T-cells. Boxes and italic lettering (a–p) represent common cell populations, as identified in figure 1.
- FIGURE 3
Principal component analysis plots of flow cytometric data separates idiopathic pulmonary arterial hypertension (IPAH) from control samples. The log odds ratios of subset analysis data obtained by flow cytometry using manual gating were used to construct a similarity matrix for the principal component analysis. The first two principal components (PC) with respective percentage variation are depicted. Bivariate plots of dimensionality reduction from a) 12 lungs (seven donor/five IPAH) including 21 cell populations; b) 31 lungs (15 donor/16 IPAH) and 18 cell populations.
- FIGURE 4
Global changes in inflammatory profiles. a) Sunburst plots showing average distribution of all cell populations in donor lungs and lungs from patients with idiopathic pulmonary arterial hypertension; b) heatmap representation presenting the patient-to-patient variability of the log odds ratio derived from cell number per mg tissue data for 18 individual cell populations. CTL: cytotoxic CD8+ T-lymphocytes; PMN: polymorphonuclear neutrophils; Macs: macrophages; Monos: monocytes; Int: intermediate; Nonclass: nonclassical; DCs: dendritic cells; pDCs: plasmacytoid DCs.
- FIGURE 5
T-stochastic neighbour embedding (t-SNE) visualisation and regulated cell populations in lung samples. a) t-SNE composite dimension plots of down-sampled and concatenated CD45+ cells derived from flow cytometric data with overlaid manually gated cell populations. b) Regulated cell populations differentially abundant between idiopathic pulmonary arterial hypertension and donor lungs as identified by flow cytometry. DCs: dendritic cells; pDCs: plasmacytoid dendritic cells. Boxplots show median and interquartile range.
- FIGURE 6
Abundance of cell populations in isolated pulmonary arteries. The presence of multiple cell populations (as shown for lung homogenate samples) measured in third- and fourth-generation pulmonary arteries by flow cytometry. a) T-cells; b) CD4+ T-cells; c) CD8+ T-cells; d) γδT-cells; e) mast cells; f) basophils; g) dendritic cells (CD209- CD11c+); h) dendritic cells (CD209- CD11c+ CD1a+); i) plasmacytoid dendritic cells. IPAH: idiopathic pulmonary arterial hypertension. Boxplots show median and interquartile range.
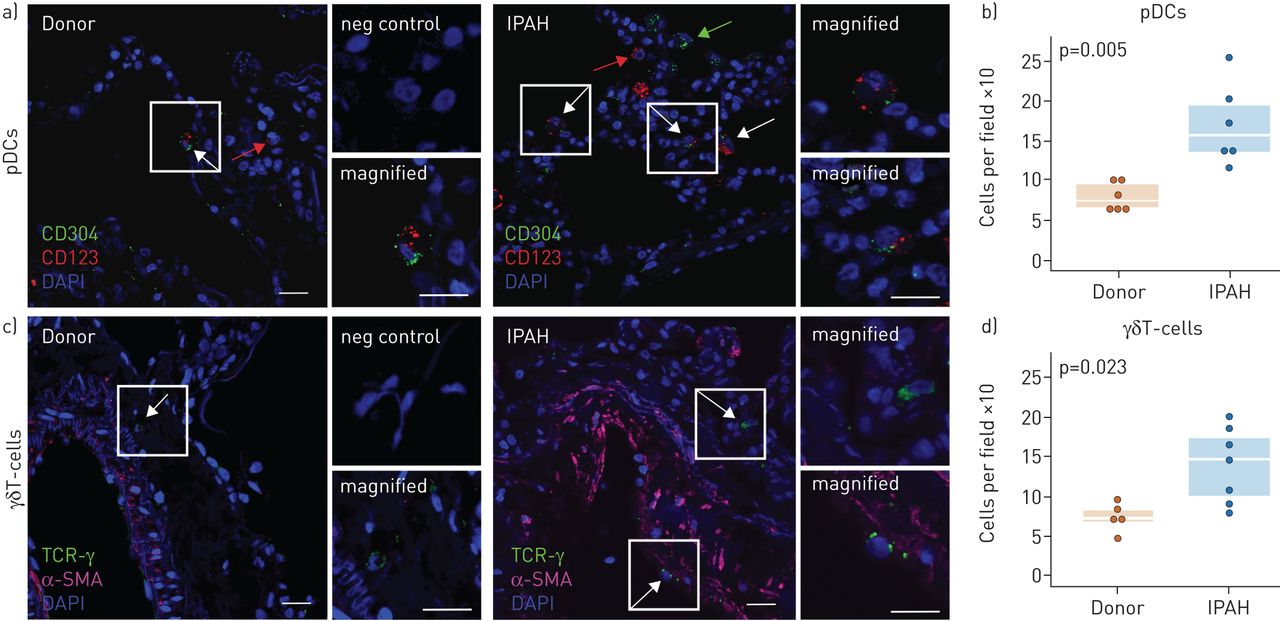
- FIGURE 7
Presence and localisation of plasmacytoid dendritic cells (pDCs) and γδT-cells in the lung. Immunofluorescence staining and quantification of idiopathic pulmonary arterial hypertension (IPAH) and donor lung tissue against a,b) CD123 (red) and CD304 (green) to detect pDCs (CD123+CD304+) and c,d) TCRγ (green) to detect γδT-cells. Smooth muscle actin (SMA) staining is shown in purple; nuclear staining via DAPI (blue). Smaller panels represent magnified area as shown in larger panels. White arrows indicate cells of interest, red and green arrows indicate single positive cells. Neg control: staining performed in the absence of primary antibodies. Scale bars=20 µm.
- FIGURE 8
Idiopathic pulmonary arterial hypertension (IPAH) patients do not possess elevated plasmacytoid dendritic cell (pDC) numbers in the peripheral blood. a) Gating strategy for the flow cytometric quantification of circulating pDCs (CD14−CD11c−CD123+CD304+HLR-DR+) and basophils (CD14−CD11c−CD123+CD304−FceRi+) in peripheral blood. b) Scatterplot and boxplot overlays of quantified total CD11c−CD123+ cells, pDCs and basophils. Boxplots show median and interquartile range.


Tables
- TABLE 1
Clinical characteristics of the donors and idiopathic pulmonary arterial hypertension (IPAH) patients
Donors IPAH patients Lung samples 15 16 Age years 41.7±13.2 34.1±10.6 Male/female 10/5 5/11 Height cm 175±9 170±8 Weight kg 73.6±9.9 61.2±13.3* mPAP mmHg 71.2±16.6 PVR dyn·sec·cm−5 1845±669 6MWD m 280±187 NYHA class III–IV NT-proBNP pg·mL−1 4412±2445 CRP mg·dL−1 1.2±2.4 PAH targeted therapy ERA 1 ERA+PDE5i 1 sGCs+PGI 1 PDE5i+PGI 4 ERA+PDE5i+PGI 7 PDE5i+PGI+CCB 1 Unknown 1 Data are presented as n or mean±sd. mPAP: mean pulmonary arterial pressure; PVR: pulmonary vascular resistance; 6MWD: 6-min walking distance; NYHA: New York Heart Association; NT-proBNP: N-terminal pro-brain natriuretic peptide; CRP: C-reactive protein; ERA: endothelin receptor antagonists; PDE5i: phosphodiesterase type 5 inhibitor; sGCs: soluble guanylate cyclase stimulator; PGI: prostacyclin analogue; CCB: calcium channel blocker. *: p≤0.05.
Supplementary Material
Please note: supplementary material is not edited by the Editorial Office, and is uploaded as it has been supplied by the author.
Supplementary material ERJ-01214-2017_Supplement
Figure S1. Pulmonary arterial isolation procedure. Pulmonary arteries(*) were identified under a stereomicroscope due to their close vicinity to airways(§). Arteries were exposed by gradual removal of lung tissue until ~1-2cm of artery was visible. The artery was then removed en-bloc including side branches and forwarded to cell isolation. Scale bar represents 1 cm. ERJ-01214-2017_Figure_S1
Figure S2. Lung morphology in donor and IPAH samples. Representative images of sections derived from explanted lung samples (n=4). Magnified areas containing pulmonary vessels are also shown. ERJ-01214-2017_Figure_S2
Figure S3. Correlation plots of cell populations measured in different flow cytometry panels. A) Total CD45+ cells, B) PMN: polymorphonuclear neutrophils, C) CD3+ T cells, D) Mac: macrophages, and E) Mast cells. P values and rho (r) estimates derived from Spearman's rank correlation are shown for each correlation. ERJ-01214-2017_Figure_S3
Figure S4. Correlation analysis of individual cell populations in matched lung samples. Analysed cell populations in the two separate pieces of lung were compared by Spearman's rank correlation. P values and rho (r) estimates derived from Spearman's rank correlation are shown. ERJ-01214-2017_Figure_S4
Figure S5. Abundance of cell populations excluded from global principal component analysis. Scatterplot and boxplot overlays of cell populations in IPAH and donor lungs as analysed by flow cytometry. NK, natural killer cells; NKT, natural killer T cells. Boxplots show median and interquartile range. ERJ-01214-2017_Figure_S5
Figure S6. Patient-to-patient variability in CD45+ cell populations. Heatmap representation presenting the patient-to-patient variability of the log odds ratio derived from the percentage CD45+ data for 18 individual cell populations. Blue colours indicate highest abundance, red lowest for a single cell type. PMN, polymorphonuclear neutrophils; Macs, Macrophages; Monos, monocytes; DC, dendritic cells; pDC, plasmacytoid DC; gd gamma delta. ERJ-01214-2017_Figure_S6
Figure S7. Euclidean clustering of individual IPAH and donor samples. Heatmap representation using Euclidean clustering of the log odds ratio derived from number of cells per mg tissue data for the 21 individual cell populations. Blue colours indicate highest abundance, red lowest for a single cell type. Monos, monocytes; DC dendritic cells, Macs, Macrophages; CTL, cytotoxic T cell; gd gamma delta; PMN, polymorphonuclear neutrophils. ERJ-01214-2017_Figure_S7
Figure S8. Abundance of remaining cell population in lung samples. Abundance of cell populations not included in Fig. 4 as determine by flow cytometric analysis of IPAH and donor lungs. DC, dendritic cells; PMN, polymorphonuclear neutrophils. Boxplots show median and interquartile range, statistical significance between groups was determined by the Wilcoxon rank sum test. ERJ-01214-2017_Figure_S8
Figure S9. Relative proportions of CD45+ cells in lung samples. The relative proportions of multiple cell populations in IPAH and donor lungs. DC, dendritic cells; pDC; plasmacytoid dendritic cells; PMN, polymorphonuclear neutrophils. Boxplots show median and interquartile range, statistical significance between groups was determined by the Wilcoxon rank sum test. ERJ-01214-2017_Figure_S9
Figure S10. Abundance of cell population in isolated pulmonary arteries. Remaining cell populations not included in Fig. 5 as measured by flow cytometric analysis in IPAH and donor samples. DC, dendritic cells; PMN, polymorphonuclear neutrophils. Boxplots show median and interquartile range, statistical significance between groups was determined by the Wilcoxon rank sum test. ERJ-01214-2017_Figure_S10
Supplementary Material
V. Foris ERJ-01214-2017_Foris
G. Kwapiszewska ERJ-01214-2017_Kwapiszewska
A. Olschewski ERJ-01214-2017_Olschewski_A
H. Olschewski ERJ-01214-2017_Olschewski_H


