


Linking clinical phenotypes of chronic lung allograft dysfunction to changes in lung structure
- Stijn E. Verleden1⇑,
- Dragoş M. Vasilescu2,
- John E. McDonough1,2,
- David Ruttens1,
- Robin Vos1,
- Elly Vandermeulen1,
- Hannelore Bellon1,
- Rachel Geenens1,
- Erik K. Verbeken1,
- Johny Verschakelen1,
- Dirk E. Van Raemdonck1,
- Wim A. Wuyts1,
- Youri Sokolow3,
- Christiane Knoop3,
- Joel D. Cooper4,
- James C. Hogg2,
- Geert M. Verleden1 and
- Bart M. Vanaudenaerde1
- 1Department of Clinical and Experimental Medicine, Laboratory of Pulmonology, Lung Transplant Unit, KU Leuven - University of Leuven, Leuven, Belgium
- 2Center for Heart Lung Innovation and Department of Pathology and Laboratory Medicine, University of British Columbia, Vancouver, BC, Canada
- 3Unite de Transplantation Cardiaque et Pulmonaire, Université Libre de Bruxelles, Brussels, Belgium
- 4Department of Thoracic Surgery, University of Pennsylvania, Philadelphia, PA, USA
- Stijn E Verleden, K U Leuven, Lung Transplantation Unit, Herestraat 49, B-3000 Leuven, Belgium. E-mail: stijn.verleden{at}med.kuleuven.be
Abstract
Chronic lung allograft dysfunction (CLAD) remains the major barrier to long-term success after lung transplantation. This report compares gross and microscopic features of lungs removed from patients receiving a redo-transplant as treatment for CLAD.
Lungs donated by patients with either the bronchiolitis obliterans syndrome (BOS) or restrictive allograft syndrome (RAS) phenotype of CLAD and appropriate control lungs (eight per group) were air-inflated, frozen solid and kept frozen while a multi-detector computed tomography (MDCT) was obtained. The lung was then cut into 2-cm thick transverse slices and sampled for micro-CT and histopathology.
The MDCT showed reduced lung volume with increased lung weight and density in RAS versus BOS and control (p<0.05). Although pre-terminal bronchioles were obstructed in both phenotypes, RAS lungs showed a reduction of pre-terminal bronchioles (p<0.01). Micro-CT and matched histopathology showed that RAS was associated with reduced numbers of terminal bronchioles/lung compared to BOS and controls (p<0.01), with expansion of the interstitial compartment and obliteration of the alveolar airspaces by fibrous connective tissue.
RAS is associated with greater destruction of both pre-terminal and terminal bronchioles. Additionally, the interstitial compartments are expanded and alveolar airspaces are obliterated by accumulation of fibrous connective tissue.
Abstract
Restrictive allograft syndrome is associated with greater destruction of both pre-terminal and terminal bronchioles http://ow.ly/OlurI
Introduction
Chronic lung allograft dysfunction (CLAD) develops in approximately 50% of patients within 5 years after receiving a lung transplant [1]. The two major clinical phenotypes of CLAD recognised to date include the bronchiolitis obliterans syndrome (BOS) form, and the much more recently described restrictive allograft syndrome (RAS) form [2] which is also referred to as restrictive CLAD (rCLAD) [3]. The diagnosis of BOS is made by careful exclusion of other known and potentially reversible causes of reduced lung function following transplant [4]. In contrast, RAS is defined by the presence of a mixed restrictive and obstructive pattern of lung physiology, histopathological evidence of pleuroparenchymal fibro-elastosis as well as radiological evidence of interstitial fibrosis. Roughly speaking, approximately 70% of post-transplant patients affected by CLAD have BOS and 30% have the RAS clinical phenotype of CLAD [2, 3, 5, 6]. Compared with the much better known BOS clinical phenotype, patients with RAS experience a worse prognosis (3.5 versus 1.5 years); the reasons for this difference in prognosis are poorly understood [7]. Patients affected by RAS appear to progress in a more stepwise pattern [8], that might be driven by intermittent up-regulation of pro-inflammatory mediators [9, 10] during episodes of diffuse alveolar damage [11, 12] similar to those observed in patients with idiopathic pulmonary fibrosis (IPF).
An earlier report from our laboratories analysed explanted lungs of patients with the BOS clinical phenotype of CLAD [13] and showed no difference in the total number of visible airways and terminal bronchioles between BOS and control lungs. However, a reduction in the lumens of the smaller bronchi and pre-terminal bronchioles by a constrictive process could be observed.
The purpose of this report is to compare the previous reported findings on BOS with a new set of data collected from patients with RAS that received a second transplant.
Material and methods
Consent
Consent was provided by patients receiving a second lung transplant for end-stage CLAD under conditions approved by the University Hospital ethical and University biosafety committees (ML6385, P2011/243) at Gasthuisberg, Leuven, Belgium, and University Hospital Erasmus, Brussels, Belgium, and was accepted by all the other participating institutions. Material transfer agreements insured that the movement of information and specimens between institutions was compliant with the US Health insurance portability and accountability act. A part of the specimens analysed in this study were already reported previously [7].
Patient demographics
The clinical phenotypes were separated by assessing pulmonary function, radiology and confirmed with explant pathology. While all patients showed a decrease in forced expiratory volume in 1 s (FEV1), RAS patients showed per definition a decrease in total lung capacity of at least 10% compared to baseline, while the last available multi-detector computed tomography (MDCT) scan demonstrated interstitial fibrosis and (sub)pleural thickening as well as histopathology of the contra lateral lung showing alveolar fibrosis. All patients (BOS and RAS) were treated with azithromycin. Pre-operative MDCT scans were scored by a radiologist (air trapping, bronchial dilatation, centrilobular nodules, airway wall thickening, consolidation, ground glass opacities, pleural thickening, reticular pattern and volume loss) with expertise in lung transplantation (J. Verschakelen) using the Fleischner Society guidelines [14]. Table 1 contains the demographic information concerning the patients and donors that participated in this study while additional donor and recipient information is shown in supplemental table S1.
Patient characteristics
Specimen processing
The protocol for processing and sampling the lung specimens has been described in detail elsewhere [13, 15]. Briefly, each lung was inflated with air to a transpulmonary pressure of 30 cmH2O, and then deflated to 10 cmH2O and held in that position while they were frozen solid in liquid nitrogen vapour and stored at −80°C. When convenient, an MDCT scan of the frozen specimen was obtained using a Siemens Somatom definition flash (120 kV, 110 mAs, reconstructed at 0.6 mm in plane resolution, and a slice thickness of 1 mm, kernel B60 sharp). This MDCT scan was used to calculate lung mass, volume and density as previously described [13]. The airway branches were counted starting from the main stem bronchus (generation 1), and reported as the number of airway bifurcations per generation. The airway diameters were measured manually just before the bifurcation using OsiriX 4.1 software (OsiriX Foundation, California, USA). Airway occlusion was defined as either progressive narrowing of the airway lumen until it is no longer discernable or compression of the airway lumen by expansion of the fibrotic connective tissue in the bronchovascular interstitial space shown in supplemental figure S1.
Micro-CT imaging and histology
The lungs were kept at −80°C following the MDCT scan and remained frozen on dry ice while cut into 2-cm thick slices from lung apex to base in the transverse plane. Cores of 1.4 cm in diameter were obtained from each of these lung slices using either a sharpened steel cylinder (i.e. a cork borer) or a power-driven hole saw and stored at −80°C (figure 1). The exact position of each core was recorded by photographing each slice before and after the sampling procedure. The frozen tissue cores were stored at −80°C and at least one core of tissue from each lung slice (between eight and 13 cores per lung) was fixed in a 1% solution of glutaraldehyde in pure acetone pre-cooled to −80°C (freezing point −93°C), kept at −20°C overnight and then warmed to room temperature. The fixed specimen was then dehydrated in a graded series of alcohols ranging from 30%, 70%, 80%, 90% and then 100% overnight and chemical point-dried using hexamethyldisilazane [16]. Micro-CT was used to scan the cores at a resolution of 8.39 µm (40 Kv, 250 mA, Skyscan 1172; Brüker, Kontich, Belgium). The total numbers of terminal bronchioles, their cross-sectional areas and diameters were determined using OsiriX software (Osirix Foundation). Terminal bronchioles were identified on micro-CT images as the last purely conducting airway without alveolar openings in their walls and their diameter was measured manually at its narrowest point. The mean linear intercept and volume fraction of tissue taken up by fibrous connective tissue was determined from micro-CT images using a custom-made and validated macro in ImagePro Plus (Media Cybernetics, Rockville, MD, USA) [15]. These measurements were obtained at regularly spaced intervals approximately 840 µm apart and yielded between 14 and 19 images per core. A histological analysis conducted to directly compare the histology of specific airway lesions to their micro-CT images was performed by rehydrating tissue cores previously examined by micro-CT in 4% paraformaldehyde for 3 days, followed by a graded series of ethanol washes and paraffin embedding. Histological sections cut from these paraffin blocks were stained with either haematoxylin and eosin or picrosirius red and compared with the matched micro-CT images of the same tissue.

Representative images of the two phenotypes (bronchiolitis obliterans syndrome (BOS) (a–c) and restrictive allograft syndrome (RAS) (d–f)): a and d) photographs of a frozen slice of the two phenotypes; and b and e) the corresponding computed tomography (CT) images. c and f) representative samples scanned using micro-CT. Overall, the parenchyma in BOS lungs looks normal, while severe pleural thickening (arrows) and fibrosis are seen in the RAS lung. Scale bars = 1 cm.
Statistics
Results are expressed as either the median and interquartile range (IQR) or mean±sd. The number of terminal bronchioles, their lumen cross-sectional area and their diameter, as well as mean linear intercept and tissue percentage were averaged over the entire lung. Differences between BOS, RAS and controls were tested with Kruskall–Wallis ANOVA and Dunn's post hoc test. The number of airways per generation was compared using 2-way ANOVA with Tukey's post hoc test. Mann–Whitney test was used to compare between BOS and RAS (Graphpad Prism 4.0, Graphpad, CA, USA). A p-value <0.05 was considered significant.
Results
Patient characteristics
The demographic data in table 1 shows that the donor lungs were heavier (p=0.0025) than the patients that received a second transplant for either RAS or BOS, but there were no differences in either age, height or sex between these three groups (p>0.05). Table 1 also shows that the FEV1 of both patients receiving a second transplant for RAS or BOS was reduced to 19% of the predicted value. In addition, RAS showed a higher FEV1/forced vital capacity ratio (p=0.0002) and lower %predicted TLC (p=0.0022) consistent with restrictive lung disease. Somewhat surprisingly the diffusing capacity of the lung for carbon monoxide % predicted was lower in BOS than in RAS (p=0.029). There was no difference in the time between the last pre-operative thoracic MDCT scan and the re-transplantation procedure (table 1). The analysis of the pre-operative scans showed that patients with RAS differed from the BOS clinical phenotype with respect to airway wall thickening (p=0.028), airspace consolidation (p=0.021), pleural thickening (p=0.0003), a reticular infiltrative pattern (p=0.0019) and volume loss (p=0.0006).
Lung specimen MDCT scans
Table 2 shows that the lungs from patients with RAS had reduced total lung volumes compared with controls (p<0.001) and increased lung density compared with both BOS (p<0.01) and control subjects (p<0.001). The median (IQR) of the total number of visible airways in RAS (199 (162–222)) was reduced compared to either BOS (336 (308–361)) or control (329 (295–390)) lungs (p=0.006). This indicates an approximate 40% reduction in visible airways on the MDCT scans of the intact lung specimens from patients with RAS compared with BOS and controls. Figure 2a shows that this was mainly due to a reduction from generation 6 to 11 in RAS compared to BOS and from generation 6 to 10 versus control. Figure 2b shows that the percentage of visible airways narrowed by constrictive bronchiolitis was slightly greater in RAS than in BOS between generations 3–6 and then became substantially greater in BOS than in RAS from generation 7 to 14. Furthermore, when the number of airways with a narrowed lumen (fig. 2b) was subtracted from the total number of visible airways (fig. 2a), the result (fig. 2c) showed a substantial reduction in the total numbers of airways with a normal lumen in RAS compared with BOS in generation 6 (p<0.01), 7 (p<0.001) and 8 (p<0.0001) respectively. Interestingly, the mean±sd diameter just before the lumen started to narrow was not different in BOS (1.20±0.70 mm; n=565) compared to RAS (1.12±0.52 mm; n=393) (p>0.05).
Analysis of the multi-detector computed tomography (CT) specimen scans

a) Results of multi-detector computed tomography (MDCT) counting of the airways which shows that the number of airways per generation is decreased in restrictive allograft syndrome (RAS) lungs compared with bronchiolitis obliterans syndrome (BOS) (from generation 6–11) and control lungs (from generation 6–10). b) In BOS lungs, the obstruction increases gradually and reaches 50–60% of the airways between generation 9 and 13, while in RAS lungs this stabilises around 35% of obstruction between generation 6 and 12. There were no obstructions seen in the control lungs. c) The number of functional airways per generation which is the result of subtracting the number of obstructed airways from the number of visible airways, is lower in the RAS and BOS versus control lungs. d) The percentage of tissue as calculated from micro-computed tomography cores shown from slice 1 to 10 (1 being the apex and 10 being the base). A higher percentage of tissue is observed in all slice positions in the RAS but especially in the upper lobes (slice 1 and 2). RAS lungs have a lower lung volume which explains why only nine slices are shown. Data are presented as mean±sd. #: p<0.05 versus BOS; ###: p<0.001 versus BOS; ¶: p<0.05 versus donor control; ¶¶: p<0.01 versus donor control; ¶¶¶: p<0.001 versus donor control. Comparisons were calculated using 2-way ANOVA with Tukey's post hoc test.
Micro-CT analysis
A total of 77 control samples were compared with 74 BOS samples and 65 RAS samples. This confirmed that the median value and interquartile range of the terminal bronchioles per mL of lung tissue was reduced (p=0.0004) in lungs from patients affected by RAS 2.5 (2.3–2.9) compared with control, 5.7 (5.6–6.4) and BOS 5.4 (4.5–6.8). Similarly, the total number of terminal bronchioles per lung was reduced in RAS (3071 (2618–3582)) compared with BOS (11 165 (10 291–16 559)) and control (15 864 (11 941–20 132)) lungs (p<0.01 and p<0.001, respectively). Moreover, the total cross-sectional area of terminal bronchioles was also decreased in RAS (381(335–408) mm²) compared with BOS (1957 (1691–2857) mm²) and controls (2521 (1815–3189) mm² respectively; both p<0.01). Interestingly, there was no detectable difference in the number of terminal bronchioles per mL lung between the upper and lower lobes of the lungs in any of these three groups of patients.
Micro-CT comparison to histology
Figure 3 and supplemental movie 1 shows evidence derived from micro-CT images that there is narrowing of the lumen of a small airway (figure 3a–d), which was confirmed on histological sections of the same airway (figure 3e–h). The picrosirius red staining of histology sections cut from this airway (figure 3i), in conjunction with the polarised light image used to identify the fibrillar collagen (figure 3j), clearly shows that the lumen is narrowed by a constrictive process. Supplemental figure 1 illustrates serial micro-CT and haematoxylin and eosin images of a typical constrictive bronchiolitis lesion in a RAS lung where the lumen is completely obliterated with scar tissue, which later on disappears in a zone of dense fibrosis. In addition, the 3D reconstruction of the micro-CT images of airways in a larger, 3 cm in diameter, tissue core, demonstrates similar constrictions (highlighted in red) of the airway lumen in multiple small airways over several generations of branching (supplemental movie 3).
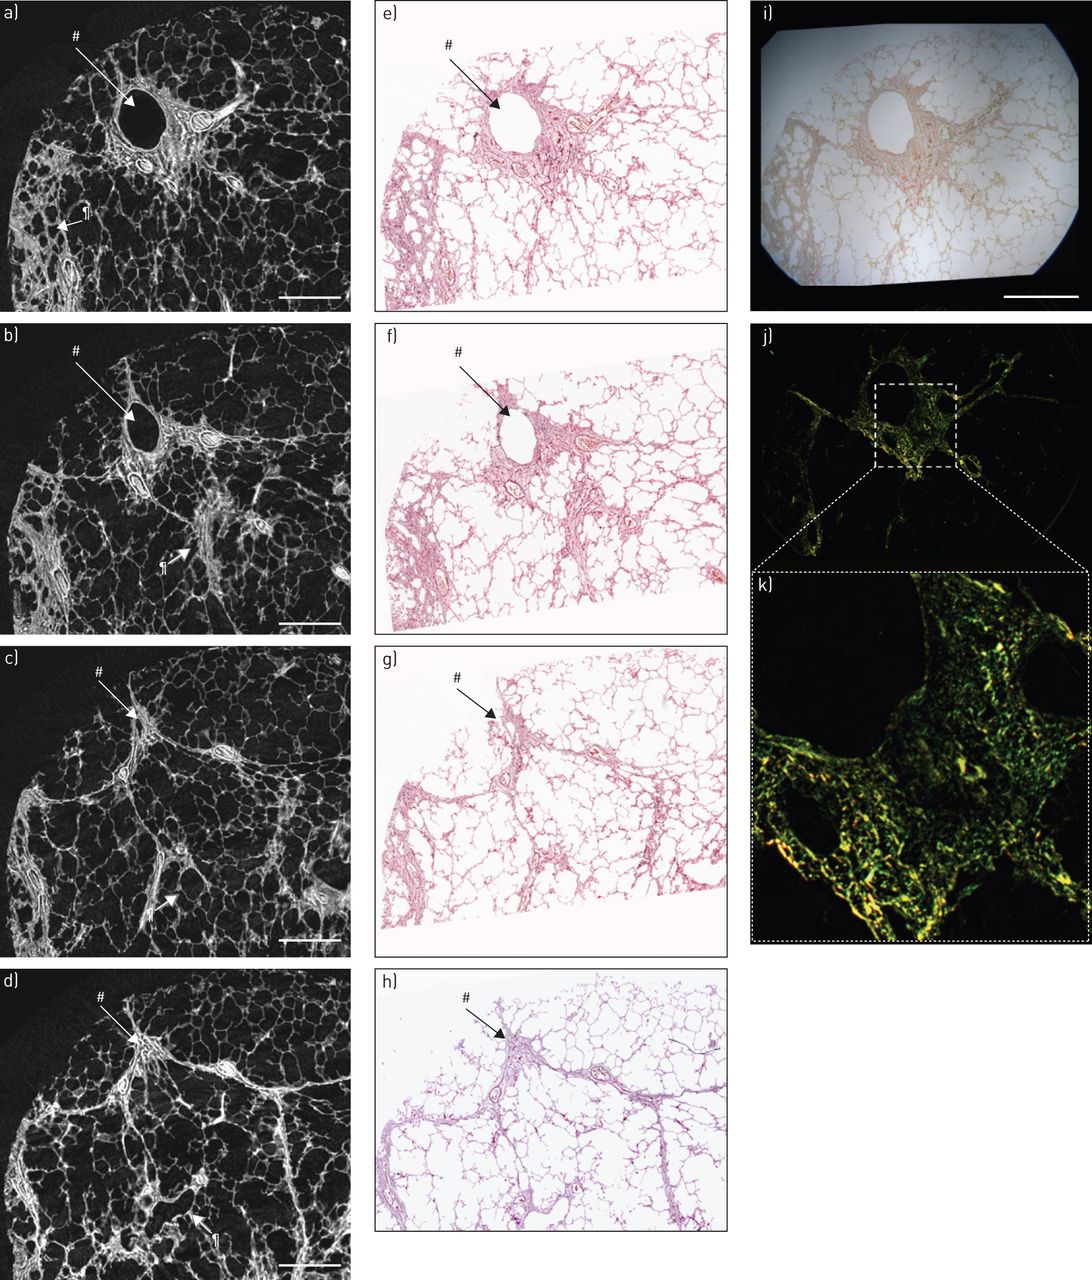
Serial micro-computed tomography (micro-CT) and histopathology images of representative airway lesions within restrictive allograft syndrome (RAS) lungs. The micro-CT images are shown in a–d, while the corresponding haematoxylin and eosin stained sections are shown in e–h. The open airway (#) in a, progressively narrows (b–c), until the lumen is completely closed (d). The corresponding haematoxylin and eosin stained sections further confirm the micro-CT images. Additionally, there is a fibrotic terminal bronchiole (¶). i) Picrosirius staining of a section where the airway can be seen centrally and j) the result of polarising this, demonstrating that there is clear fibrosis surrounding the airway. k) Higher magnification confirming the presence of collagen around the airway. Scale bars = 2 mm.
Next to these airway alterations, remodelling of the parenchyma was also present in large proportions of the studied cores. Figure 4 provides an overview of the changes in the interstitial and alveolar airspaces observed during the analysis of the micro-CT scans of samples removed from lungs of patients with RAS (figure 4a–f). Normal appearing lung tissue is in close proximity to areas where the inerlobular septa (figure 4a and b) and bronchovascular bundles (figure 4c) are expanded by fibrous connective tissue. Furthermore, it also shows areas where the alveolar airspaces contain small amounts of fibrous connective tissue (see arrows in figure 4e) and other areas where the airspaces are progressively consolidated (figure 4d and f) by fibrous connective tissue that appears to trap islands of normal appearing alveolar tissue and distort airways and blood vessels. In contrast, none of these changes were observed in either the control lung (figure 4g) or the lungs from patients affected by BOS (figure 4h). Furthermore, the mean linear intercept remained unchanged (p=0.61), while median (IQR) of the total volume of lung taken up by tissue increased from 23.5% (22.9–24.4%) in controls and 27.8% (23.3–29.2%) in lungs from patients affected by BOS to 42.8% (36.4–54.5%) in lungs from patients affected by RAS (p<0.001 and p<0.05, respectively).
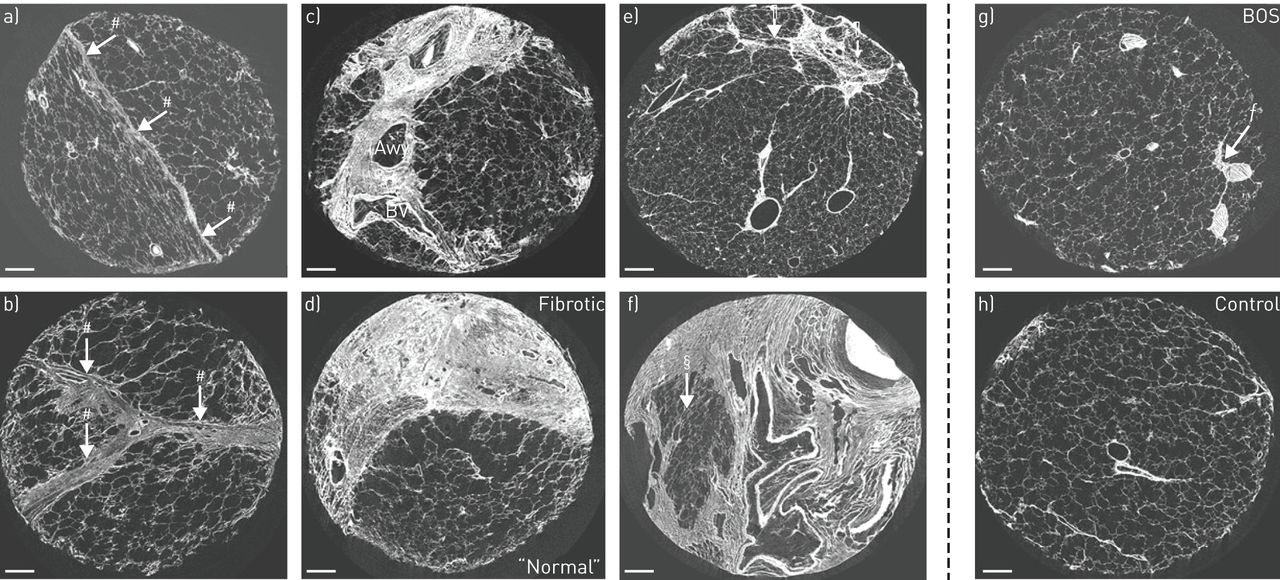
Spectrum of abnormalities in restrictive allograft syndrome (RAS) lungs (a–f), ranging from mild to severe impairment. a) Beginning alterations in RAS lungs where the parenchyma on one side is distorted, while the other side is not, separated with a thickened septum (#); b) Severe septal thickening (#); c) fibrosis around the airway (Awy) and blood vessel (BV); d) severe parenchymal fibrosis with a sharp demarcation to normal parenchyma; e) Beginning parenchymal fibrosis (¶); f) severe parenchymal fibrosis where one patchy zone of normal parenchyma can be observed (§); g) normal appearing parenchyma which is characteristic for bronchiolitis obliterans syndrome (BOS) lungs, showing an obstructed airway next to a blood vessel (ƒ); and h) normal parenchyma of a control lung. Scale bars = 1 mm.
Discussion
This report provides new information that clearly shows remarkable differences in lung function and structure in the BOS and RAS clinical phenotypes of CLAD [17]. Collectively, our data show that there is an extensive reduction and narrowing of the visible pre-terminal bronchioles located between generation 6 and 11 of airway branching in RAS, which seems to be more prevalent than in the BOS clinical phenotype. Micro-CT demonstrated a marked reduction in terminal bronchioles in RAS compared with BOS and control.
It is not unexpected that the lung density as measured with MDCT is increased in RAS compared with BOS and control as this probably reflects scar tissue accumulation as shown in figure 3. This additional scar tissue was mainly situated in the upper lobes (as seen in figure 1d). The reason is unknown, however in idiopathic pleuroparenchymal fibroelastosis, which seems to be similar to RAS and where mainly apical fibrosis is also seen, venous and arterial fibrosis was seen in the majority of patients [5, 18]. This might indicate hypoperfusion and ischaemia of these areas, although the mechanism of this is unknown. The exact origin of the accumulated scar tissue is also unknown at the moment, mostly because alveolar fibrosis was not associated with CLAD previously. The improved understanding of the cellular and molecular determinants of IPF that have been gained in recent years and is reviewed in detail elsewhere [19], could provide insight into pathogenesis of the interstitial lesions that occur during RAS. For example, the observation that the terminal bronchioles are extensively destroyed in RAS is relevant to earlier suggestions that IPF begins with disease in the smaller conducting airways [20].
Our results confirm some of the pathological findings described by Ofek et al. [5], such as the presence of obliterative bronchiolitis lesions, the large degree of (sub)pleural thickening and the sharp demarcations between healthy and diseased parts of the lung (figure 4a, d and f) [5]. These findings suggest that the disease process might be acute and progresses very fast, since the “healthy” remaining parts of the lung do not have the time necessary to compensate for this increased tissue fibrosis. The fact that obliterative bronchiolitis lesions were also found in all RAS lungs (also confirmed by [5]) suggests that at least part of the mechanism of airway remodelling between RAS and BOS overlaps. Interestingly, patients that first developed BOS and later progressed to RAS seem to have more airway obstruction compared to those patients that immediately developed RAS (median (IQR) 42.1% (20.1–63.8%) of airways obstructed versus 18.4% (9.9–37.6%), respectively).
The maximum resolution of MDCT scans performed of the inflated frozen lung specimens was 0.8–1 mm. Therefore, it is impossible to determine if these airways have really been destroyed in RAS or only narrowed to a point where they are no longer visible on the MDCT scan. However, this limitation is the same for all lungs and we still observe a marked reduction in the total number of functional airways in both BOS and RAS compared with control. In BOS, this was solely due to airway obliteration, while in RAS this was a combination of either narrowing/obliteration or overgrowth of airways with interstitial fibrosis causing narrowing of the airway diameter such that the airway is below the threshold to be visible on MDCT. In contrast, the 16-µm resolution provided by micro-CT makes it possible to identify and count the number of the much smaller terminal bronchioles per mL. This analysis showed that an aggressive remodelling process spreads into and destroys the terminal bronchioles in lungs from patients with RAS but not in BOS. Based on our findings, we propose that the terminal and pre-terminal bronchioles are destroyed by the expansion of fibrous connective tissue and the formation of scar tissue within the interstitial compartments of the lung that contracts to destroy the surrounded airways. Moreover, we postulate that a similar process is responsible for the narrowing and destruction of the slightly larger airways located between generation 5 and 15 of airway branching that is observed on the specimen MDCT scans of patients with both RAS and BOS. Furthermore, the direct comparison of micro-CT to histology (figure 3) shows that as the airway narrows and the lumen disappears, fibrous connective tissue surrounding the airway contracts to form thin fibrous strands resembling distorted lobular septae. The absence of proliferating collagen within the lumen of the bronchiole (figure 3) suggests that this narrowing and destruction is caused by contraction of scar tissue that forms within the interstitial compartment of the lung, rather than by filling the lumen with the fibrous connective tissue expected in organising pneumonia. Although typical filing of the airway lumen (constrictive bronchiolitis) could also be observed in some of the airways in RAS (online supplement figure 1).
Whether the pathological process associated with RAS is simply a more aggressive form of the process associated with the BOS. Or alternatively that these two quite different clinical phenotypes are fundamentally different pathological processes remains to be proven. Further research is needed to unravel these mechanisms in studies that focus on the cellular and molecular events associated with these structural changes with a special focus on the observed airway lesions, which will hopefully lead to more adequate treatment.
Acknowledgements
The authors thank Mark Elliott (University of British Columbia, Vancouver, BC, Canada) for excellent technical assistance.
Footnotes
Editorial comment in: Eur Respir J 2015; 46: 1242–1246 [DOI: 10.1183/13993003.01526-2015]
Support statement: Stijn E. Verleden is post-doctoral fellow of the Research Foundation Flanders (12G8715N) and is supported by a research award of the International Society for Heart and Lung transplantation. Robin Vos is supported by Research Foundation Flanders (KAN2014 1.5.139.14) and Klinisch Onderzoeksfonds Leuven. Geert M. Verleden is supported by the Research Foundation Flanders (G.0723.10, G.0679.12). Bart M. Vanaudenaerde and Geert M. Verleden are supported by the KU Leuven (C24/15/030). During the course of this fellowship, Dragoş M. Vasilescu has been supported by the CIHR/impact and CTS postdoctoral fellowship.
This article has supplementary material available from erj.ersjournals.com
Conflict of interest: Disclosures can be found alongside the online version of this article at erj.ersjournals.com
- Received January 21, 2015.
- Accepted April 16, 2015.
- Copyright ©ERS 2015