


Figures
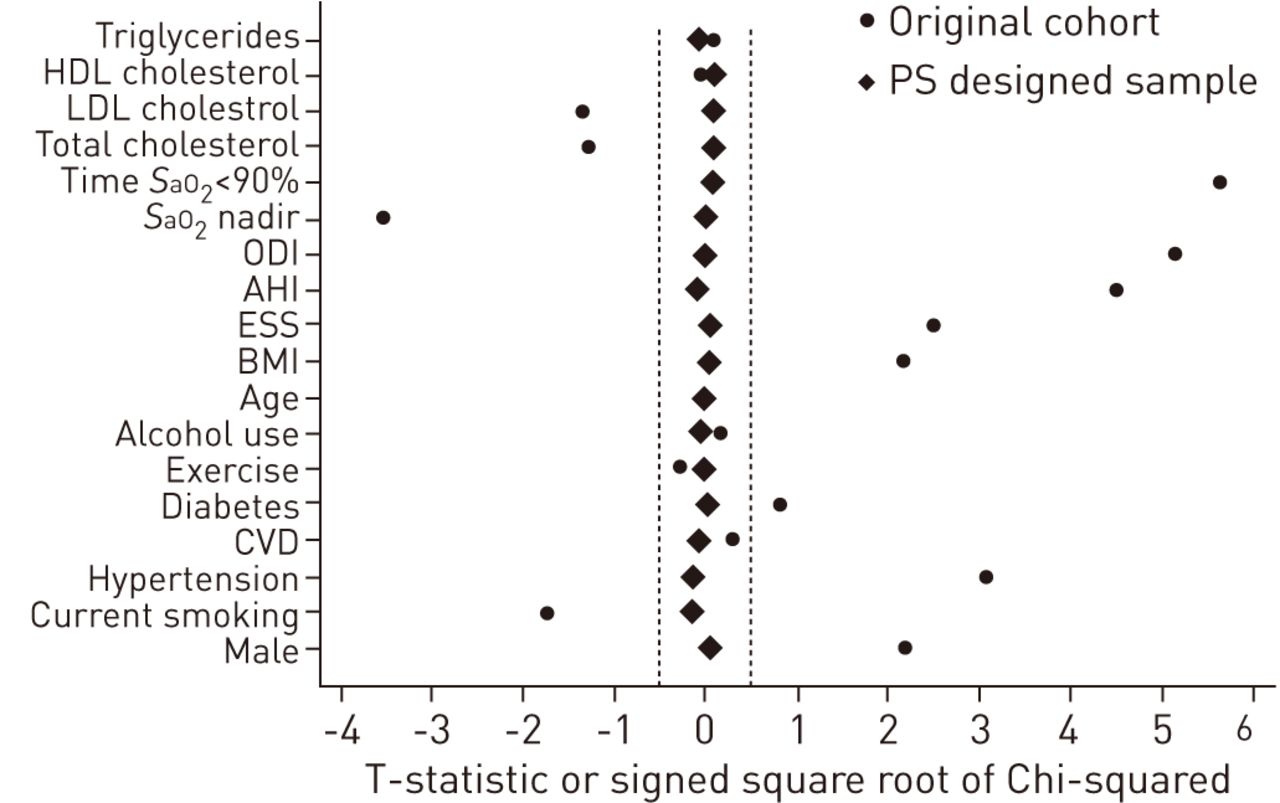
- Figure 1–
A modified version of a Love Plot [29] illustrating the balance in covariates between positive airway pressure adherent patients and non-users in the original cohort and after controlling for propensity score (PS) subclass within the designed cohort. The plot shows the T-statistic or signed square root of the Chi-squared comparing covariates between groups. While a number of covariates were significantly different prior to sub-classification, after controlling for PS subclass in the designed cohort all statistics are close to zero. HDL: high-density lipoprotein; LDL: low-density lipoprotein; SaO2: arterial oxygen saturation; ODI: oxygen desaturation index; AHI: apnoea/hypopnoea index; ESS: Epworth Sleepiness Scale; BMI: body mass index; CVD: cardiovascular disease. ·····: absolute value of statistic <0.5.
- Figure 2–
The 2-year fasting lipid changes are shown for positive airway pressure adherent patients and non-users, adjusted for propensity score subclass and baseline lipid level. There were statistically significant increases in total cholesterol (TC; p=0.003 in adherent patients and p=0.002 in non-users) and high-density lipoprotein cholesterol (HDL-C; p<0.0001 in both positive airway pressure groups) over 2 years, but there was no change in low-density lipoprotein cholesterol (LDL-C) or triglycerides (TG). There were no differences in 2-year fasting lipid changes between adherent patients and non-users. Data are presented as mean with 95% CI.

Tables
- Table 1– Baseline characteristics of the study population stratified by body mass index (BMI) group
Characteristic BMI <30 kg·m−2 BMI 30–35 kg·m−2 BMI ≥35 kg·m−2 p-value# Subjects n 186 210 217 Age years 54.4±9.6 53.8±10.8 50.5±10.8 <0.001 Male 82.3 81.0 78.3 0.597 BMI kg·m−2 27.4±2.0 32.4±1.4 39.9±4.1 <0.0001 Current smoker 24.3 20.5 22.7 0.654 Excessive alcohol 3.3 3.8 3.7 0.963 Hypertension 25.4 34.0 50.9 <0.0001 Cardiovascular disease 3.2 4.8 4.6 0.769 Diabetes mellitus 2.2 2.4 6.5 0.045 Participate in exercise 73.6 57.6 51.9 <0.0001 Epworth Sleepiness Scale 11.7±4.8 11.4±5.1 12.3±5.3 0.183 AHI events·h−1 37.4±15.2 44.7±20.4 49.0±23.2 <0.0001 ODI events·h−1 26.4±13.4 35.1±18.9 41.9±23.5 <0.0001 SaO2 nadir 79.0±6.6 76.9±7.5 73.2±8.9 <0.0001 Percentage of time SaO2<90% 6.1±9.1 12.4±16.1 19.7±22.3 <0.0001 Total cholesterol mg·dL−1 212.6±37.3 207.2±42.4 200.9±41.5 0.016 Total cholesterol ≥200¶ 65.6 57.6 52.5 0.029 LDL cholesterol mg·dL−1 156.1±35.2 152.1±38.2 145.4±36.9 0.012 LDL cholesterol ≥130¶ 76.3 71.9 65.0 0.040 HDL cholesterol mg·dL−1 43.6±14.3 39.6±9.2 38.2±9.4 <0.0001 HDL cholesterol <40¶ 48.4 57.1 67.3 0.001 Triglycerides mg·dL−1 147.1±63.2 177.9±81.6 198.9±103.2 <0.0001 Triglycerides ≥150¶ 43.0 59.5 68.7 <0.0001 Data are presented as mean±sd or %, unless otherwise stated. All differences were significant except for the following characteristics: sex, current smoker, excessive alcohol use, Epworth Sleepiness Scale score and cardiovascular disease. AHI: apnoea/hypopnoea index; ODI: oxygen desaturation index; SaO2: arterial oxygen saturation; LDL: low-density lipoprotein; HDL: high-density lipoprotein. #: from ANOVA and Chi-squared or Fisher’s exact test; ¶: based on the National Cholesterol Education Programme (Adult Treatment Panel III) published criteria [28].
- Table 2– Pearson correlations# between obesity and obstructive sleep apnoea severity measures and natural log transformed lipid measures
Total cholesterol LDL cholesterol HDL cholesterol Triglycerides rho p-value rho p-value rho p-value rho p-value BMI kg·m−2 -0.13 0.001 -0.14 0.001 -0.16 <0.001 0.28 <0.0001 Weight kg -0.16 <0.0001 -0.17 <0.0001 -0.16 <0.001 0.25 <0.0001 Neck circumference cm -0.13 0.002 -0.13 0.001 -0.20 <0.0001 0.34 <0.0001 Waist circumference cm -0.11 0.006 -0.13 0.001 -0.12 0.003 0.32 <0.0001 Waist-to-hip ratio -0.04 0.290 -0.05 0.177 -0.10 0.013 0.29 <0.0001 Total abdominal fat cm3 -0.02 0.657 -0.05 0.239 -0.07 0.118 0.29 <0.0001 Subcutaneous abdominal fat cm3 -0.03 0.502 -0.07 0.140 -0.04 0.402 0.22 <0.0001 Visceral abdominal fat cm3 0.00 0.937 -0.01 0.746 -0.11 0.016 0.33 <0.0001 AHI events·h−1 0.04 0.300 0.01 0.725 0.09 0.022 0.03 0.428 ODI events·h−1 -0.01 0.901 -0.02 0.559 0.02 0.606 0.06 0.157 SaO2 nadir 0.02 0.568 0.02 0.621 0.04 0.384 -0.01 0.804 Percentage of time at SaO2<90%¶ -0.02 0.571 -0.04 0.360 0.01 0.792 0.02 0.619 Significant correlations are shown in bold. LDL: low-density lipoprotein; HDL: high-density lipoprotein; BMI: body mass index; AHI: apnoea/hypopnoea index; ODI: oxygen desaturation index; SaO2: arterial oxygen saturation. #: correlations between obesity and lipids adjusted for age and sex; correlations for obstructive sleep apnoea severity adjusted for age, sex and BMI; ¶: natural log transformed for normality.
- Table 3– Baseline and follow-up characteristics of the positive airway pressure adherent patients and non-users within the propensity score designed sample
Characteristic Baseline Follow-up Adherent Non-user p-value# Adherent Non-user p-value¶ Subjects n 199 118 199 118 Age years 51.8±10.4 52.8±10.0 0.996 Male 81.9 80.5 0.967 BMI kg·m−2 33.9±5.9 33.1±5.9 0.975 34.9±6.1 32.9±5.4 <0.0001 Current smoker 20.6 20.3 0.897 18.7 28.0 0.004 Excessive alcohol 2.5 2.5 0.954 1.5 2.5 0.342 Hypertension 33.2 28.8 0.892 33.8 30.5 0.953 Cardiovascular disease 2.5 1.7 0.949 2.5 1.7 0.688 Diabetes mellitus 1.5 0.9 0.987 3.1 3.5 0.460 Participate in exercise 58.8 58.4 0.988 67.9 66.7 0.726 Epworth Sleepiness Scale 12.0±5.0 11.5±4.8 0.966 7.8±4.6 9.3±4.9 0.002 AHI events·h−1 44.8±19.6 40.8±19.8 0.931 ODI events·h−1 36.1±19.3 32.1±19.0 0.990 SaO2 nadir 76.2±7.5 77.5±7.3 0.993 Percentage of time at SaO2<90% 2.1±1.0 1.8±1.0 0.942 Total cholesterol mg·dL−1 204.7±41.6 204.9±35.4 0.917 211.4±41.6 213.3±36.0 0.528 Total cholesterol ≥200+ 56.3 55.1 0.727 64.3 63.6 0.771 LDL cholesterol mg·dL−1 149.4±37.3 149.7±33.8 0.933 149.5±30.9 151.3±33.3 0.475 LDL cholesterol ≥130+ 70.9 72.9 0.905 75.9 72.9 0.475 HDL cholesterol mg·dL−1 40.0±12.4 39.8±10.3 0.922 46.6±12.8 47.3±12.8 0.619 HDL cholesterol <40+ 60.8 57.6 0.978 30.6 34.8 0.144 Triglycerides mg·dL−1 174.8±86.1 176.0±102.9 0.998 174.6±88.9 167.9±96.1 0.517 Triglycerides ≥150+ 59.8 55.1 0.737 54.8 49.2 0.544 Data are presented as mean±sd or %, unless otherwise stated. Significant differences are shown in bold. BMI: body mass index; AHI: apnoea/hypopnoea index; ODI: oxygen desaturation index; SaO2: arterial oxygen saturation; LDL: low-density lipoprotein; HDL: high-density lipoprotein. #: adjusted for propensity score subclass from ANCOVA model or conditional logistic regression; ¶: from ANCOVA or conditional logistic examining the difference in follow-up values, adjusted for propensity score subclass and baseline value; +: based on the National Cholesterol Education Programme (Adult Treatment Panel III) published criteria [28].
- Table 4– Differences in 2-year fasting lipid changes between positive airway pressure adherent patients and non-users
Lipid BMI#,¶ kg·m−2 Adherent Non-users p-value+ Total cholesterol Overall 6.5±2.2§ 8.8±2.8§ 0.528 <30 2.4±4.0 9.7±4.4§ 0.248 30–35 15.1±3.4§ 10.9±4.9§ 0.493 ≥35 1.8±3.6 6.7±5.3 0.468 LDL cholesterol Overall -0.2±1.9 2.2±2.5 0.475 <30 -5.7±3.8 1.6±4.1 0.210 30–35 6.4±3.0§ 2.6±4.3 0.481 ≥35 -1.4±3.3 2.0±4.8 0.579 HDL cholesterol Overall 6.7±0.7§ 7.3±0.9§ 0.619 <30 6.7±1.2§ 7.3±1.3§ 0.750 30–35 7.6±1.0§ 8.2±1.5§ 0.735 ≥35 5.6±1.1§ 7.0±1.6§ 0.501 Triglycerides Overall -0.9±5.6 -7.1±7.4 0.517 <30 17.5±11.4 6.9±12.5 0.548 30–35 8.9±10.5 8.3±14.9 0.976 ≥35 -26.4±7.3§ -29.1±10.8§ 0.844 Data are presented as least square mean±se change, unless otherwise stated. BMI: body mass index; LDL: low-density lipoprotein; HDL: high-density lipoprotein. #: the propensity score sample included 199 adherent patients (BMI <30: n=56; BMI 30–35: n=65; BMI ≥35: n=78) and 118 non-users (BMI <30: n=47; BMI 30–35: n=33; BMI ≥35: n=38); ¶: p=0.557 for total cholesterol, p=0.500 for LDL, p=0.615 for HDL and p=0.563 for triglycerides; +: from ANCOVA comparing adherent patients and non-users within propensity score designed study, adjusted for propensity score subclass and baseline lipid level; §: within group estimate of lipid change significantly (p<0.05) different from zero.
Supplementary material
Please note: supplementary material is not edited by the Editorial Office, and is uploaded as it has been supplied by the author.
Files in this Data Supplement:
- Supplementary material -
Supplementary Methods
Supplementary Results
Supplementary References
Table E1: Characteristics of lipid-lowering medication users and non-users at baseline
Table E2: Descriptive characteristics of patients with and without MRI data
Table E3: Unadjusted Pearson correlations between obesity and OSA severity measures and natural log transformed lipid measures
Table E4: Covariate comparisons for patients included in and excluded from final propensity score designed cohort
Table E5: Differences in two-year lipid changes between PAP Adherent and non-users within the PS designed cohort
Table E6: Differences in two-year lipid changes between PAP Adherent and Non-users with Abnormal Lipid Levels at Baseline
Table E7: Differences in two-year lipid changes between PAP Adherent and Non-users with percent time SaO2<90 greater than the 75th percentile
Figure E1: Diagram illustrating the analysis sample
- Supplementary material -
Disclosures
Files in this Data Supplement:


