


Figures
- Figure 1–
Comparison of maximal stress generation. Stress in response to electric field stimulation, calculated as maximal trachealis muscle isometric force divided by muscle cross-sectional area (kPa), between nonasthmatics and asthmatics was compared. Error bars indicate sem. n=6 for nonasthmatics and n=8 for asthmatics.
- Figure 2–
Time course of length changes and the resulting active and passive force. Airway smooth muscle strips were either shortened or lengthened in the relaxed state to 0.50, 0.75, 1.25 or 1.50 at in situ length (Lref). The muscle was stimulated to contract five times with electric field stimulation (EFS) at 5-min intervals after every length change. Between shortening and lengthening steps, the muscle was returned to Lref and readapted. Grey hexagons indicate the time-points where EFS occurred (a). The b) active and c) passive forces were recorded at every contraction. Both were normalised to maximal trachealis muscle isometric force (Fmax). •: nonasthmatics; •: asthmatics. Error bars indicate sem; n=6 for each group.
- Figure 3–
Active length–force relationship before and after length adaptation. From in situ length (Lref), the airway smooth muscle strips were either shortened or lengthened to 0.50, 0.75, 1.25, and 1.50 Lref (refer to fig. 4 for sequence and time course of length changes and stimulation). Active force before (solid lines and closed symbols) and after (dashed lines and open symbols) length adaptation are shown. Fmax: maximal trachealis muscle isometric force. Error bars indicate sem, n=6 for each group. *: p<0.05, ***: p<0.01; compared with the nonasthmatic before length adaptation at the given length. ###: p<0.01; compared with the asthmatic before length adaptation at the given length. ¶: p<0.05; compared with the nonasthmatic after length adaptation at the given length.
- Figure 4–
Passive length–force relationship before and after length adaptation. From in situ length (Lref), the airway smooth muscle strips were either shortened or lengthened to 0.50, 0.75, 1.25 and 1.50 Lref. Passive force both before (solid lines and closed symbols) and after (dashed lines and open symbols) length adaptation are shown. Fmax: maximal trachealis muscle isometric force. Error bars indicate sem, n=6 for each group. *: p<0.05, passive force was greater in asthmatics compared with the nonasthmatic before length adaptation at 1.50 Lref. #: p<0.05; passive force was less following adaptation in the asthmatic tissue compared with before adaptation at 1.50 Lref.
- Figure 5–
a) Averaged isotonic shortening velocities to various loads, early phase release. Hill's hyperbolic equation was fitted to the data from each subject and the solid lines represent the average of these curves. b) Averaged isotonic shortening velocities to various loads, late phase release. Hill's hyperbolic equation was fitted to the data from each subject and the solid lines represent the average of these curves. The dashed lines indicate sem. Lref: in situ length; Fmax: maximal trachealis muscle isometric force.
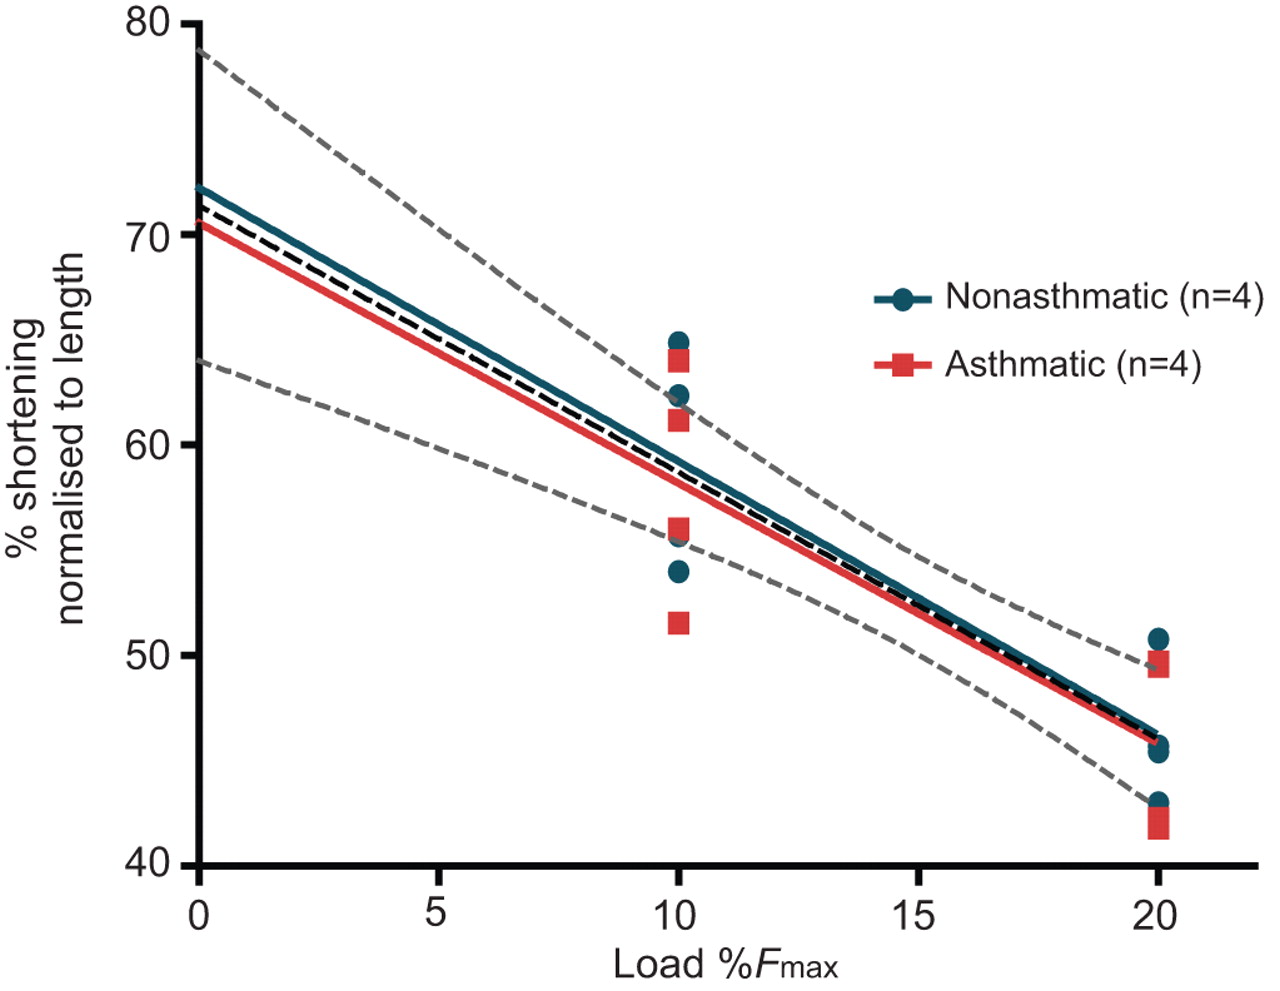
- Figure 6–
Maximal isotonic shortening. Airway smooth muscle strips were stimulated to contract with electric field stimulation and the total amount of isotonic shortening against small loads was measured. Using the amount of shortening recorded at loads representing 10% and 20% of maximal trachealis muscle isometric force (Fmax), maximal shortening was extrapolated. Shortening was recorded at both loads per donor. n=4 for each group. A combined (both groups) linear regression is represented as a dashed central line. The upper and lower dashed lines represents the 95% confidence interval for all data points.
- Figure 7–
Response to mechanical perturbation by plotting the recovery of isometric force following a 10-min, 0.2 Hz, 30% in situ length (Lref) oscillation (grey shading). Airway smooth muscle strips were adapted to Lref prior to oscillation. The force produced by seven electric field stimulation-induced contractions was recorded at 5-min intervals following the oscillation. ANOVA: p<0.01. Error bars indicate sem, n=6 per group. In addition to the difference in the initial decline in force, the asthmatics demonstrated slower force recovery but recovered beyond maximal trachealis muscle isometric force (Fmax) after 30-min (1.05±0.03 Fmax). Nonlinear regression analysis of the nonasthmatic and asthmatic data demonstrated these differences in recovery rate. The regressions were fitted using a one-phase exponential equation. For the nonasthmatics: force=0.947-0.296e-0.139t (r2=0.73); for asthmatics: force =1.053-0.243e-0.073t (r2=0.48), where force was relative to Fmax and t was time in minutes.


Tables
- Table 2– Airway characteristics
Asthmatic Nonasthmatic p-value Airways n 10.8±5.7 8.1±3.2 0.28 Average Pbm 3691±1713 3813±1445 0.37 Pbm median (range) 2479 (1373–7850) 2886 (1286–8072) 0.47 Smooth muscle area/Pbm 0.0693 (0.0638–0.0749) 0.0511 (0.0451–0.0572) <0.001 Epithelial area/Pbm 0.1026 (0.0907–0.1144) 0.0856 (0.0730–0.0981) 0.053 Lamina propria area/Pbm 0.1393 (0.1274–0.1511) 0.1167 (0.1041–0.1293) 0.013 Adventitial area/Pbm 0.2170 (0.1963–0.2377) 0.1804 (0.1584–0. 2025) 0.020 Total area/Pbm 0.4112 (0.3730–0.4494) 0.3455 (0.3048–0.3863 ) 0.024 Data are presented as mean±sd or median (95% confidence intervals), unless otherwise stated. Pbm: basement membrane perimeter (in μm). All areas are in mm2.
Supplementary material
Please note: supplementary material is not edited by the Editorial Office, and is uploaded as it has been supplied by the author.
Files in this Data Supplement:
- Supplementary material -
Methods
Results
- Supplementary material -


