


Abstract
Evidence on the cost and cost-effectiveness of treatment of multidrug-resistant tuberculosis (MDR-TB) is limited, and no published data are available from former Soviet Union countries, where rates of MDR-TB are highest globally.
We evaluated the cost and cost-effectiveness of MDR-TB treatment in Estonia and Russia (Tomsk Oblast), comparing cohorts enrolled on treatment according to World Health Organization (WHO) guidelines in 2001 and 2002 with cohorts treated in previous years. Costs were assessed from a health system perspective in 2003 US$; effects were measured as cures, deaths averted and disability-adjusted life-years (DALYs) averted.
Cure rates when WHO guidelines were followed were 61% (90 out of 149) in Estonia and 76% (76 out of 100) in Tomsk Oblast, with a cost per patient treated of US$8,974 and US$10,088, respectively. Before WHO guidelines were followed, cure rates were 52% in Estonia and 15% in Tomsk Oblast; the cost per patient treated was US$4,729 and US$2,282, respectively. Drugs and hospitalisation accounted for 69–90% of total costs. The cost per DALY averted by treatment following WHO guidelines was US$579 (range US$297–US$902) in Estonia and US$429 (range US$302–US$546) in Tomsk Oblast.
Treatment of patients with MDR-TB can be cost-effective, but requires substantial additional investment in tuberculosis control in priority countries.
The World Health Organization (WHO) estimates that ∼440,000 cases of multidrug-resistant tuberculosis (MDR-TB) develop each year [1]. Defined as resistance to at least the two most effective first-line antituberculosis drugs, rifampicin and isoniazid, cases of MDR-TB accounted for ∼5% of the ∼8.8 million new cases of tuberculosis that occurred in 2010 [1]. While India and China combined account for about half of the world’s estimated cases of MDR-TB, the highest rates occur in countries of the former Soviet Union (FSU): Armenia, Azerbaijan, Belarus, Estonia, Georgia, Kazakhstan, Kyrgyzstan, Latvia, Lithuania, Moldova, Russia, Tajikistan, Turkmenistan, Ukraine and Uzbekistan. In 2010, these countries had an estimated 66,000 cases of MDR-TB among reported tuberculosis patients (out of an estimated total of 290,000 cases among reported tuberculosis patients worldwide) and ranked first to 13th globally in terms of the percentage of tuberculosis cases with multidrug resistance, with figures of 9.4–26% among new cases and 24–65% among previously treated cases [1]. In 2010, the same set of countries notified (i.e. reported) 33,000 cases of MDR-TB to WHO. In the three FSU countries with the largest populations (Russia, Ukraine and Kazakhstan), 14–18% of new tuberculosis cases and 44–46% of previously treated cases were estimated to have MDR-TB in 2010; 26,412 cases of MDR-TB were notified to WHO.
A 6-month course of first-line antituberculosis drugs can achieve cure rates of ∼90% in patients with drug-susceptible tuberculosis [1]. However, cure rates with the same regimen are much lower for patients with MDR-TB: 5–35% for previously treated cases and 12–60% for new cases [2], with a relapse rate of 24% [3]. Death and treatment failure rates for people with MDR-TB are correspondingly high. Treatment that includes second-line antituberculosis drugs can considerably improve cure rates [4–16], but takes longer, causes more side-effects, requires more complex regimens and has a much higher cost [17–20].
WHO and partner agencies have developed guidelines for the treatment of MDR-TB using first- and second-line drugs, most recently in 2011 [17–20]. Key elements include diagnosis based on culture and drug susceptibility testing (DST), treatment with second- as well as first-line drugs for at least 20 months, and standardised recording and reporting of treatment outcomes. Projects or programmes that have followed these guidelines in Estonia, Latvia, Peru, the Philippines and Russia have achieved cure rates of 60–75% [21].
Data on cost and cost-effectiveness are needed to assess whether investment in MDR-TB treatment is justified compared with competing health sector priorities as well as to develop appropriate budgets for implementation if treatment is scaled up. To date, published studies are limited to Peru and the Philippines [4, 22, 23]. In this article, we present data on the cost and cost-effectiveness of MDR-TB treatment according to WHO guidelines in Estonia and Russia (Tomsk Oblast) from two studies initiated in 2002 and completed in 2006.
METHODS
Setting
Russia had a population of 143 million in 2010 [1], a reduction from 146 million in 2001. The number of tuberculosis cases notified to WHO in 2010 was 163,000, with a relatively stable notification rate (per 100,000 population) during the decade 2001–2010 [1]. The estimated number of MDR-TB cases was 40,000 in 2010, third only to China and India [1]. Administratively, the country is divided into 88 oblasts. Tomsk Oblast is in Siberia, with a land area similar to that of Poland and a population of 1.1 million. The WHO-recommended approach to tuberculosis control was introduced in 1997.
Estonia is among the smallest of the FSU countries with a population of 1.3 million in 2010 [1]. In the decade 2001–2010, the number of notified TB cases fell from 708 in 2001 to 283 in 2010, while the number of cases of MDR-TB was around 60 to 90 each year [1]. The DOTS strategy has been implemented countrywide in Estonia since 1999.
Estonia and Russia are both middle-income countries, with per capita incomes of US$4,450 and US$1,780, respectively, in 2001, and US$14,370 and US$9,910, respectively, in 2010 [24].
MDR-TB diagnosis and treatment: pre- and post-adoption of WHO guidelines
Management of MDR-TB before and after the introduction of WHO guidelines was similar in Tomsk Oblast and Estonia. Before WHO guidelines were adopted, all TB cases were routinely tested for MDR-TB. Treatment for MDR-TB was determined by individual physicians, who were often constrained by the limited availability of second-line drugs as well as incomplete information about a patient’s susceptibility to first- and second-line drugs (while resistance to isoniazid and rifampicin was confirmed for all patients, data on resistance to other first- and second-line drugs was sometimes lacking). Surgery sometimes formed part of the treatment. Patients were almost always hospitalised throughout treatment and discharged when cavity closure was documented.
With the introduction of treatment for MDR-TB according to WHO guidelines (January 2001 in Tomsk Oblast and August 2001 in Estonia), management of patients with MDR-TB changed substantially. All cases diagnosed with MDR-TB were considered for treatment by a small expert committee (“consilium”) of four or five physicians, including both tuberculosis and public health specialists. This committee determined which patients should be enrolled, the treatment regimen and whether patients should be treated in hospital or as an outpatient. In Estonia, the exclusion criteria defined by the expert committee were a diagnosis of AIDS and a history of repeated default. In Tomsk Oblast, the expert committee used more exclusion criteria, including the presence of another life-threatening condition, high likelihood of default, patient unwillingness to be enrolled and a DST pattern that suggested treatment would fail (however, as illustrated in the Results section, almost all enrolled patients were resistant to three or more drugs and DST patterns were similar to those among patients enrolled on treatment prior to the adoption of WHO guidelines). In Tomsk Oblast, shortages of drugs during the study period also meant that priority was given to the patients who were most seriously ill. It was beyond the scope of our study to assess what happened to those patients who did not meet the inclusion criteria, although we acknowledge that they would have been a source of further transmission of tuberculosis in the community.
After the introduction of WHO guidelines, treatment regimens in both Estonia and Tomsk Oblast were designed based on DST results for first- and second-line drugs, and typically included six or seven drugs in the intensive phase of treatment, including a second-line injectable and any first-line drugs to which the patient was susceptible. Laboratory tests in Estonia in 2001 and 2002 were quality-assured by laboratories in the UK and Germany as well as by a supranational reference laboratory in Sweden. External quality assurance for the laboratory in Tomsk Oblast was provided by the Massachusetts State Laboratory Institute in Boston, MA, USA; this laboratory is part of the supranational laboratory network. In the 12–18-month continuation phase of treatment, started 6 months after conversion to culture-negative status, the injectable drug was removed from the regimen. All treatment was provided under direct observation. Transport vouchers and food packages were given to outpatients in Estonia, and food parcels or free provision of meals were provided at outpatient facilities in Tomsk Oblast. Clinical and laboratory staff in both settings were trained through international and national courses, and in Tomsk Oblast, technical assistance was provided on a regular basis by Partners in Health (a nongovernmental organisation headquartered in Boston). Patient progress was monitored using periodic radiography, and monthly sputum and culture examinations. A small management team was established to provide overall supervision of clinical and laboratory work, and to maintain a tuberculosis register in which data on patients, including their treatment outcomes, were recorded.
Patient cohorts studied
For treatment according to WHO guidelines, we considered the cohorts enrolled in the first 12–19 months after WHO guidelines were adopted. The time period was from January 1, 2001 to July 31, 2002 (19 months) in Tomsk Oblast and from August 1, 2001 to July 31, 2002 (12 months) in Estonia. For the period prior to the adoption of WHO guidelines, we considered a cohort of patients enrolled from July 1998 to December 1999 in Tomsk Oblast and a 3-yr cohort enrolled in south Estonia from 1995 to 1997. The Estonian cohort was selected because clinical records were still available and, with DST conducted in a supranational reference laboratory in Sweden, a diagnosis of MDR-TB was considered reliable.
Treatment outcomes
Treatment outcomes were assessed using internationally agreed consensus definitions [25]. There were six possible outcomes: cured, completed treatment, died, defaulted, transferred out of the district with treatment outcome unknown and failed treatment.
Cost and cost-effectiveness analysis
Any cost-effectiveness analysis requires comparison of relevant alternative strategies [26]. We compared treatment for MDR-TB according to WHO guidelines with treatment before these guidelines were adopted (as described above). Costs for both strategies were assessed from a health system perspective in 2003 US$ (the year in which most patients completed their treatment), using standard methods [26–28]. Patient costs were not considered because it was impossible to establish these costs in the period prior to the adoption of treatment according to WHO guidelines. In addition, after WHO guidelines were adopted, costs to patients were small. In Estonia and Tomsk Oblast, costs that are often borne by patients in other countries became the responsibility of the health system (e.g. transport costs, which were covered by vouchers in Estonia).
Two types of costs were considered: 1) the average cost of individual components of treatment (e.g. drugs or a visit for directly observed treatment); and 2) the average cost per patient treated. The costs of individual components of treatment were calculated using an “ingredients” approach, i.e. the quantity of resources used was multiplied by unit prices. Joint costs (e.g. staff that spent time on tuberculosis patients on first-line treatment for drug-susceptible tuberculosis and patients being treated for MDR-TB) were allocated according to the time spent on each group of patients. Vehicle and equipment costs were annualised using current replacement prices, the assumption of a 5-yr life expectancy and a discount rate of 3% [26–28]. Start-up training costs were annualised over 3 yrs. Building costs per year were based on rental values per month. All local costs were converted into US$ using the average exchange rate in 2003 (US$1 was equivalent to 14.7 Estonian kroons or 34.8 Russian roubles). The average cost per patient treated was calculated as the cost of each treatment component multiplied by the average number of times this cost was incurred. Sources of data included expenditure records, interviews with staff and patients, project records and databases, and clinical records. The social insurance system was also a source of data on the unit prices of several components of care in Estonia (e.g. the cost of different types of laboratory test and the cost of a bed-day in hospital). Data on the cost of second-line drugs were collected from national sources and from the Green Light Committee (GLC). The GLC was a mechanism established by WHO to help countries to access second-line drugs at the lowest possible price, and it helped to supply second-line drugs to Estonia and Tomsk Oblast in the years after WHO guidelines on MDR-TB treatment were adopted.
There was uncertainty about several parameters that influence the effectiveness of treatment for MDR-TB, which in turn affected estimates of both total costs and cost-effectiveness. The effectiveness, cost and cost-effectiveness of treatment for MDR-TB after WHO guidelines were adopted, compared with the pre-guidelines period, was therefore estimated as part of a multivariate uncertainty analysis. For consistency and comparability, this analysis was based on the same principles and much of the data that were used in previously published evaluations of MDR-TB treatment in Peru and the Philippines, full details of which are available elsewhere [4, 22] and in the online supplementary material. In brief, the analysis was designed to measure the effectiveness of treatment for MDR-TB in terms of cases cured, deaths averted and disability-adjusted life years (DALYs) averted, and to capture both: 1) effects among the patient cohort treated, and 2) the effect of treatment of this cohort on transmission, and hence the number of cases, and deaths and DALYs averted that occur in the future. A Microsoft® Excel™ (Microsoft Corp., Redmond, WA, USA) spreadsheet model was used in which treatment paths were defined for the same patient cohort (i.e. 149 patients in Estonia and 103 patients in Tomsk Oblast) for the two alternative strategies, i.e. treatment for MDR-TB before and after WHO guidelines were adopted (the analysis was undertaken for the same number of patients to avoid distortions caused by different numbers of patients in the cohorts considered before and after the introduction of WHO guidelines). The number of patients following each treatment path, together with their associated costs and effects, was then defined according to: 1) the parameters, parameter distributions and data sources listed in the online supplementary material [29–37]; 2) the costs per patient before and after the adoption of WHO guidelines, reported in this article; and 3) treatment outcomes before and after the introduction of treatment according to WHO guidelines, also reported in this article. A Monte Carlo simulation involving 5,000 iterations was used to estimate means and lower and upper bounds (fifth and 95th centiles) for the main outputs of interest, i.e. total costs and total DALYs lost for each strategy, total DALYs averted by treatment according to WHO guidelines, and the cost per DALY averted by treatment according to WHO guidelines.
Statistical analysis
We compared the clinical, socioeconomic and demographic characteristics of the patient cohorts treated before and after the introduction of treatment for MDR-TB according to WHO guidelines, and also compared the cohorts treated after the introduction of WHO guidelines in Estonia and Tomsk Oblast. We used Chi-squared tests for comparisons of categorical outcome variables. We also used the Chi-squared test to compare the treatment outcomes of chronic cases, new cases and re-treatment cases.
RESULTS
Patient enrolment and characteristics
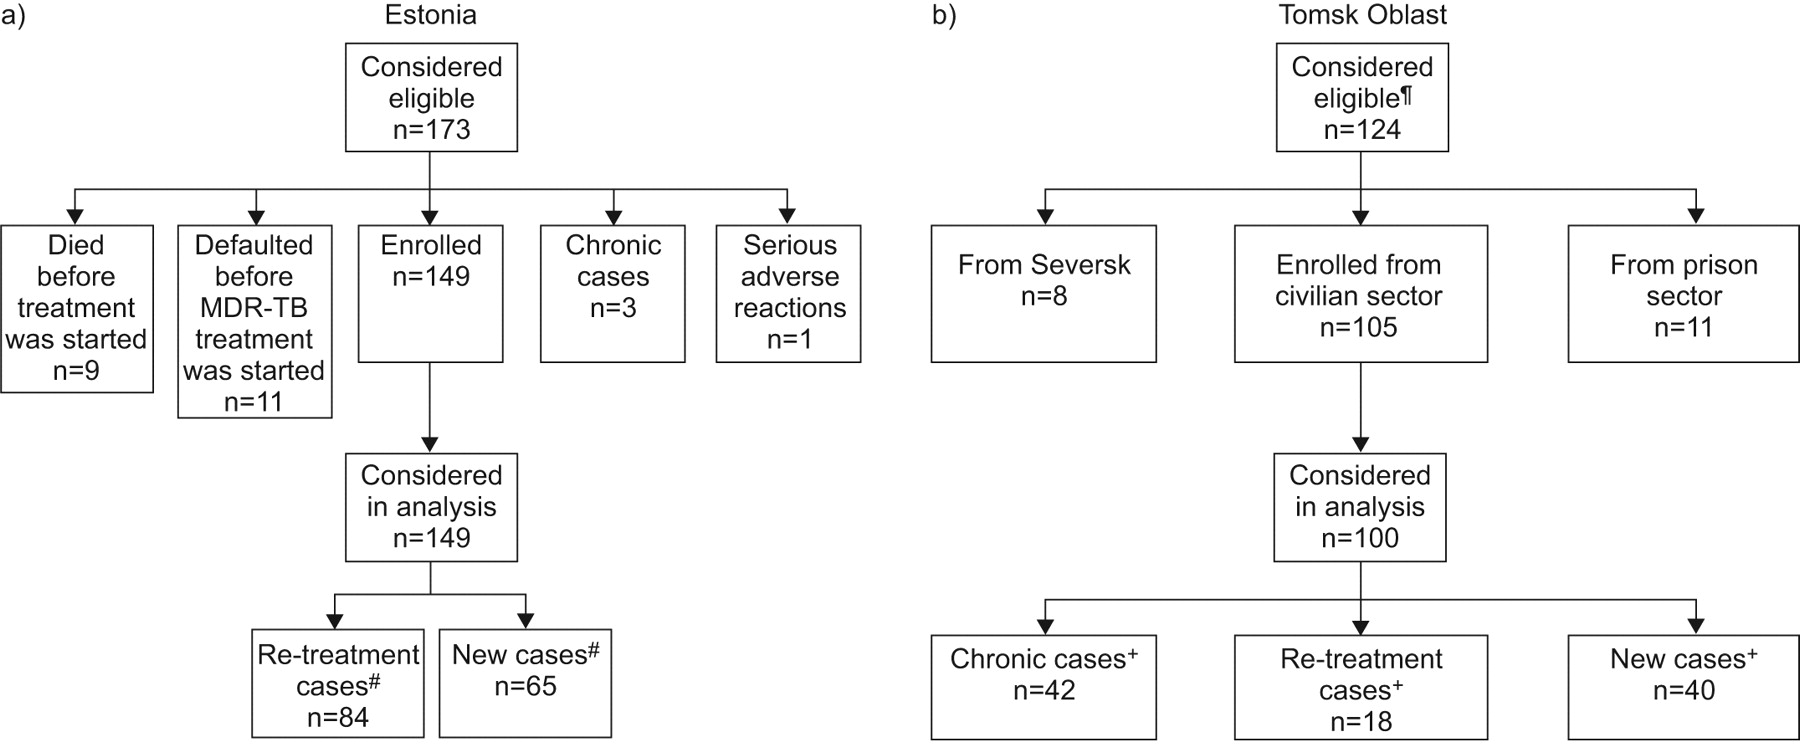
The clinical, socioeconomic and demographic characteristics of the patients treated for MDR-TB before and after the introduction of WHO guidelines in Estonia and Tomsk Oblast are summarised in table 1 (further details are available from the authors upon request). For the patient cohorts enrolled after the introduction of WHO guidelines, the numbers of patients considered eligible, enrolled on treatment and considered in our analysis are summarised in figure 1.

a) Patient enrolment in treatment according to World Health Organization (WHO) guidelines in Estonia from August 1, 2001 to July 31, 2002. b) Patient enrolment in treatment according to WHO guidelines in Tomsk Oblast, Russia from January 1, 2001 to July 31, 2002. #: re-treatment cases are patients who had been treated for tuberculosis (TB) before and who had failed or defaulted from the treatment regimen; new cases were patients who had not been previously treated for TB. ¶: there were 1,314 patients identified with multidrug-resistant (MDR)-TB during the study period. The large difference between this number and the 124 patients who were considered eligible was due to several factors. Anyone with severe concurrent pathology (e.g. diabetes, severe mental pathology or ulcer) was excluded, as were pregnant females. Rural residents were enrolled only if they lived in an area where a health worker was available to oversee treatment after discharge from hospital. Given the limited supply of second-line drugs, priority was given to patients whose condition was life-threatening. The programme was new and unproven, and not all cases were willing to consider treatment in it. Staff capacity was also a limiting factor, as there was a shortage of physicians considered to have the necessary competence to treat and manage side-effects associated with second-line drugs. +: chronic cases are patients who had already received at least two treatments with first-line drugs (a treatment regimen for a new case and a re-treatment regimen); re-treatment cases are patients who had been treated for TB before and who had failed or defaulted from the treatment regimen; new cases were patients who had not been previously treated for TB.
From August 1, 2001 to July 31, 2002, 173 cases were diagnosed with MDR-TB in Estonia, of whom 149 were enrolled on treatment according to WHO guidelines (fig. 1a). The average age of patients was 45 yrs and most were males (109 (73%) out of 149). Alcohol abuse and unemployment rates were high (30% and 42%, respectively), and patients had severe drug resistance (79% were resistant to five or more drugs). Among the 54 patients with MDR-TB treated before the introduction of WHO guidelines in Estonia, 63% were male. The age distribution was similar to the patient cohort treated according to WHO guidelines, but the rate of alcohol abuse appeared to be lower (p=0.01 when those for whom no data were available were excluded) and fewer cases were from urban areas (p=0.005). Most strikingly, there was less severe drug resistance (p<0.001), with only 4% of patients resistant to five or more drugs. Overall, ∼60% of patients were tested for HIV in Estonia and one was HIV positive.
In Tomsk Oblast, 124 patients were considered eligible for treatment for MDR-TB according to WHO guidelines (fig. 1b). Of these, we considered the 100 out of 105 patients from the civilian sector for whom detailed data on their treatment could be retrieved. We were unable to obtain permission to collect data from the prison sector. The average age was 38 yrs and 70% of patients were male. As in Estonia, unemployment and alcohol abuse rates were high. Drug resistance was less severe than in Estonia (29% of patients were resistant to five or more drugs), but 98% of patients were resistant to three or more drugs.
In the cohort treated before the introduction of treatment according to WHO guidelines, 83% of patients were male and the average age was 46 yrs, both significantly higher than the cohort treated after WHO guidelines were followed (table 1). There were no statistically significant differences between the cohorts for the other variables that we studied, except for the rate of alcohol abuse, which was higher in the cohort treated before the introduction of treatment according to WHO guidelines (p=0.04). Representative data on HIV status were not available.
Treatment outcomes
Treatment outcomes are shown in tables 2 and 3]. For the cohorts treated according to WHO guidelines, the cure rate was 76% in Tomsk Oblast and 61% (including patients that completed treatment) in Estonia. In the cohorts treated before the introduction of WHO guidelines, the cure rate was 15% in Tomsk Oblast and 52% in Estonia. The death rate in Tomsk Oblast before WHO guidelines were adopted was high, at 67%, and the remainder of patients (17%) failed treatment. Within the cohort treated according to WHO guidelines in Estonia, failure rates were lower but default rates higher among new cases compared to previously treated cases; in Tomsk Oblast, cure rates were lower and default rates higher in new cases compared with previously treated, chronic cases (p=0.01).
Cost and cost-effectiveness
The average cost per patient treated according to WHO guidelines (in prices for 2003) was US$8,974 in Estonia and US$10,088 in Tomsk Oblast. This was considerably more than costs in the period before WHO guidelines were used, which were US$4,729 in Estonia and US$2,282 in Tomsk Oblast (table 4). Drugs and in-patient care were the most important costs in both cohorts and in both sites; when combined, they accounted for 69–90% of total costs. The drug regimens used in Tomsk Oblast when WHO guidelines were followed were more expensive than those used in Estonia, at US$3,718 compared with US$2,219 per patient.
The total costs for each strategy, including both the costs of the cohort enrolled and the costs associated with secondary cases generated through transmission of tuberculosis by this cohort, are shown in table 5. The net increase in total costs associated with treatment for MDR-TB according to WHO guidelines was about US$0.5 million (range US$0.4–US$0.6 million) in Estonia and US$1.0 million (range US$0.9–US$1.1 million) in Tomsk Oblast. These additional costs resulted in a large number of averted deaths and DALYs (table 5). The mean cost per DALY averted by treatment according to WHO guidelines was US$579 (range US$297–US$902) in Estonia and US$429 (range US$302–US$546) in Tomsk Oblast.
The total funding required for treatment according to WHO guidelines of all registered cases of MDR-TB in 2003 was about US$1.3 million in Estonia and US$375 million in Russia when the costs in Tomsk Oblast are extrapolated to the whole of the country (table 6).
DISCUSSION
The cost of providing treatment for patients with MDR-TB according to WHO guidelines in Estonia and Russia (Tomsk Oblast) was about US$9,000–US$10,000 per patient treated (in prices for 2003), with the dominant cost items being second-line drugs and hospitalisation (averaging >6 months). This was about twice the cost of the treatment previously available in Estonia and four to five times the cost of the treatment previously available in Tomsk Oblast. The increase in costs was accompanied by a substantial improvement in the cure rate in Tomsk Oblast (76% compared to the previous 15%) and a smaller improvement in Estonia (61% versus 52%). The cost per DALY averted was about US$400–US$600.
Previous studies of the cost and cost-effectiveness of treatment for MDR-TB in low- and middle-income countries are limited to Peru and the Philippines. The cost of MDR-TB treatment in these countries was low compared with Estonia and Tomsk Oblast, at US$2,500–US$3,500 per patient [4, 22]. Almost all of the difference was explained by the high cost of hospitalisation in Estonia and Tomsk Oblast, at US$4,491 and US$3,341 per patient, respectively, compared with US$107 in the Philippines, and no hospitalisation in Peru. Drug costs were also higher, particularly in Tomsk Oblast (US$3,718 per patient versus US$2,219 in Estonia, US$1,557 in the Philippines and US$824 in Peru), which can be explained by more severe patterns of drug resistance, including to second-line drugs [4, 22]. The cost per DALY averted was two to three times higher than the approximately US$200 reported in the two studies from Peru and the Philippines, which used the same methodology for cost-effectiveness analysis. A more recent study from Peru [23] also produced similar results to our study for a strategy in which multidrug-resistance testing is conducted among all patients that had already received at least one course of tuberculosis treatment with first-line drugs, provided allowances are made for methodological differences (such as the number of years of life gained per death averted). However, results for a theoretical strategy in which all tuberculosis cases are tested for multidrug resistance, an approach which is directly comparable to the strategies implemented in practice in Estonia and Tomsk Oblast, were different. For Peru, this strategy was estimated to cost US$2,731 per quality-adjusted life-year gained, much more than we have estimated for Estonia and Tomsk Oblast. The explanation for this much higher figure is that compared with Estonia and Tomsk Oblast, Peru has much lower rates of multidrug resistance among new tuberculosis cases, the ratio of costs with multidrug-resistance testing to costs without multidrug-resistance testing is much higher, and better treatment outcomes for multidrug-resistant cases are achieved in the absence of treatment with second-line drugs [1, 2, 23].
Differences in the cure rates achieved in Estonia and Tomsk Oblast when WHO guidelines were adopted were mainly due to higher default and death rates in Estonia. The higher death rate in Estonia may be due to more severe patterns of drug resistance, which itself might reflect the after-effects of suboptimal treatment in the period before WHO guidelines were adopted as well as the less stringent enrolment criteria that were applied. The higher default rate is harder to explain; possible risk factors, such as unemployment and alcohol abuse, were present to a similar degree in both cohorts, and social support to encourage treatment compliance was available in both settings. A plausible explanation is that stricter enrolment criteria were used in Tomsk Oblast. The particularly high death rate in Tomsk Oblast before WHO guidelines were adopted is comparable to the natural history of disease, illustrating the low efficacy of treatment at that time.
Our study has several limitations. There were differences in the socioeconomic, clinical and demographic characteristics of the cohorts treated in the period before and after the adoption of WHO guidelines for the treatment of MDR-TB. In Estonia, there were lower rates of unemployment and alcohol abuse, and less severe patterns of drug resistance in the cohort treated before WHO guidelines were followed and, as a result, we may have underestimated the improvement in health outcomes associated with treatment according to the WHO guidelines in this setting. In Tomsk Oblast, a large number of patients were eligible for treatment but not enrolled. This could lead to over- or underestimation of the increased effectiveness associated with the introduction of WHO guidelines. The fact that priority was given to the most severely ill patients would tend to underestimate the effectiveness of treatment according to WHO guidelines, although the cure rates achieved were high. Both settings have a population of ∼1 million people, so the results apply to treatment that is provided on a relatively small scale. We did not collect data on costs to patients in either setting, since reliable data could not be obtained retrospectively for those patients treated before the WHO guidelines were adopted, and in Tomsk Oblast, we also lacked data on rates of HIV infection and data for patients treated in the prison sector.
Perhaps the most obvious limitation is that the data are relatively old, from patients started on treatment in 2001 and 2002. This is due to delays in finalising the results in the format of a paper for publication in a peer-reviewed journal. Nonetheless, the data are as recent as any other published data on the cost and cost-effectiveness of treatment for MDR-TB in low- and middle-income countries, and the numbers of cases of MDR-TB in 2010 were broadly comparable to numbers in 2001. Although recent analyses of the cost of second-line drugs and the regimens used in Estonia and Tomsk Oblast suggest that the cost of the regimens used in 2001–2002 remained at similar levels in 2010 (data not shown), two principal changes have occurred or are likely to have occurred in the years since the data were collected. First, some of the costs associated with treatment are likely to have increased, notably costs (such as those of staff providing care in outpatient facilities or on hospital wards) that are closely related to income levels. Average gross national income (GNI) per capita almost doubled in Estonia and almost tripled in Russia between the end of 2003 (the year for which we estimated costs in US$) and 2010, reaching US$14,370 in Estonia and US$9,910 in Russia in 2010 [24]. Secondly, the funding available for tuberculosis control in both countries grew, especially in Russia. On the assumption that the cost of the drug regimens has remained unchanged (as suggested by analysis of the cost of the regimens used at current prices quoted by the GLC; data not shown) but that other costs have increased in line with the growth in incomes per capita, the cost per patient treated in 2010 would have been US$20,910 in Estonia and US$22,512 in Russia, and the cost per DALY averted would be US$692–US$2,101 and US$674–US$1,218, respectively. Funding for tuberculosis control increased more than the estimated growth in costs in Russia, reaching US$1.3 billion in 2010. Although the total funding available for tuberculosis control in Estonia was not available, the funding available for second-line drugs had increased to approximately US$3,500 per patient.
The strengths of this study include the collection of detailed data on health services utilisation, costs and treatment outcomes for MDR-TB cases for all patients, and that this is the first study to provide evidence about the cost and cost-effectiveness of treatment for MDR-TB according to WHO guidelines in FSU countries, the part of the world where the problem of MDR-TB is most severe. The results from Tomsk Oblast may be broadly generalisable to other parts of Russia, given a common approach to tuberculosis control across the country, and results from Estonia may be generalisable to the two other Baltic countries (Latvia and Lithuania). Results from Tomsk Oblast also have broad relevance to other FSU countries, given similar levels of drug resistance and comparable models of care that remain largely hospital based.
Our results suggest that treatment for MDR-TB according to WHO guidelines can be cost-effective in both Estonia and Russia. The cost per DALY averted in both settings was much less than per capita gross domestic product, a threshold that WHO has used to define interventions that are “highly cost-effective” [38]. This would remain the case even if the nondrug costs of treatment have risen in line with GNI per capita since the time the study data were collected. However, expanding treatment according to WHO guidelines to all cases of MDR-TB in FSU countries will require a big increase in funding. In the Global Plan to Stop TB from 2011 to 2015, the cost of such expansion has been projected at US$3.5 billion over 5 yrs, increasing from US$0.6 billion in 2011 to US$0.8 billion in 2015 [39], compared with reported funding of US$259 million in 2011 [1].
Overall conclusions
Treatment of patients with MDR-TB can be cost-effective in Estonia and Russia, and results may be broadly generalisable to neighbouring European countries with a high burden of MDR-TB. Scaling up MDR-TB treatment in the 18 priority countries of the WHO European Region in line with targets set in the Stop TB Partnership’s Global Plan to Stop TB for 2011–2015 [39] will require a substantial increase in funding for tuberculosis control.
Acknowledgments
We thank C. Fitzpatrick (Stop TB Dept, World Health Organization, Geneva, Switzerland) for his valuable assistance in finalising some of the analyses for Tomsk Oblast, Russia.
Footnotes
For editorial comments see page 9.
This article has supplementary material available from www.erj.ersjournals.com
Support Statement
The study was partly supported by grants provided to the World Health Organization by the United States Agency for International Development and the Bill and Melinda Gates Foundation.
Statement of Interest
A statement of interest for S. Keshavjee can be found at www.erj.ersjournals.com/site/misc/statements.xhtml
- Received September 30, 2011.
- Accepted December 7, 2011.
- ©ERS 2012
REFERENCES


