


Abstract
Assessment of total plasma DNA can be a promising noninvasive tool for monitoring the effect of cytotoxic therapies in order to predict therapeutic efficacy at an early stage.
Cell-free plasma DNA levels were quantified before the first, second and third cycle of chemotherapy in 42 patients with advanced nonsmall cell lung cancer and correlated with response to therapy, as assessed by computed tomography following the third chemotherapy cycle.
A significantly lower plasma DNA level, measured before various treatment cycles, was found in patients with remission or stable disease than in those with progression. Higher levels and insufficient decrease in plasma DNA levels during the course of chemotherapy indicated poor outcome. For predicting insufficient therapy response, a sensitivity of 26.9% was achieved at 100% specificity using plasma DNA levels before the first therapy cycle. Prediction of disease progression was achieved with a sensitivity of 35.7% at 100% specificity using plasma DNA levels before the first therapy cycle.
Monitoring of plasma DNA levels during the course of chemotherapy could identify patients who are likely to exhibit an insufficient therapeutic response and disease progression at an early stage. This may help in individualising treatment, and could lead to better management of advanced-stage lung cancer.
Lung cancer is the leading cause of cancer-related death in India and across the globe 1. Although the low 5-yr survival rate (<15%) has changed minimally since the mid-1980s, new agents are being identified in order to improve results. For the treatment of advanced-stage lung cancer patients, in addition to first-line chemotherapy, second- and third-line chemotherapy and targeted therapeutic agents are a few of the treatment options currently in use 2–4. However, lack of a simple and effective tool for predicting therapeutic efficacy early during the course of treatment has restricted progress in improving the survival of these patients. Although positron emission tomography, alone or in combination with computed tomography (CT), has shown some potential in the estimation of therapeutic efficacy 5–7, the low sensitivity, detection of only macroscopic alterations, and that after several cycles of cytotoxic therapy, and the risk of radiation exposure has limited their utility for monitoring therapeutic efficacy at an early stage. Thus there is a growing need for more effective diagnostic tools for: 1) prediction of the prognosis of the patient, 2) monitoring of the treatment course, and 3) detection of response to therapy at an early stage. This would help in optimising disease management on an individual basis. Biomarkers present in the circulation are promising candidates since their kinetics can reflect the effect of cytotoxic therapies. The advantage associated with biomarkers is that they take into account the heterogeneity as well as the activity of the tumour mass. Further, serial assessment of biomarkers during cytotoxic therapy may help in early prediction of therapeutic efficacy.
The finding that tumours are capable of shedding DNA into the blood stream, which can be recovered from both serum and plasma and used as surrogate source of tumour DNA, has opened new areas of diagnosis and prognosis 8. Apoptotic cell death is known to be the major source of cell-free DNA present in the circulation (cfDNA). It is noteworthy that most cytotoxic therapies cause cell death by apoptosis, leading to the release of cfDNA. As the quantification of the cell death in tumour tissues normally requires invasive procedures and assesses only part of the heterogeneous pathophysiological processes, analysis of the kinetics of cfDNA may be an alternative for monitoring of cytotoxic therapy as it can easily be measured serially during the course of the disease and treatment.
Keeping these observations in focus, the present study was designed with the aim of analysing the efficacy of levels of cfDNA for monitoring first-line chemotherapy in a homogeneous group of patients with advanced nonsmall cell lung cancer (NSCLC). The primary objective was to determine whether or not cfDNA levels can predict response to therapy or disease progression (P) at an early stage in advanced NSCLC. Additionally, the utility of cfDNA as a prognostic factor for survival in NSCLC patients was assessed.
MATERIALS AND METHODS
Patients
In this prospectively performed study, 42 newly diagnosed and untreated advanced-stage NSCLC patients were evaluated. Only those patients who received a minimum of three cycles of chemotherapy were included in the study. A total of 100 controls (patients with benign pulmonary diseases, including 32 with chronic obstructive pulmonary disease, 26 pulmonary tuberculosis, 33 sarcoidosis, four bronchiectasis and five interstitial lung disease) were also included. All patients were enrolled from the outpatient Dept of Medicine of the All India Institute of Medical Sciences (New Delhi, India) during the years 2006–2009. For all patients, a diagnosis of lung cancer was confirmed by histological examination of biopsy and/or cytology specimens obtained during fibreoptic bronchoscopy or with a CT-guided procedure. Pretreatment assessment included evaluation of Eastern Cooperative Oncology Group (ECOG) performance status, radiography and CT scan of the chest and upper abdomen. If necessary, a CT or magnetic resonance imaging scan of the brain and radionuclide bone scan were performed. All of the patients were staged according to the recommendations made by the International Association for the Study of Lung Cancer (IASLC) Staging Committee for NSCLC 9. Epidemiological data, including demographics, stage, tumour size and histopathological data, and risk factors, including smoking habit and alcohol intake, were also recorded. A smoker was defined as a person who smoked >20 pack-yrs bidis or cigarettes during their lifetime (a bidi being a traditional Indian smoking product that is made with aged Indian tobacco, hand wrapped in a tembhurni leaf, nubbed on one end and bound with a thin string on the other). A never-smoker was defined as a person who had not smoked >100 bidis/cigarettes in their lifetime. Smoking in pack-years was calculated as the product of smoking duration (in years) and the mean number of packs (i.e. 20 bidi/cigarette equivalents) smoked daily. Alcohol habit was defined based on a previous report 10. Alcohol drinkers were defined as people who drink alcoholic beverages at least once daily for ≥6 months. The quantity of alcohol drunk daily was the product of the amount consumed (in millilitres) and the percentage of alcohol in the product (assuming 3% for beer, 10% for toddy and 40% for the remaining alcoholic drinks). The quantity of Indian and non-Indian alcohol consumed was the sum of the alcohol amount from the relevant beverages, as specified above. In patients with NSCLC, response to therapy was classified according to the World Health Organization (WHO) guidelines, defining complete remission (CR) as compete disappearance of all tumour lesions, partial remission (PR) as tumour reduction by ≥50%, P as tumour increase by ≥25% or the appearance of new tumour manifestations, and stable disease (SD) as tumour reduction by <50% or increase by <25% 11. The radiology reviews performed for response measurements were independent and blinded. The study was approved by the Ethics Committee of the All India Institute of Medical Sciences, and written informed consent was obtained from all of the patients.
Analysis of cfDNA levels
Venous blood was collected in sterile EDTA-coated vials from all subjects at baseline (for determination of baseline cfDNA level before first chemotherapy cycle (BV1)). Blood was also collected before the second (for BV2) and third cycles of chemotherapy (for BV3). Within 1 h, samples were centrifuged (2,500×g for 10 min) and the plasma was removed, aliquoted and stored at -80°C until further analysis. DNA from stored plasma fractions was isolated using the QIAamp DNA Blood Mini Kit (QIAGEN, Valencia, CA, USA) as per the manufacturer's instructions. The time from plasma separation and storage to performing plasma DNA extraction and quantification was <6 months. In addition, in order to avoid any variation in plasma DNA levels, the storage time and temperature were kept comparable for all samples. The isolated DNA was stored at -20°C until further use. cfDNA was quantified using the PicoGreen dsDNA Kit (Molecular Probes, Eugene, OR, USA) according to the manufacturer's instructions. PicoGreen reagent is an ultra-sensitive fluorescent nucleic acid stain for the quantification of double-stranded DNA in solution. Briefly, PicoGreen dye was diluted 1:200 with TE buffer (10 mM Tris–HCl, 1 mM EDTA; pH 7.5). Each reaction contained 50 μL diluted PicoGreen dye solution plus a sample of DNA made up to 50 μL in TE buffer. Each DNA sample was analysed in two duplicated dilution series. An ELISA plate containing these reagents was read in the Synergy HT Multi-Mode microplate reader (Bio-Tek, Winooski, VT, USA) at an emission wavelength of 520 nm and excitation wavelength of 480 nm. In order to minimise photobleaching effects, the time for fluorescence measurement was kept constant for all samples. Blank values were subtracted and replicates averaged for each sample. Standard curves were constructed by serial dilution of the lambda DNA stock provided by the manufacturer. Plasma DNA concentrations were determined from a standard curve. The people performing the plasma DNA quantification were blinded to the clinical outcome of the patients at the time of testing.
In the present study, cfDNA levels were compared in patients with P and those showing remission (R; CR+PR) and SD in order to predict P (evaluation 1). In addition, cfDNA levels in patients with R were compared with those exhibiting P and SD in an effort to predict insufficient response to therapy (evaluation 2).
Statistical analysis
In order to test the association of response to therapy with the overall survival of the patients, Kaplan–Meier curves and log-rank analyses were established for various response groups.
Concerning the biochemical variables, BV1, BV2 and BV3, and the percentage changes between them (BV1–BV2 and BV1–BV3), were considered for statistical analyses. The Kruskal–Wallis test was applied to measure the significance of cfDNA level in predicting response to therapy. If found significant, a post-hoc analysis was performed to compare their levels between any two response groups (Bonferroni correction applied; p<0.017 was taken as a significant value) by Wilcoxon rank-sum test. Friedman's test was applied for comparing successive cfDNA levels within a group. Multiple comparisons were performed using the post-hoc Wilcoxon signed-rank test. Further, cfDNA level was evaluated for its power to univariately discriminate between: 1) patients with P and without P (R+SD; evaluation 1), and 2) patients with R and without R (P+SD; evaluation 2) by Wilcoxon rank-sum test. In order to identify the diagnostic biomarker for insufficient therapeutic efficacy and P, receiver operating characteristic (ROC) curves and the corresponding areas under the curve (AUCs) were calculated. In addition, sensitivity, positive predictive value, negative predictive value and cut-off values for detecting insufficient therapeutic efficacy and P were calculated at 100% specificity (with 95% confidence interval (CI)). In order to test the association of BV1, BV2 and BV3 with the overall survival of the patients, Kaplan–Meier curves and log-rank analyses were established using their median values as cut-off points. Total plasma DNA levels were compared between patients with NSCLC and controls using an independent-sample unpaired t-test. A p-value of <0.05 was considered significant. All statistical analyses were performed with the SPSS software program for Windows (SPSS 9.1; Stata Corporation, College Station, TX, USA).
RESULTS
Patient's characteristics
The median age of the 42 patients with NSCLC was 55.5 yrs (range 33–78 yrs), and 56.5 yrs (range 35–86 yrs) in the 100 controls. The mean±sd plasma DNA levels were 95.1±32.1 ng·mL−1 in NSCLC patients and 74.0±19.9 ng·mL−1 in controls, the difference being highly significant (p<0.001). The baseline characteristics of the patients with NSCLC are given in table 1. Briefly, 23 patients had stage III disease and 19 stage IV disease. The majority of the patients were smokers (85.7%) and had squamous cell carcinoma (73.8%). Of the patients, 20 each received paclitaxel plus carboplatin or cisplatin plus etoposide combination chemotherapy, whereas two received gemcitabine plus carboplatin for a minimum of three cycles.
Correlation of patient characteristics with survival
Staging investigations following the third cycle of chemotherapy showed that four (9.5%) of the 42 NSCLC patients showed CR, 12 (28.6%) PR, 14 (33.3%) P and 12 (28.6%) SD. Patients with PR were combined with those with CR to form the R group (16 out of 42; 38.1%). The median follow-up time was 332.5 days (range 173–864 days). The median survival time was 367 days (95% CI 310.0–424.0 days). Kaplan–Meier curves for overall survival showed highly significant differences in survival between patients with R and SD or P (p<0.001), with median survival times of 528 (95% CI 430.7–625.3), 327 (95% CI 320.2–333.8) and 322 (95% CI 298.3–345.6) days, respectively. For evaluation 1, in which patients with R and SD were compared with those with P, a significant difference in overall survival was observed, with median survival times of 416 (95% CI 356.5–475.5) and 322 (95% CI 298.3–345.6) days, respectively (p<0.001). Similarly, patients who achieved R showed greater survival duration than those with P and SD (evaluation 2), with median survival times of 528 (95% CI 430.7–625.3) and 327 (95% CI 319.3–334.7) days, respectively (p<0.001).
The univariate survival analysis was also examined for variables, including age, stage, tumour factor, nodal status, performance status, histology, smoking and tobacco habits, and chemotherapy regimen (table 1). A significant trend for tumour location (p = 0.036) was observed. A nonsignificant trend for tumour size (p = 0.057) was also found. However, no correlation between other prognostic factors and survival was observed (table 1).
Evaluation of cfDNA levels in various response groups
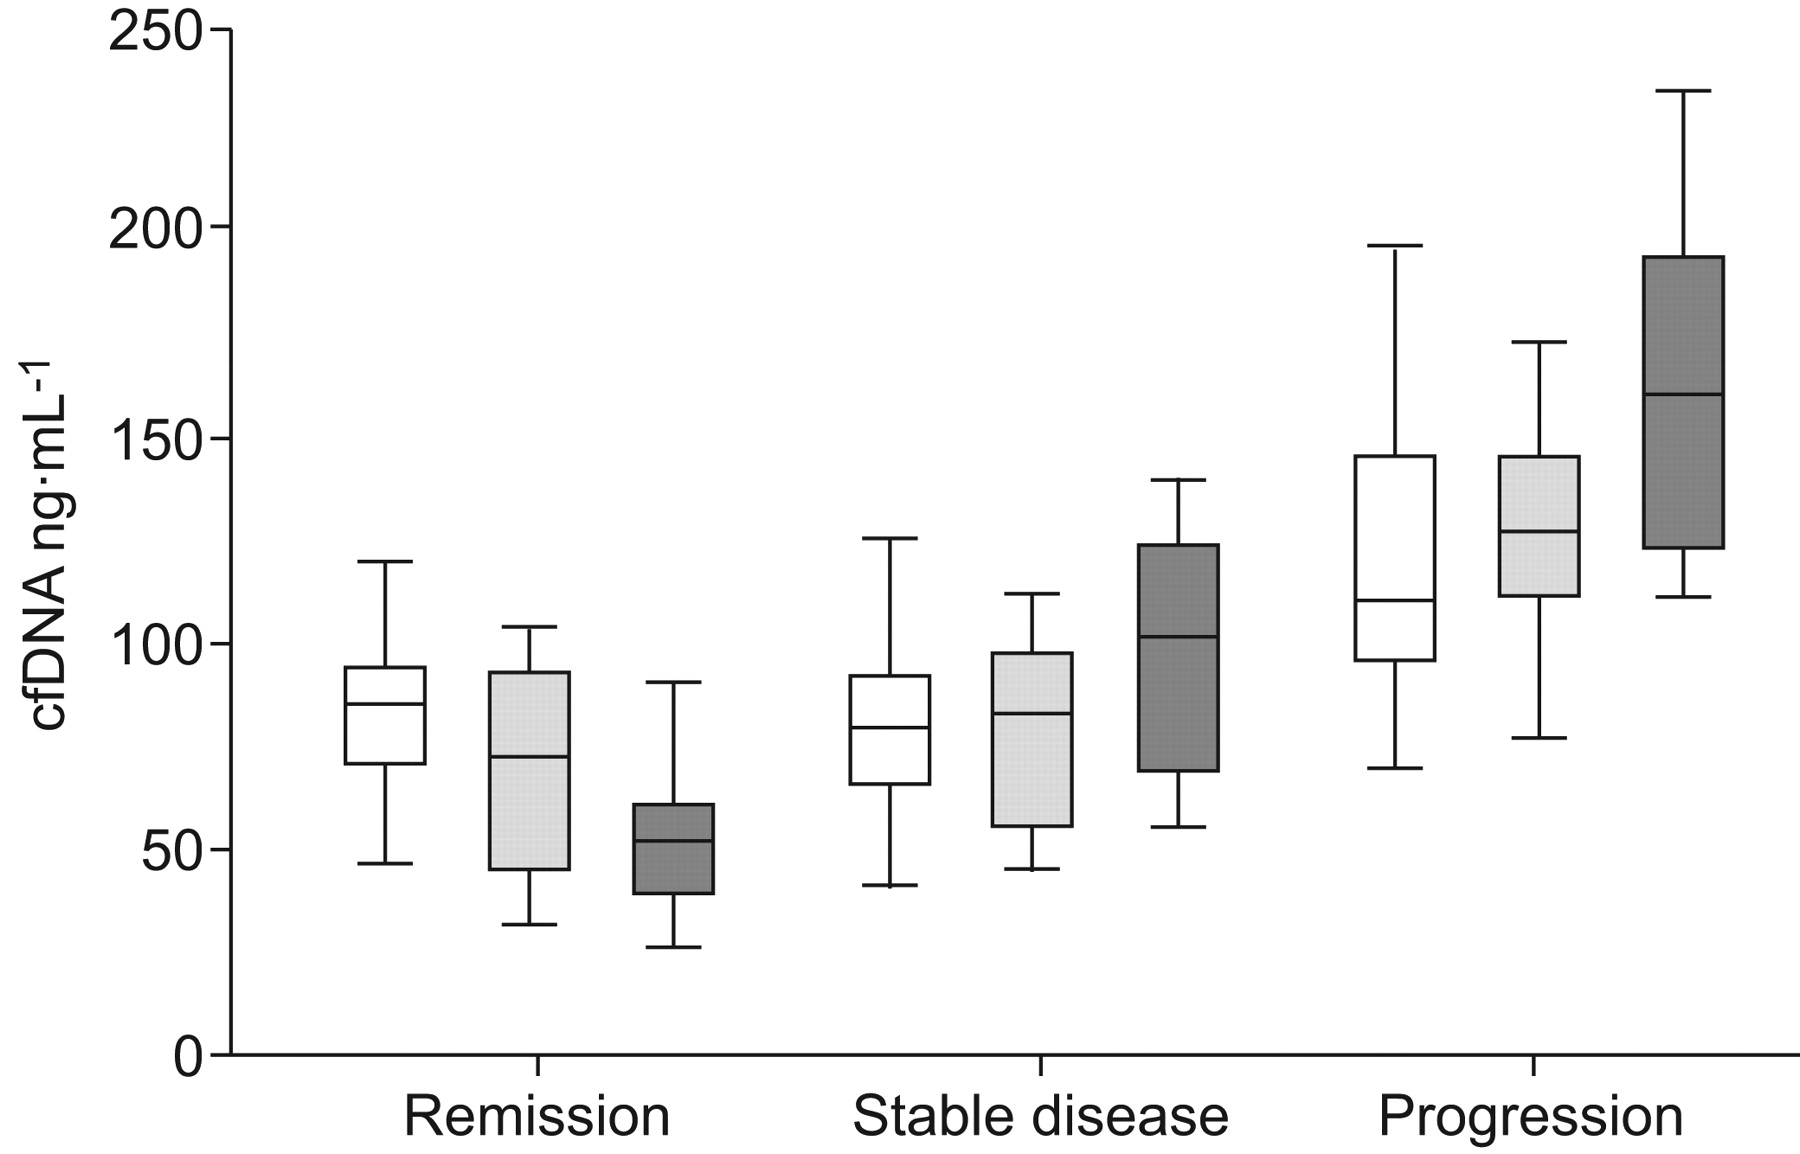
The BV1, BV2 and BV3 were quantified in 42 patients with advanced-stage NSCLC. Overall, a significant difference in cfDNA levels was observed among all three groups (R, SD and P). When compared among any two groups, significantly lower BV1, BV2 and BV3 were observed in patients with R or SD as compared to patients with P (table 2). However, patients with R were distinguished from patients with SD only by the BV3 (table 2). cfDNA levels decreased in patients with R but increased in patients with SD or P during chemotherapy (table 2; fig. 1). The fraction of patients with lower BV2 than BV1 in the various groups were 75.0 (R), 50.0 (NC) and 35.7% (P), and with lower BV3 than BV1 were 100 (R), 25 (NC) and 0.0% (P), respectively.

Distribution of cell-free plasma DNA (cfDNA) levels in various response groups before the start of the first (□), second (░) and third (▒) chemotherapy cycles. Boxes represent median and interquartile range; vertical bars show range.
The kinetics of cfDNA from cycle 1 to 2, cycle 1 to 3 and cycle 2 to 3 were also assessed in correlation with its efficacy in distinguishing various response groups (table 2). A significant decrease in cfDNA levels was observed from cycle 1 to 3 and from cycle 2 to 3 in patients with R as compared to those with P (table 2). The kinetics of cfDNA from cycle 1 to 3 and cycle 2 to 3 was able to distinguish patients with R from those with SD. However, the kinetics of cfDNA was not able to distinguish patients with SD from those with P (table 2).
Evaluation of cfDNA levels for predicting P and insufficient response to therapy
In order to assess the efficacy of cfDNA levels in predicting insufficient response to therapy and P in patients with NSCLC, BV1, BV2 and BV3 were compared in different response groups. Although pretreatment cfDNA levels (BV1) could not predict insufficient response to therapy (p<0.09), they were able to predict P (p<0.001; table 2). Further, BV2 and BV3 were able to predict insufficient response to therapy and P. Additionally, the kinetics of cfDNA levels from cycle 1 to 2 (BV1–BV2), cycle 1 to 3 (BV1–BV3) and cycle 2 to 3 (BV2–BV3) was able to predict insufficient response to therapy (table 2).
Diagnostic profile of cfDNA levels during chemotherapy for predicting insufficient response to therapy and P
In order to test the potential of cfDNA levels as a biomarker for the prediction of insufficient response to therapy, ROC curves were plotted for BV1, BV2 and BV3. Using BV1, insufficient response to therapy could be predicted with a sensitivity of 26.9% at absolute (100%) specificity (AUC 0.657; cut-off value 121.1 ng·mL−1). Further, BV2 and BV3 were able to predict insufficient response to therapy with a sensitivity of 50.0% (AUC 0.805; cut-off value 105.8 ng·mL−1) and 80.8% (AUC 0.954; cut-off value 93.8 ng·mL−1), respectively, at 100% specificity.
The relevance of BV1, BV2 and BV3 in predicting P was also assessed (fig. 2). From the ROC curve, it was observed that, among all of the values, BV2 most efficiently identified patients with P with a sensitivity of 71.4% at 100% specificity (AUC 0.926; cut-off value 115.6 ng·mL−1). Further, BV1 and BV3 were able to predict P with a sensitivity of 35.7% (AUC 0.853; cut-off value 132.5 ng·mL−1) and 64.3% (AUC 0.952; cut-off value 140.6 ng·mL−1), respectively, at 100% specificity.

Receiver operating characteristic curves for predicting disease progression by cell-free plasma DNA levels before the start of the first (--------; area under the curve (AUC) 0.853), second (–––––; AUC 0.926) and third (– – – –; AUC 0.952) cycle of chemotherapy (········: reference line).
cfDNA levels as a prognostic marker in NSCLC
The correlation between cfDNA levels before various treatment cycles and survival time was investigated in 42 NSCLC patients who received chemotherapy and for whom survival data were available. With the median cfDNA level as the cut-off value, patients were divided into high- (above or equal to median) and low (below median)-cfDNA groups. No correlation was observed between BV1 and BV2 and survival (table 3). However, BV3 was significantly related to survival (table 3).
DISCUSSION
The presence of circulating tumour DNA in the serum/plasma of cancer patients has sparked great interest because conventional diagnostic tests tend to be imperfect and more invasive, posing logistic difficulties for serial tumour sampling. Less-invasive techniques, such as blood tests, are attractive for screening, diagnosis, prognosis, surveillance for occult P, identification of potential therapeutic targets and monitoring of tumour responses. With the advance in laboratory techniques, it has now become possible to isolate and quantify cfDNA from easily accessible plasma/serum and other body fluids, such as lavage fluids (obtained from various organs), urine and ascites 12. Along with the finding that cfDNA originates from tumours 12, such analysis may reflect all of the physiological and pathological processes going on in the human body, thus making them a very interesting target for the development of useful clinical assays. Further, such analysis may be commercially viable owing to their easy availability in the market and their cost-effectiveness comparing to more expensive imaging tools.
The first evidence supporting the tumoural origin of plasma DNA in cancer patients was provided in the late 1980s 13. However, the final proof that tumours can shed DNA into the circulation came from two studies that detected oncogenic N-ras mutations in the plasma of patients with myelodysplastic syndrome and acute myelogenous leukaemia 14, and K-ras mutations in the plasma and serum of patients with pancreatic adenocarcinoma 15, respectively. Since then, numerous groups have studied the quantitative and qualitative aspects of circulating DNA in cancer, although the sensitivity and specificity of the various methods utilised have shown great variability 8, 12. Significantly higher plasma DNA levels were found in NSCLC patients than in controls with various benign pulmonary diseases. This suggests that the increased presence of cfDNA in the plasma of lung cancer patients might be due to apoptosis, necrosis, tumour cell lysis or the excessive turnover rate of tumour cells. Further, findings in mice bearing human tumours and undergoing chemotherapy or surgery suggested that cfDNA can be used for monitoring the effect of therapy 16, 17. In mice bearing human tumours, a marked transient rise in the levels of human-specific cfDNA (tumour-specific DNA) occurred immediately after chemotherapy or surgery, followed by a rapid decrease 16, 17. These observations indicated that the kinetics of tumour-specific DNA in plasma may reflect tumour burden, i.e. the rapid cell death following treatment may release tumour cell DNA into the circulation, which decreases as the tumour regresses. These studies indicate that analysis of cfDNA may play a potential role in monitoring the efficacy of cancer therapies.
In the present study, the trend in cfDNA levels analysed at three different time-points in advanced-stage NSCLC patients receiving first-line platinum-based chemotherapy was correlated with response to therapy. Comparable BV1 and BV2 were found in patients with R and SD. However, when compared with patients with P, patients with R or SD showed significantly lower BV1–BV3. Similar results were also reported for serum nucleosome levels (cfDNA is associated with histone proteins) measured before various cycles of chemotherapy in patients with NSCLC 18 and small cell lung cancer (SCLC) 19. During the course of chemotherapy, a decrease in cfDNA levels was observed in patients with R, whereas the levels increased in patients with SD or P. There is a paucity of published work on the utility of cfDNA as a monitoring tool for lung cancer receiving chemotherapy. In a previous study, a significant decrease in serum DNA levels was observed in patients with SD and R; however, plasma DNA concentrations remained unchanged 20. In the same study, patients with P showed a significant increase in plasma DNA concentrations, an observation similar to the present one. A decline in post-treatment plasma DNA levels has also been observed previously 21. Plasma DNA concentrations have also been observed to decline significantly in lung cancer patients after undergoing surgery 22. In a study on rectal cancer patients undergoing chemoradiation, median plasma DNA levels before and after the end of treatment were comparable in responders and nonresponders 23. However, at the end of treatment, responders showed a further decrease in circulating DNA level, whereas, in nonresponders, the circulating DNA manifestly increased. These findings suggest that monitoring the levels of cfDNA during the course of cytotoxic therapies may help in predicting response to therapy. It is necessary to mention here that, as the present study dealt with only a limited number of NSCLC patients, validation of these comparisons for differentiation of various response groups needs to be performed on a larger sample size.
The present results with cfDNA are in accordance with the hypothesis that, in responders, any decrease in tumour mass due to cytotoxic therapies causes a substantial decrease in the levels of tumour markers. Conversely, there is either a mild decrease or an increase in marker levels in nonresponders due to insufficient therapy response. It should be noted that there are considerable numbers of dying cells during chemotherapy, thus releasing cfDNA into the circulation of both responders and nonresponders. The significant difference observed in cfDNA levels between responders and nonresponders may not only reflect the change in tumour load due to cytotoxic therapies but also factors that may also influence the levels of cfDNA, such as: 1) activity of DNases 24, 2) efficiency of cfDNA clearance from the circulation 25, 26, 3) macrophage number and function 27, 4) activity, proliferation and turnover rate of the residual tumour mass, 5) dysfunctional DNA repair mechanisms, and 6) the blood supply of tumour tissues that facilitate the transition of cfDNA into the blood circulation.
A significant difference in overall survival time was observed between patients who went into R as compared to patients with SD or P. As patients with no change in disease status, i.e. SD, they are those in whom tumour reduction was insufficient to be classified as R or an increase in tumour growth was insufficient to be considered as P. Thus it would be useful to find patients who are going to either: 1) respond to the treatment, or 2) progress to a more advanced stage of disease at an early stage. For both of these groups, it would be necessary to focus on the biomarkers already available before the start of the first or second course of treatment. This could be helpful in the better management of these patients since prediction of insufficient response to therapy or P at an early stage can be used to either intensify treatment or change the treatment plan. Therefore, two different evaluations of cfDNA levels before various treatment cycles were conducted in order to address both clinical questions.
For predicting P (evaluation 1; R+SD versus P), it was observed that pretreatment cfDNA levels were able to predict P, an observation that contrasts with a previous study on SCLC 19. Further, BV2 predicted P with the greatest sensitivity (71.4%) at 100% specificity. This is much higher than the sensitivity of 29% at 100% specificity using serum nucleosomes measured on day 8 of the first chemotherapy cycle and CYFRA 21-1 (cytokeratin 19 fragments) measured before cycle 2 18. It is to be noted that, since the specificity is absolute, none of the responders are harmed by modifying the treatment plan at an early stage using this information. In a previous study on SCLC patients, a sensitivity of 30 and 40% was achieved at 95% specificity for predicting P using serum nucleosome levels before the second and third cycle of chemotherapy, respectively 19.
For predicting insufficient response to therapy (evaluation 2; R versus SD+P), it was observed that, except for BV1, cfDNA levels before various chemotherapy cycles were able to predict insufficient response to therapy, an observation also reported previously in SCLC 19. It should be noted that, for predicting insufficient treatment efficacy, biomarkers should not misclassify responders as nonresponders since this would lead to cessation of successful therapy. Taking this into account, it was possible to predict insufficient response to therapy with a sensitivity of 26.9 and 50.0% at 100% specificity using BV1 and BV2, respectively. This again, scores better than the sensitivity achieved by measuring serum nucleosomes before the second cycle of chemotherapy in NSCLC (31.4% at 90% specificity) 18, as well as SCLC (23.5% at 95% specificity) patients 19.
The correlation between plasma levels of cfDNA measured before various treatment cycles and survival time was also analysed in an effort to analyse its utility as a prognostic marker for survival in NSCLC patients. A correlation was observed between BV3 and survival; i.e. patients with lower cfDNA levels survived longer. The existing data regarding the prognostic relevance of pretreatment cfDNA level in lung cancer are scant and conflicting 20, 22, 28–31. Some studies have demonstrated correlation between an elevated plasma DNA concentration and poor survival 20, 28, 30, 31, whereas others, including the present work, have not 22, 29. Possible explanations for the discrepancy in survival data may be variation in patient selection, combining NSCLC and SCLC together 28, 29, and/or different methods of DNA isolation and quantification. Since NSCLC and SCLC differ in biology, treatment and prognosis, only NSCLC patients were included in the present study.
One of the limitations of the present study was that plasma DNA levels were quantified using the fluorescence-based PicoGreen method. For DNA quantification, the quantitative real-time PCR (qPCR) method has been regarded as the gold standard since it can detect a large range of small amounts of nucleic acids. Also, qPCR is characterised by high accuracy and high sensitivity. However, it requires specific automated systems and remains expensive, thus limiting its commercial applicability. Further, the use of various gene-specific primers or probe sequences and availability of numerous real-time PCR devices requires the optimisation of qPCR reaction conditions, which hampers the comparison of data from different laboratories 32. Other techniques, such as radioimmunoassay and the common bench ultraviolet-spectrophotometer method cannot detect DNA concentrations below nanogram levels. The PicoGreen method demonstrates an exceptionally high detection limit, up to 25 pg·mL−1, and perfect linearity up to 1,000 ng·mL−1, making the test appropriate for circulating DNA analysis. Additionally, a strong and positive correlation has been observed between the PicoGreen assay and qPCR 33. Further, a simple uniform protocol and microplate assay format makes the PicoGreen assay a rapid, effective and inexpensive tool for high-throughput quantification of cfDNA, especially for serial assessment for screening, diagnostic or prognostic purposes.
A recent study has shown the effect of storage time of whole plasma and purified DNA on the levels of plasma DNA quantified from lung cancer patients and age-matched controls using a real-time PCR-based assay 34. In that study, plasma DNA levels declined at a mean rate of ∼30% annually when two samples of plasma and isolated DNA were assessed for each patient with a median gap of 41 months between the two assessments. The authors concluded that care must be taken while performing large-scale prospective studies or retrospective studies with stored plasma samples or purified DNA. In the present study, the time from plasma separation and storage to performance of plasma DNA extraction and quantification was <6 months in order to avoid any such time-dependent variation. In addition, plasma samples were analysed with a comparable storage time and storage temperature in order to ensure that issues relating to time-dependent degradation of cfDNA could be avoided 34. It is evident that any future application of such analysis will depend upon the reproducibility and reliability of results, both of which require the optimisation and equivalence of various pre-analytical and analytical factors.
In conclusion, small sample size was a limitation of the present study; however, we feel that the results are promising enough to encourage further research into this aspect of cancer therapeutics. The present study shows that monitoring of cfDNA levels during the course of cytotoxic therapy can predict an early response to therapy and P. There is only limited information available regarding the predictive value of cfDNA in NSCLC patients. Thus more external, multicentric and large-scale prospective validation studies are required in order to confirm the relevance of the current findings for the early estimation of response to therapy and prognosis. Additionally, identification of additional more-specific and more-sensitive serum- or plasma-based biomarkers, which can be used in combination with cfDNA, will further improve the diagnostic power of current imaging tools for indicating early therapeutic efficacy. Such analysis may also have potential in monitoring tumour recurrence and as intermediate end-points of efficacy in chemoprevention and therapeutic trials. Such analysis may also be used in present clinical practice, where efforts are made to treat patients based on their epidermal growth factor receptor mutation status 35 or during second- and third-line treatment in advanced NSCLC with the drugs doxetaxel, pemetrexed or erlotinib 36. It will be interesting to see how cfDNA performs in this new therapeutic setting.
Footnotes
Support Statement
This study was funded by the Indian Council for Medical Research (New Delhi, India). S. Kumar is in receipt of a Council of Scientific and Industrial Research (New Delhi, India) Senior Research Fellowship.
Statement Of Interest
None declared.
- Received November 25, 2009.
- Accepted February 5, 2010.
- ©2010 ERS


