


Abstract
Patients with less severe obstructive sleep apnoea (OSA) are usually prescribed oral appliances and/or smaller optimal nasal continuous positive airway pressure (PnCPAP) in nCPAP therapy. We hypothesised that OSA patients with greater PnCPAP would not respond favourably to oral appliances.
Oral appliances were inserted in nCPAP users after washing-out the nCPAP effect. Follow-up polysomnography was undertaken with the adjusted oral appliance in place. The predictability of PnCPAP was evaluated with receiver-operating characteristic (ROC) curves.
The median baseline apnoea/hypopnoea index (AHI) was reduced with the oral appliance from 36 to 12 events·h−1 in 35 patients. When responders were defined as patients showing a follow-up AHI of <5 events·h−1 with >50% reduction in baseline AHI, the area under the ROC curve for PnCPAP was 0.76. The best cut-off value of PnCPAP turned out to be 10.5 cmH2O with a high negative predictive value (0.93) and a low negative likelihood ratio (0.18).
OSA patients with a PnCPAP of >10.5 cmH2O are unlikely to respond to oral appliance therapy. This prediction is clinically helpful to both OSA patients and medical personnel in discussing oral appliances as a temporary substitute and/or alternative for nCPAP.
- Obstructive sleep apnoea
- optimal nasal continuous positive airway pressure
- oral appliance
- substitute therapy for nasal continuous positive airway pressure
Nasal continuous positive airway pressure (nCPAP) patients with obstructive sleep apnoea (OSA) may be exposed to mentally as well as physically frustrating conditions when their nCPAP use is frequently interrupted for some reason (e.g. minor side-effects, difficulty to transport, requirement of power supply, etc.). Even though those individuals are compliant in the daily use of nCPAP, a more portable substitute and/or alternative would therefore be attractive. The great merits of oral appliances over nCPAP are the increased compliance, simplicity and inexpensiveness 1. In addition, patients prefer oral appliances to nCPAP when both treatments are effective 1. However, practical information regarding treatment outcomes of oral appliances is required in light of the lower efficacious nature of oral appliances compared with nCPAP 1, 2. The beneficial effects on respiratory events obtained by nCPAP should not vary greatly by switching over to the use of an oral appliance from nCPAP, especially when adjunct use of an oral appliance in addition to nCPAP is considered. Moreover, prediction of oral appliance treatment outcome also has merit when discussing the cost-effectiveness of oral appliance use prior to treatment.
Clinically, the manually titrated optimal pressure of nCPAP (PnCPAP) tends to be greater in patients with more severe OSA undergoing nCPAP therapy 3. This suggests that oral appliances could not be recommended for such patients because there would be a high likelihood of treatment failure since the oral appliance is mostly indicated for less severe OSA. In the present study, the authors aimed to assess the interaction between PnCPAP and the outcome of oral appliance therapy. We hypothesised that the oral appliance treatment effect could be predicted by focusing on PnCPAP. In other words, OSA patients who were prescribed a greater PnCPAP were unlikely to respond to oral appliances. Clinical implications of the findings will be discussed later.
MATERIAL AND METHODS
Patients
The study protocol was approved by the Ethics Committee for Human Research at the Neuropsychiatric Research Institute in Tokyo, Japan. Inclusion criteria were as follows: male patients who were diagnosed with OSA 4 (apnoea/hypopnoea index (AHI) ≥5·h−1) by clinical interviews and initial overnight polysomnography (PSG) undertaken within 2 yrs at the multidisciplinary clinic for sleep disorders; who completed the nCPAP titration to determine PnCPAP; and who had been using nCPAP for at least 3 months with an average compliance of >4 h per night 5. Patients who met one or more of the following exclusion criteria were excluded: prior otolaryngeal surgery; cardiovascular disease; medically complicated; medically unstable; severe periodontitis 6; insufficient number of teeth; denture user; or temporomandibular joint dysfunction. Figure 1⇓ shows a flowchart of patient recruitment. Of the 409 nCPAP patients eligible for the study, 61 were randomly selected with the use of a Microsoft® Excel-based function (RANDBETWEEN) by the clinical research coordinator. Since one patient moved away and nine patients were excluded due to medical conditions, 51 nCPAP patients were invited to participate. After detailed study objectives and potential risks were explained to each patient, eight patients refused to enrol and five patients were excluded upon dental examination. Consequently, 38 nCPAP compliers provided written informed consent. Recruitment of eligible patients began in May 2003 and was completed by March 2005.

Study flow diagram. PSG: polysomnography; OSA: obstructive sleep apnoea; AHI: apnoea/hypopnoea index; nCPAP: nasal continuous positive airway pressure; CPAP: continuous positive airway pressure.
Polysomnographic evaluation and nCPAP titration
All patients were diagnosed with OSA based on an initial diagnostic PSG following standard parameters 4, 7, 8. A second PSG to determine PnCPAP was undertaken within 2 weeks of the OSA diagnosis 3. PnCPAP was manually determined by registered polysomnographic technologists and was targeted to abolish respiratory events such as apnoea, hypopnoea and flow limitation 3. Overall, this nCPAP titration yielded a median (interquartile range) follow-up AHI of 3.3 (1.4–5.8)·h−1 in the multidisciplinary clinic.
Oral appliance
A custom-made monobloc mandibular advancement oral appliance made from polyolefin (#501; ASO International Inc., Tokyo, Japan) was inserted for each patient (fig. 2⇓). Such types of oral appliances for OSA treatment are partially reimbursable in Japan: patients normally pay 30% of the total medical care expenses for oral appliance therapy including appliance fabrication. The oral appliances were fabricated on plaster working casts of maxillary and mandibular dental arches and a bite registration. The absolute range of maximal mandibular protrusion in mm was measured with the use of the George Gauge (Great Lakes Orthodontics, Ltd, New York, NY, USA). Following this, construction bite was registered at 50–67% of the maximum mandibular protruded position using the bite fork of the George Gauge and vinyl polysiloxane dental impression material (Exafine; GC, Tokyo, Japan).

A custom-made monobloc mandibular advancement oral appliance.
Study protocol
Soon after obtaining written informed consent, patients were instructed to cease nCPAP use during the 2–3 weeks of oral appliance fabrication. After oral appliance insertion, the patients were advised to stop using the oral appliance until the next visit if temporomandibular joint and/or jaw muscle discomfort occurred. When no such significant problems occurred after the adaptation period (∼4 weeks), the lower part of the appliance was ventrally advanced according to the following process. A new construction bite was registered using the George Gauge at a more advanced mandibular position than the initial one. The upper and lower parts of the appliance were separated and thereafter reattached with the use of the plaster casts and the new bite registration at the dental laboratory. This step was repeated a few times, as necessary, until the maximum comfortable limit of mandibular advancement 9 was reached, which took 2–5 months. In addition, we also considered the mandibular position to be titrated when the patient or bed-partner reported a cessation of snoring and resolution of symptoms, leading to no further advancement of the appliance 10. A third PSG was undertaken with the adjusted oral appliance in place after confirming that the patient felt the final mandibular position was comfortable 6.
Treatment outcome
We defined responders as patients showing a reduction in AHI to <5·h−1 in addition to a >50% reduction in baseline AHI (criterion 1), partially referred to by previous reports 11, 12. The additional criterion that a follow-up AHI <10·h−1 with >50% reduction in baseline AHI (criterion 2) and a >50% reduction in baseline AHI (criterion 3) were also used for literature comparison purposes.
Statistical analysis
All statistical and receiver operating characteristic (ROC) analyses were computed using SPSS (version 11.5, SPSS Japan, Inc., Tokyo) unless otherwise stated. The normality of data distribution was assessed using the Kolmogorov–Smirnov test. A Wilcoxon's signed rank sum test was obtained to compare the differences in each variable between the first and third PSG values. Mann–Whitney's U-tests were used to compare the PSG variables between responders and nonresponders. ROC curves 13–15 were plotted and the mean±se estimated area under the curve (AUC) for PnCPAP was calculated for each responder criterion. When the slope of the tangent line of the ROC curve was statistically equal to 1 (i.e. AUC = 0.5), computed by the SPSS software, the ROC curve was regarded as inaccurate for prediction. The best cut-off value of PnCPAP for each criterion was determined on the basis of sensitivity, specificity and positive likelihood ratio (LR+) and negative likelihood ratio (LR-) 15. Positive and negative predictive values were also assessed. A univariate logistic regression followed by a multivariate logistic regression analysis was performed in order to investigate additional contributions to the likelihood of treatment success based on criteria 1, 2, and 3 by incorporating age, body mass index (BMI), baseline AHI, nadir arterial oxygen desaturation (Sa,O2) on the diagnostic PSG, and PnCPAP (version 5.0, Stat View, SAS Institute, Inc., Cary, NC, USA). A p-value of <0.05 was considered to indicate statistical significance.
Finally, the power analysis and sample size calculation were completed so that the results could be properly interpreted 16, 17. The power calculated on the basis of the effective size was 0.81 at criterion 1, 0.87 at criterion 2, and 0.76 at criterion 3, respectively (see online supplementary material). Since these power values revealed that the total sample size for this study was acceptable, it was considered that further recruitment of patients was not necessary.
RESULTS
Out of a total of 38 patients who provided written informed consent, 35 patients completed the protocol (fig. 1⇑). All subjects had used nCPAP for an average of 9 (6–13) months before the present study began. The baseline median (interquartile range) age and BMI of the 35 male patients were 55 (41–66) yrs and 26 (24–29) kg·m−2, respectively (see online supplementary material). The baseline AHI at the initial diagnostic PSG was 37 (24–60)·h−1. PnCPAP was determined to be 9 (7–13) cmH2O at the second overnight PSG study. There was a significant correlation between baseline AHI and PnCPAP (r = 0.49, p = 0.003 Spearman's rank correlation). In turn, the follow-up AHI (12 (5–26)·h−1, p<0.001) was significantly lower with the oral appliance in place compared to baseline. The nadir Sa,O2 also improved significantly (80 (71–84) to 86 (81–89)%, p<0.001). There were no significant changes in BMI throughout the study.
The 35 patients were divided into responders and nonresponders according to criteria 1–3. The effects of oral appliance therapy on respiratory variables in the two groups are summarised in table 1⇓. The treatment success rate was 29% based on criterion 1 whereas the success rate increased to 63% for criterion 3. At criterion 1, there was no significant difference in age (p = 0.798) or BMI (p = 0.547) between responders and nonresponders. Notably, PnCPAP was significantly smaller in responders than in nonresponders (p = 0.017). The baseline AHI was significantly lower with the oral appliance in place, both in responders (p = 0.005) and in nonresponders (p = 0.012), whereas the nadir Sa,O2 significantly increased in both responders (p<0.001) and nonresponders (p = 0.002). In addition, there was a significant difference in the baseline (p = 0.049) and follow-up AHI (p<0.001) between responders and nonresponders. Similar observations were also seen with criteria 2 and 3, although the values were slightly different.
Patient characteristics and effects of oral appliances on objective variables
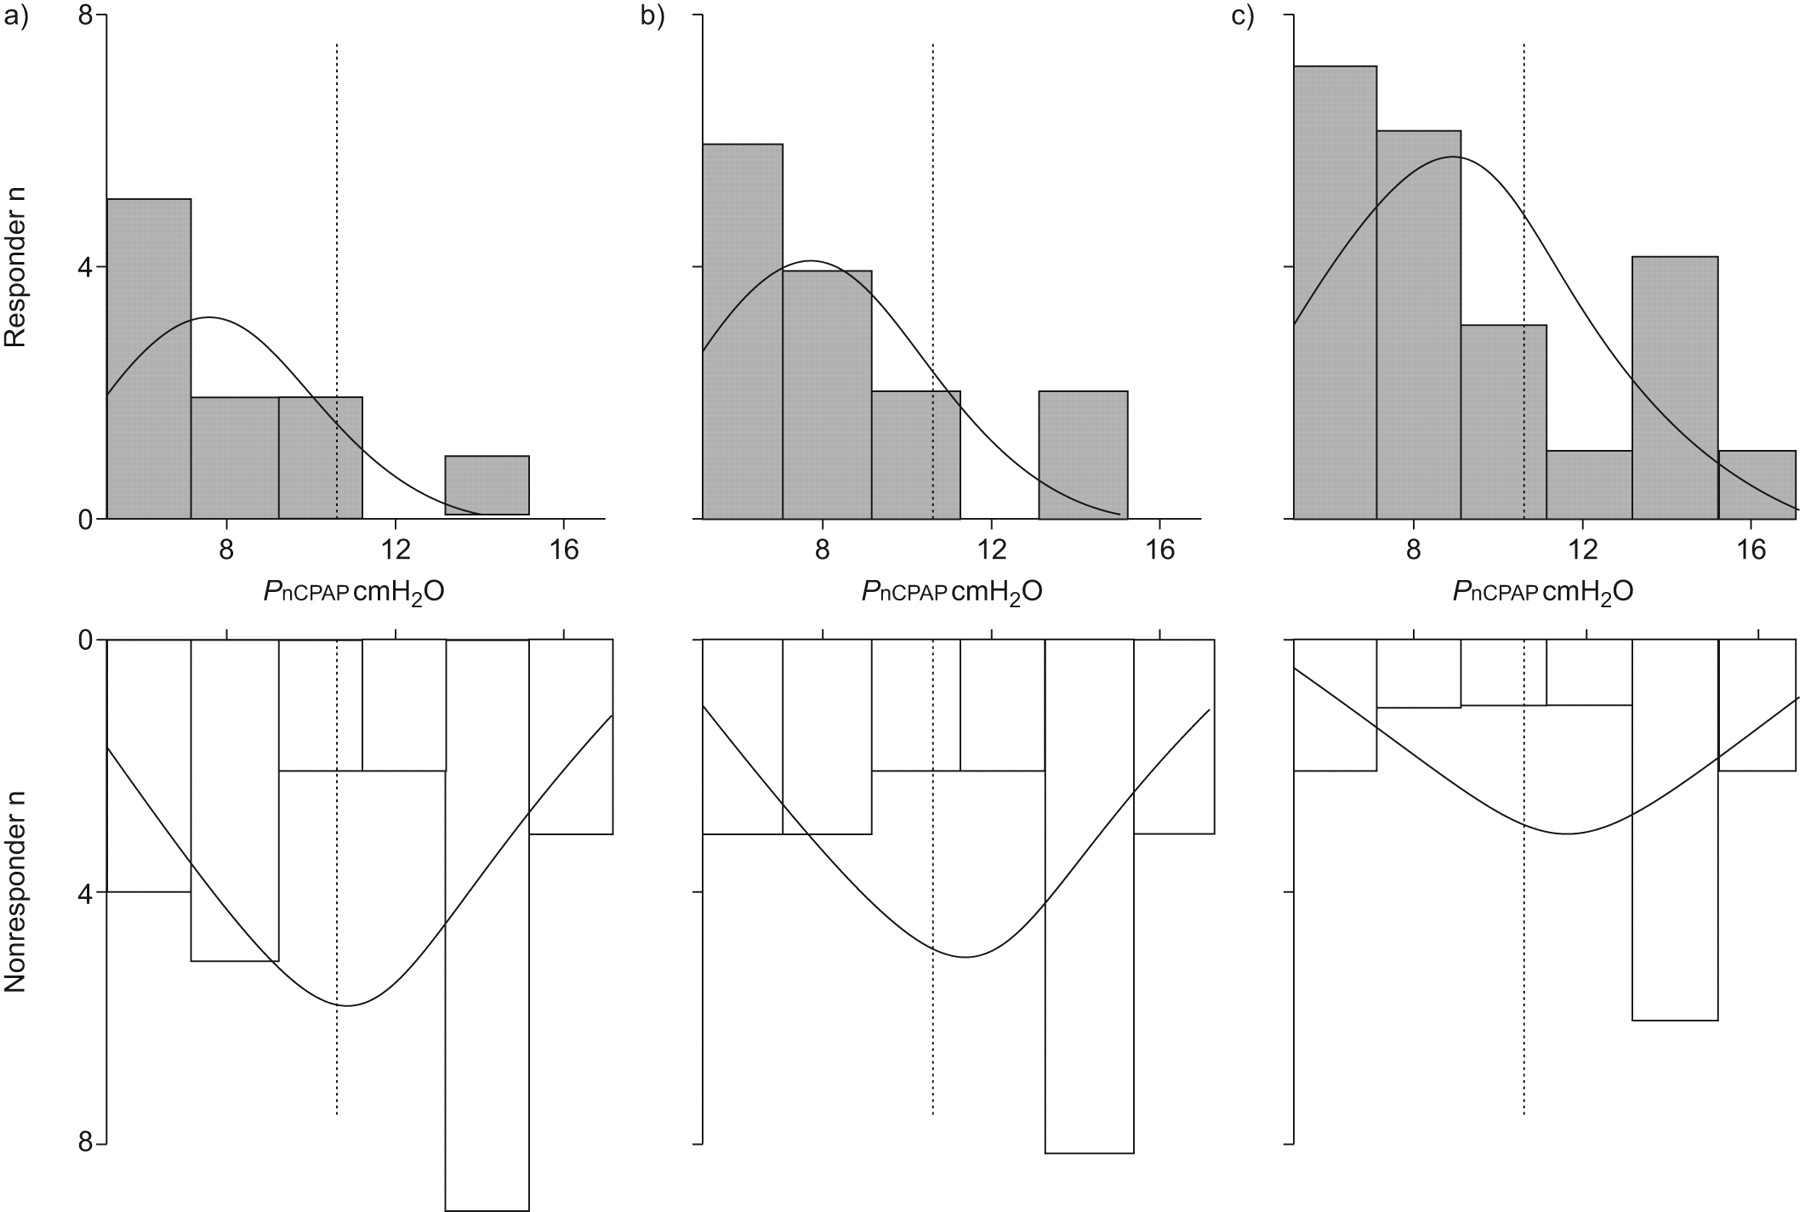
Figure 3⇓ represents histograms showing the PnCPAP distribution at three different criteria. For each criterion, it was shown that the responders' distribution was skewed to the right (i.e. the right tail is long relative to the left tail).

Distributions of optimal continuous positive airway pressure (PnCPAP) for responders and nonresponders. Note that normal curves were drawn by SPSS software and the best cut-off lines were superimposed on the distributions (see details in the text). a) Criterion 1: a reduction in apnoea/hypopnoea index (AHI) to <5 events·h−1 and a >50% reduction in baseline AHI (sensitivity (ST)/specificity (SP) = 90/56), b) criterion 2: a reduction in AHI to <10 events·h−1 and a >50% reduction in baseline AHI (ST/SP = 86/62), and c) criterion 3: a >50% reduction in baseline AHI (ST/SP = 73/69). ·······: 10.5 cmH2O.
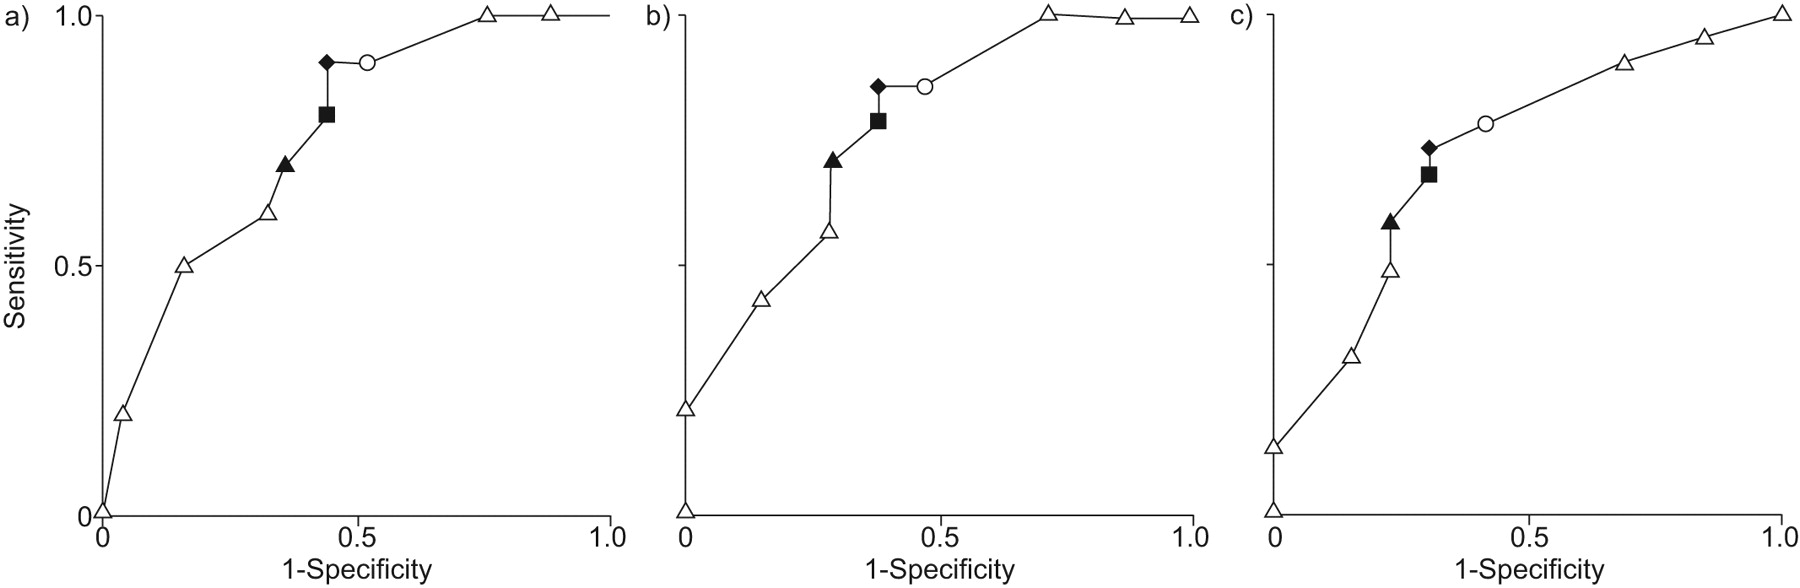
Figure 4⇓ provides the ROC curves for PnCPAP at different responder criteria, and table 2⇓ summarises the relationship between the criteria and predictive variables. The estimated AUC was 0.76 (0.08) (p = 0.02) for the entire study cohort at criterion 1. The optimal cut-off value of PnCPAP was 10.5 cmH2O, yielding sensitivity/specificity and LR+/LR- of 90/56 and 2.05/0.18, respectively. Notably, this cut-off value yielded a high negative predictive value of 93. Similar AUCs were also obtained at criteria 2 (AUC = 0.78 (0.09), p<0.001) and 3 (AUC = 0.73 (0.09), p = 0.03). The best combination of sensitivity/specificity and LR+/LR- for criterion 2 was 86/62 and 2.25/0.23 when PnCPAP was set at 10.5 cmH2O. At criterion 3, the best combination of sensitivity/specificity was 73/69, whereas LR+/LR- was 2.36/0.39 when PnCPAP was set at 10.5 cmH2O.
Receiver-operating characteristic curves for optimal continuous positive airway pressure (PnCPAP). a) Criterion 1: a reduction in apnoea/hypopnoea (AHI) to <5 events·h−1 and a >50% reduction in baseline AHI (area under curve (AUC) = 0.76); b) criterion 2: follow-up AHI <10 events·h−1 and a >50% reduction in baseline AHI (AUC = 0.78); and c) criterion 3: reduction in AHI >50% (AUC = 0.73). ▴: PnCPAP = 8.5 cmH2O; ▪: 9.5 cmH2O; ♦: 10.5 cmH2O; ○: 12.0 cmH2O.
Prediction of oral appliance treatment outcome by various cut-off thresholds of optimal continuous positive airway pressure ( = 0.78)
Finally, univariate logistic regression analyses revealed that treatment success of oral appliance therapy was significantly associated with PnCPAP at criterion 1 (OR (95% CI) 0.73 (0.55–0.97), p = 0.03), at criterion 2 (0.72 (0.56–0.93), p = 0.01), and at criterion 3 (0.77 (0.62–0.97), p = 0.02) (table 3⇓). No significant observation was found either in PnCPAP (0.80 (0.61–1.06), p = 0.12) or baseline AHI (0.96 (0.92–1.02), p = 0.14) at criterion 2 when multiple logistic regression analyses were additionally applied.
Logistic regression results for factors associated with oral appliance treatment success
DISCUSSION
To our knowledge, this is the first study to demonstrate the interaction between PnCPAP and the outcome of oral appliance therapy for OSA. We found that OSA patients with greater PnCPAP were unlikely to respond to oral appliances. This result was also supported by the univariate logistic regression analyses that indicated the greater the PnCPAP, the lower the treatment success rate with an oral appliance (table 3⇑). Moreover, PnCPAP was determined to be a predictor of a “poor response” to oral appliance therapy with a high negative predictive value (0.93) and a low negative likelihood ratio (0.18) when the cut-off value was set at 10.5 cmH2O. Our data could contribute to establishing a practical comprehensive treatment plan for OSA patients using nCPAP and oral appliances.
The overall fair accuracy 13 of PnCPAP for prediction (as measured by the estimated AUC ranging from 0.73 to 0.78) may reflect a certain physiological background that supports the hypothesis. The key to successful oral appliance therapy is consistency between the site of upper airway occlusion during sleep and the mechanical action of the appliance. A number of reports have suggested that OSA patients show both a single site of upper airway narrowing at the velopharynx and multilevel upper airway collapse during sleep 18–23. If the site of occlusion is extended to below the level of the velopharynx (i.e. oropharynx and hypopharynx), pharyngeal pressure becomes more negative and OSA worsens 20, possibly resulting in an increase in PnCPAP. This increase in PnCPAP could be explained as follows. Structurally, the human upper airway is assumed to be a simple cylindrical tube. In the tube, airflow dynamics can be influenced by a change in the tube radius and longitudinal tube length, since the flow rate (volume of airflow per unit time; Q) through the tube is proportional to the difference between the upstream and downstream pressures (Δp) in the tube as well as the fourth power of its radius (r) (Poiseuille's law) 24. Q and Δp are proportional to each other, similar to current and voltage in Ohm's law. Thus, it is convenient to write the resistance (R) in a form analogous to Ohm's law: R = Δp/Q = 8 μL·πr−4, where μ is constant and L is the tube length. This indicates that the resistance of the tube increases on the condition that the length of the tube becomes longer whereas the tube radius becomes smaller. Accordingly, since an extension in the length of the obstructed site results in increasing the upper airway resistance, it would be reasonable to speculate that PnCPAP is likely to increase when the site of occlusion is extended to below the level of the velopharynx. Since mandibular advancement acts to enlarge predominantly the velopharynx rather than other levels in both the asleep and passive pharynx 22, 25, we can also speculate that oral appliances are not generally efficacious for patients with greater PnCPAP, most of whom present with multiple sites of occlusion including the velopharynx 20.
The authors chose to apply a robust definition of treatment success to determine the conditions under which oral appliances can maintain short-term effects similar to nCPAP on OSA symptoms and severity. This selection also has merit particularly in terms of maintenance of favourable long-term effects on cardiovascular outcome when the patients succeed in switching over to oral appliance therapy from using nCPAP. The use of such stringent criteria, however, resulted in an overall lower positive predictive value (ranging from 42 to 45), probably due to the small number of true positives relative to false positives in our study. We speculate that the success rate and positive predictive value could be partially improved through the selection of less severe OSA patients as well as by changing the criteria from stringent to liberal. Although the success rate of our study (29%, see table 1⇑) was apparently lower than a recent study 12 (60%) where the treatment success was also defined to be criterion 1 as in our study, the baseline AHI was much higher in ours (median AHI = 36) than the recent report 12 (mean AHI = 13). Considering that baseline AHI value was also a predictor of oral appliance response as long as criterion 1 (AUC = 0.72 (0.11), p = 0.049) and criterion 2 (AUC = 0.77 (0.09), p = 0.007) were selected in the present study (data not shown), patients with smaller PnCPAP in conjunction with lower baseline AHI may be able to accomplish a robust response such as a follow-up AHI <5. The result from the univariate logistic regression analyses at criterion 1 may also support this speculation.
The authors acknowledge that our results must be interpreted with great caution because of a number of significant concerns and limitations to this study. We recognise that the number of analysed study samples appears rather small when the total pool of potentially eligible patients is considered (fig. 1⇑). However, we speculate that the possibility to generalise is maintained by the following reasons (see online supplememtary material). First, patient selection was performed with the use of the RANDBETWEEN function that is available in Microsoft® Excel. Secondly, we compared some diagnostic variables between the subjects whose data were analysed (i.e. n = 35) and the eligible patients who were not selected for analyses in the study (i.e. n = 407-35 = 372) 26 (data shown in table 1⇑ of the online supplementary material). Statistical significance was not observed in four variables including PnCPAP but in terms of age between the two populations. However, age did not appear to effect the results because there was no significant age difference between responders and nonresponders (table 1⇑) and also because age per se did not contribute to the likelihood of treatment success with oral appliance (table 3⇑).
Our method cannot become mainstream in the prediction of oral appliance treatment outcomes since the approach is not only cumbersome for clinical use but also the results are merely available in nCPAP compliers whose PnCPAP is determined manually. Whether the proposed cut-off value of PnCPAP is applicable for nCPAP failures is still to be investigated. Although the median (interquartile range) duration of nCPAP use was 9 (6–13) months in the present study, long-term effects of nCPAP use on the severity of OSA and PnCPAP are unknown. We speculate that age-related worsening of OSA in general might occur even though OSA would be well controlled. This influence would result in underestimating the PnCPAP necessary for treatment success of oral appliance therapy within one subject. A future study performed in nCPAP naive patients would be needed to ideally evaluate the predictability of PnCPAP. Since the results were obtained from Japanese male nCPAP compliers who were relatively nonobese compared with Caucasian OSA patients, they are not applicable to the diverse OSA population. A skewed distribution of PnCPAP to the right in responders (fig. 3⇑) could provide an advantageous effect to obtain a better sensitivity and specificity. Such a distribution might be derived from the nature of PnCPAP. The contribution of BMI to PnCPAP appears to be small in our study. There was no difference in BMI between responders and nonresponders at each criterion. Moreover, the additional ROC curves for BMI were not sufficient to predict the outcome of the therapy (AUCs: 0.57–0.64; not significant, detailed data not shown), although higher BMI is a factor that increases baseline AHI and PnCPAP 27, 28. The relatively lower BMI (26 (23–29) kg·m−2) of our Japanese sample reminds us of craniofacial effects (e.g. smaller mandible) 29, which we did not evaluate in this study. The results may also vary due to sex and age differences 30. A future study using titratable oral appliances may provide better results leading to maximising oral appliance efficacy 6, 10, 11. Gradual forward and/or backward titration of the mandible without fabricating a new appliance is especially necessary when the initial jaw position proves inadequate 31. The use of such an appliance would certainly result in saving time during titration. Whether fabricating a titratable oral appliance or monobloc appliance with subsequent multiple remaking is least inexpensive remains unknown since the cost for appliance fabrication differs between countries and dental laboratories.
There are some clinical implications to this study. Currently, practical information regarding treatment outcomes of oral appliance therapy is required from the viewpoint of patients. Patients ultimately choose the therapy in light of cost-effectiveness as well as the risk–benefit ratio. Simple and less expensive methods of prediction (e.g. flow–volume curves 9, nasal resistance measurement 32, etc.) are therefore appealing in parallel with laborious approaches (e.g. titration of mandibular position during sleep 33, 34). Of particular interest seems to be sleep nasoendoscopy 35–37 and upper airway modelling in vitro 38, 39, both of which could provide another aspect over conventional prediction for the success of oral appliance therapy. Our preliminary results may be helpful to nCPAP users as well as dentists and sleep physicians when discussing the use of an oral appliance as an alternative and/or temporary substitute for nCPAP. In addition, our prediction has another advantage in that it could raise the treatment success rate of oral appliance therapy by excluding possible nonresponders.
In conclusion, nCPAP patients with a greater PnCPAP are unlikely to respond to oral appliance therapy. This simple prediction could be widely applicable from academic centres to satellite practices after the effectiveness is further re-evaluated.
Support statement
Part of the present study was supported by Grants-in-Aid for Scientific Research (20592422, 21406033) from the Japanese Society for the Promotion of Science awarded to S. Tsuiki.
Statement of interest
None declared.
Acknowledgments
The authors are indebted to J.P. Barron of the Dept of International Medical Communications of Tokyo Medical University for his review of this manuscript. We thank Y. Yamashiro, Ota General Hospital, and H. Nakayama, Niigata University, for their critical comments. We also appreciate constructive comments from S. Isono, Chiba University. Finally, the authors are grateful to I. Ellis for her editorial assistance in the final preparation of this manuscript.
Footnotes
-
This article has supplementary material accessible from www.erj.ersjournals.com
- Received August 6, 2008.
- Accepted September 27, 2009.
- © ERS Journals Ltd
References


