


An ecological analysis of incidence of tuberculosis and per capita gross domestic product
To the Editor:
In 2006, an estimated 9 million new cases of tuberculosis (TB) emerged worldwide 1. Of these, only 1% occurred in the European Union and North America combined, while Africa and South-East Asia contributed >65%. Among the 22 high-burden countries, 17 were in Africa, 16 of which were in the lowest quartile in terms of per capita gross domestic product (GDP). Since 2001, the fight against poverty has been a major theme in the World Health Organization’s (WHO) “Stop TB” strategy. Indeed, poverty “fuels” TB by facilitating transmission through crowded working and living conditions, it may increase the risk of progression to disease through malnutrition, and imposes barriers to accessing health services.
The aim of the present analysis was to explore and illustrate the relationship between the incidence of TB and an indicator of standard of living (per capita GDP) using WHO and World Bank estimates.
The per capita GDP, i.e. total market value of all final goods and services produced within a given country in a given period of time, is often used as an indicator of standard of living. The advantages are that it is measured frequently, widely used and easily accessible information, and that technical definitions for estimating GDP are relatively consistent between countries.
The World Bank publishes yearly estimates of per capita GDP per country 2. Similarly, the WHO provides annual estimates for TB incidence for each country by WHO region 2. Of the 211 WHO member states and 177 countries with reports by the World Bank, there were 171 pairs with information on both GDP and TB. For uniformity of the denominator, United Nations population estimates for 2004 3 were used to obtain per capita figures for GDP and TB, respectively.
The choice of the same denominator permitted a direct regression on the numerators (rather than on rates), using population size as a weight. Linear regression on the logarithm of both TB (2004) and GDP (2005) was chosen as the intuitively simplest model. Both unweighted (not shown) and weighted regression gave similar results (fig. 1⇓).
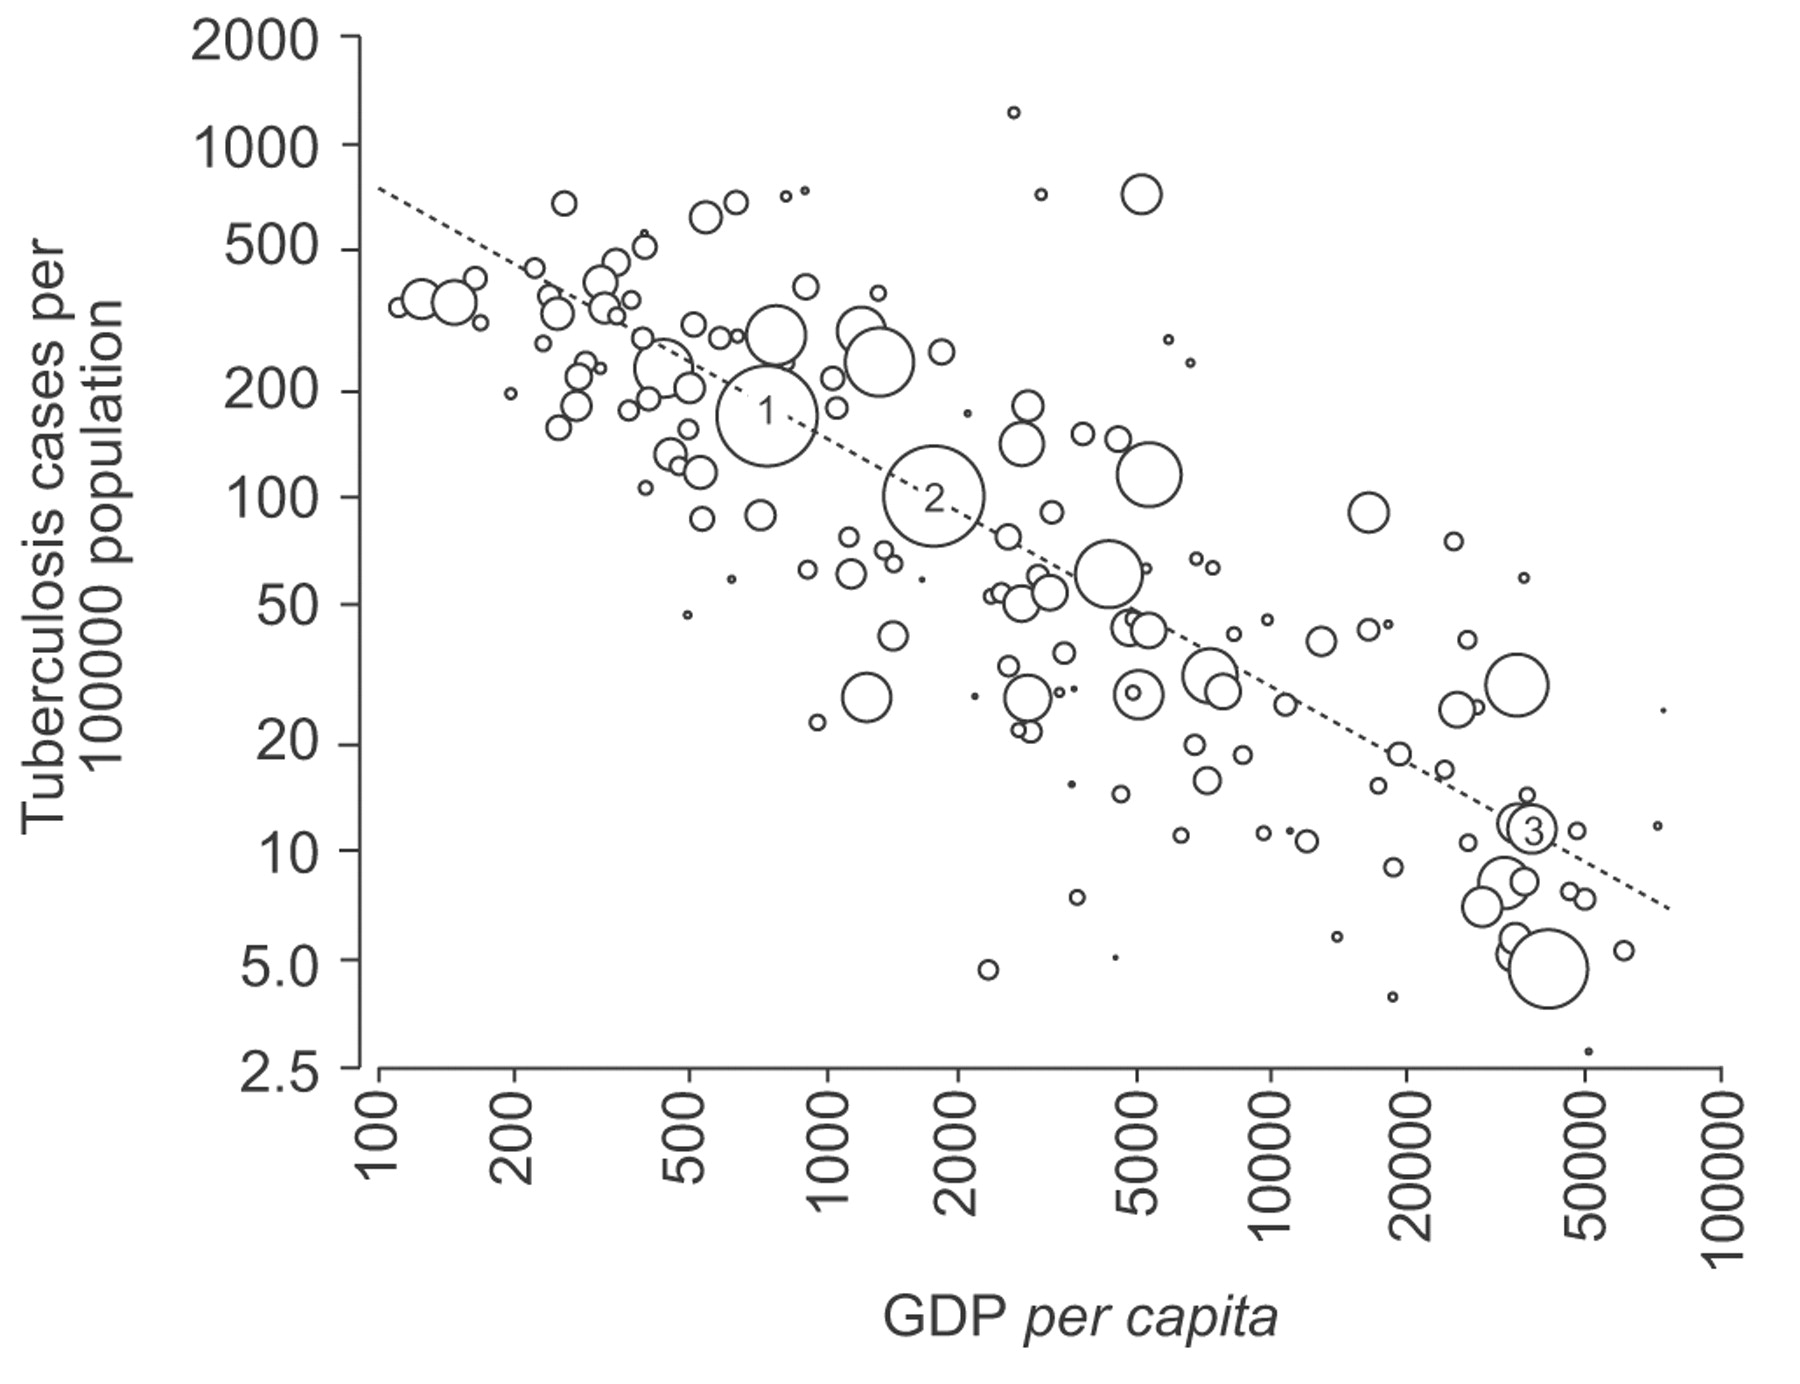
Relationship between per capita gross domestic product (GDP; Wold Bank data, 2005) and incidence of tuberculosis per 100,000 population. For graphical presentation, the third root of the population (millions) divided by 10 was used to determine the size of the symbols. This arbitrary choice provides a visual appreciation that large sized populations do not bear an excessive weight at the extremes of the axes, but are rather distributed across the entire scale. Both abscissa and ordinate were drawn logarithmically. 1; India; 2: China; 3: UK.
To visually convey the lack of influence of population size in figure 1⇑, the size of the circles representing individual countries was varied according to an arbitrarily chosen factor, as directly proportional graphical representation would have resulted in gross visual distortion. Examples for the correlation between GDP and TB are shown in figure 1⇑ for India, China and the UK. The regression analysis suggests that each doubling of GDP was associated with a 38.5% decrease in the incidence of TB. For instance, the ratio of per capita GDP between India and China is ∼2.3 and the incidence of TB is 40% lower in China than in India.
As the unit of measurement is a country, this ecological analysis does not allow a conclusion to be reached for individuals. Furthermore, the analysis was not adjusted for HIV infection, largely because estimates of HIV infection are incomplete for many countries. Nevertheless, the take-home message is clear and emphasises a major thrust of the World Health Organization’s strategy: to stop tuberculosis, we must fight poverty.
Statement of interest
None declared.
- © ERS Journals Ltd