


Figures
- Fig. 1—
Lactate dehydrogenase (LDH) release in precision-cut lung slices (PCLS). PCLS were cultured for 72 h in minimum essential medium with (□; n = 4) or without (▒; n = 4) medium change every 24 h. **: p<0.01, two-sided t-test. Data are presented as mean±se as percentage of initial area.
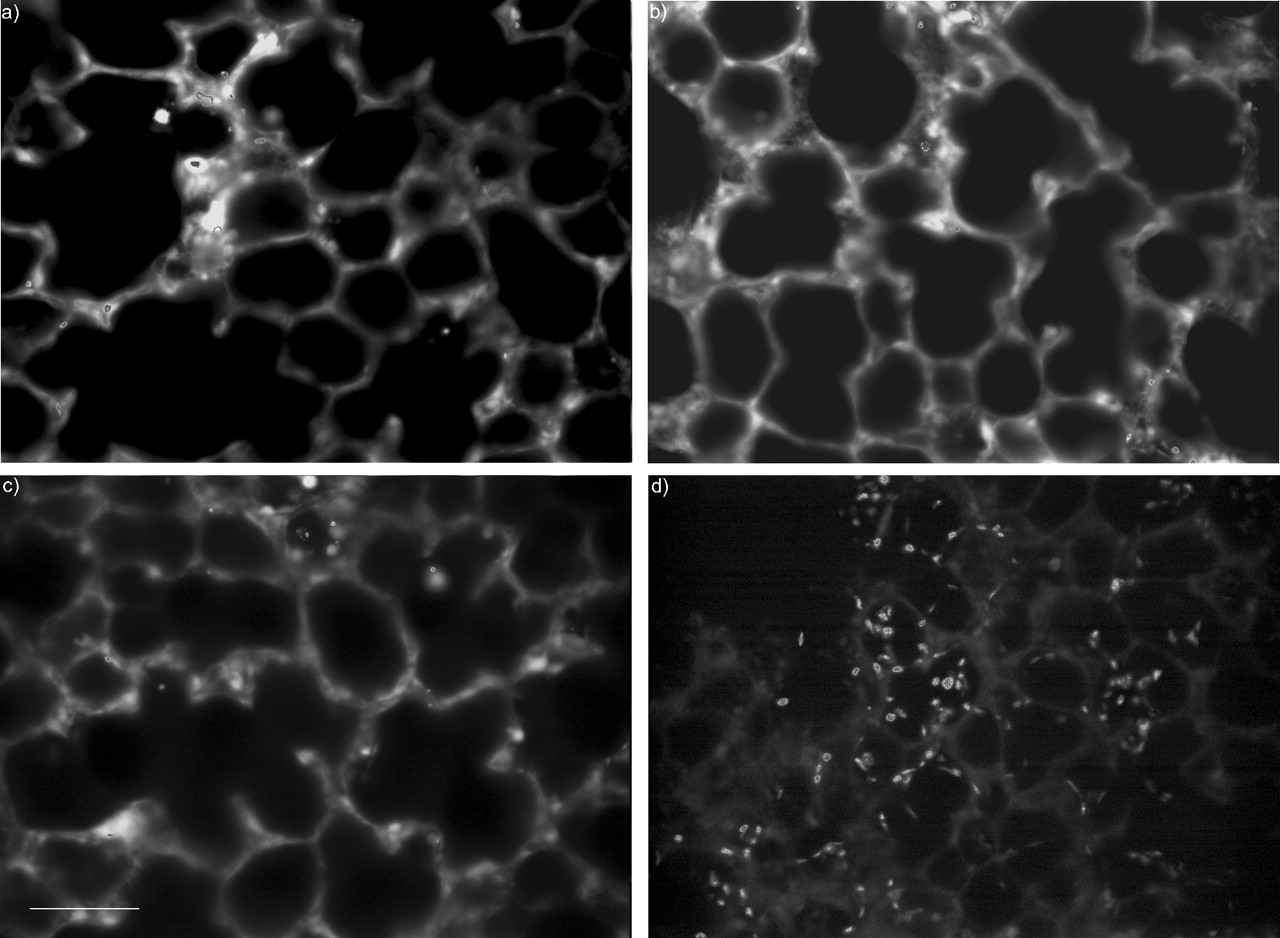
- Fig. 2—
Two-photon microscopic image of guinea pig precision-cut lung slices (PCLS) stained with calcein acetomethylester (AM) and ethidium homodimer (EthD-1). A 220-µm-thick PCLS was loaded with 5 µM calcein AM/10 µM EthD-1 for 40 min and excited at 800 nm with a femtosecond laser. The images show overlay frames (cytoplasm and nuclei). Emission was selected by 500/50 and 625/50 filters for calcein AM and EthD-1, respectively. Viable PCLS at a) 24 h, b) 48 h, and c) 72 h. d) A PCLS pre-treated with 1% Triton X-100 for 20 min followed by LIVE/DEAD® staining. The percentages of nuclei in a, b and c compared to d were 8.6, 4.9 and 5.5%, respectively. Scale bar = 80µm.
- Fig. 3—
Bronchoconstriction in guinea pig (•) and human (▪) precision-cut lung slices induced by different mediators. Concentration–response curves for a) serotonin (•: n = 13, median effective concentration (EC50) = 69 nM; ▪: n = 4, not responsive), b) histamine (•: n = 4, EC50 = 217 nM; ▪: n = 5, EC50 = 2.7 µM), c) leukotriene D4 (•: n = 9, EC50 = 1.8 nM; ▪: n = 5, EC50 = 5.0 nM), d) U46619. (•: n = 4, EC50 = 16 nM; ▪: n = 5, EC50 = 1.3 nM), and e) methacholine (•: n = 6, EC50 = 231 nM; ▪: n = 5, EC50 = 234 nM,). The airway generation used for the measurement was 5 to 8 for the guinea pig and 12 to 16 for human lungs. Data are presented as mean±se as percentage of initial area.
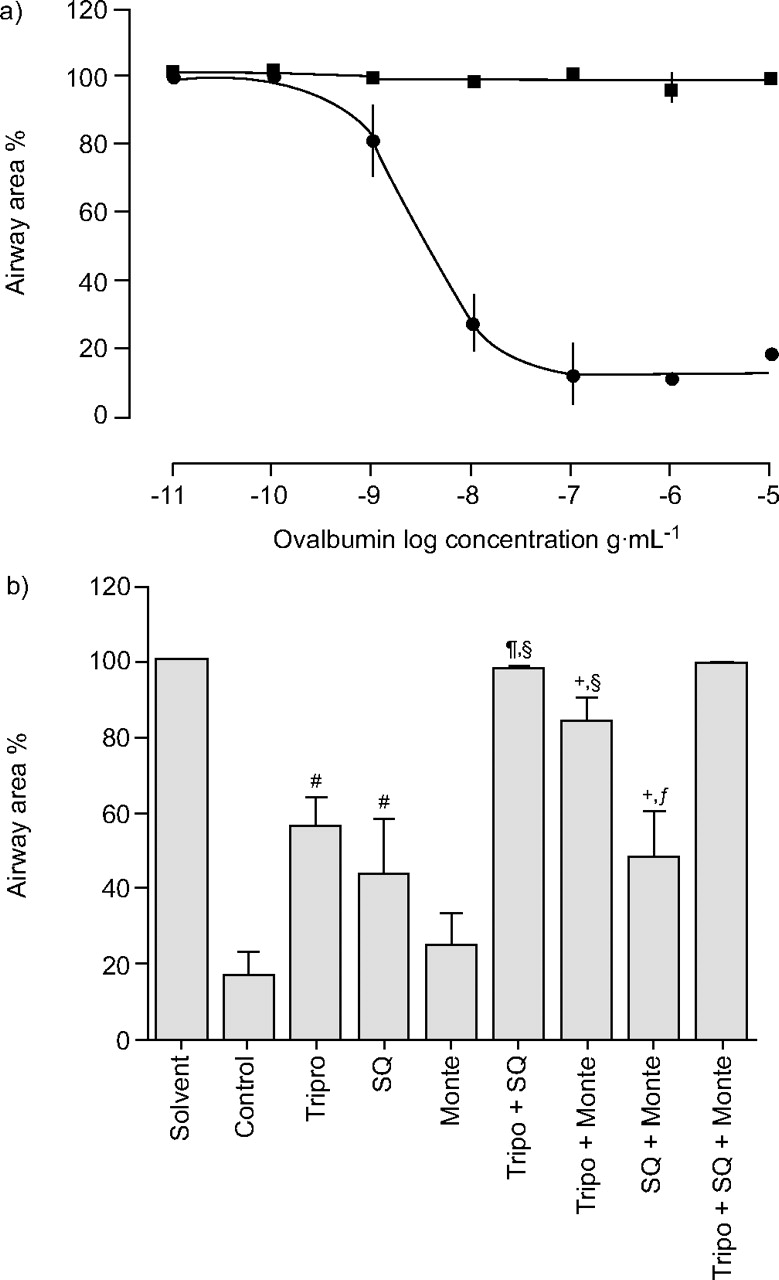
- Fig. 4—
Ovalbumin-induced bronchoconstriction in sensitised guinea pig (GP) precision-cut lung slices (PCLS). a) Cumulative concentration–response curve in passive sensitised (•) and nonsensitised (▪) PCLS with a median effective concentration of 3.8 ng·mL-1. Similar results were obtained if each ovalbumin concentration was tested in a separate slice (data not shown). b) Pharmacological inhibition of allergen-induced bronchoconstriction. The effects of receptor antagonists for the histamine-1 receptor (5 µM triprolidine; Tripro), the thromboxane-prostanoid receptor (10 µM SQ29845; SQ) and the cysteinyl leukotriene-1 receptor (10 µM montelukast; Monte) alone or in combination are shown. The data were analysed by mixed model analysis with inhibitors as fixed factors and subjects (GPs) as random factor; subsequently individual contrasts were calculated and corrected by the false discovery rate procedure. #: p<0.01 versus solvent control; ¶: p<0.01 versus SQ; +: p<0.01 versus Monte; §: p<0.01 versus Tripro; ƒ: p<0.01 versus all three inhibitors. Data are presented as mean±se. The number of independent experiments was as follows: control n = 12; Tripro n = 8; SQ n = 8; Monte n = 5; Tripro + SQ n = 4; Tripro + Monte n = 5; SQ + Monte n = 5; Tripro + SQ + Monte n = 3.
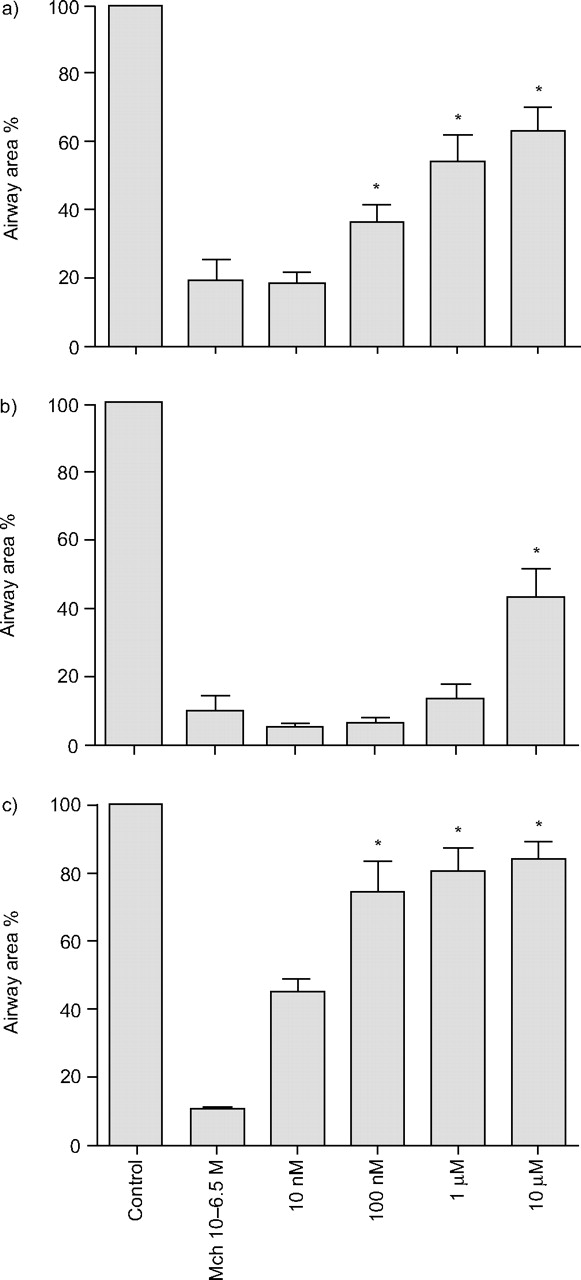
- Fig. 5—
Relaxation of pre-contracted airways. Methacholine (MCh)-induced (316 nM) airway contraction was reversed by a) salbutamol (n = 6), b) 3-isobutyl-1-methylxanthine (n = 6), and c) a combination of the two (n = 4). Data are presented as mean±se as percentage of initial area. *: p<0.05 versus methacholine alone.
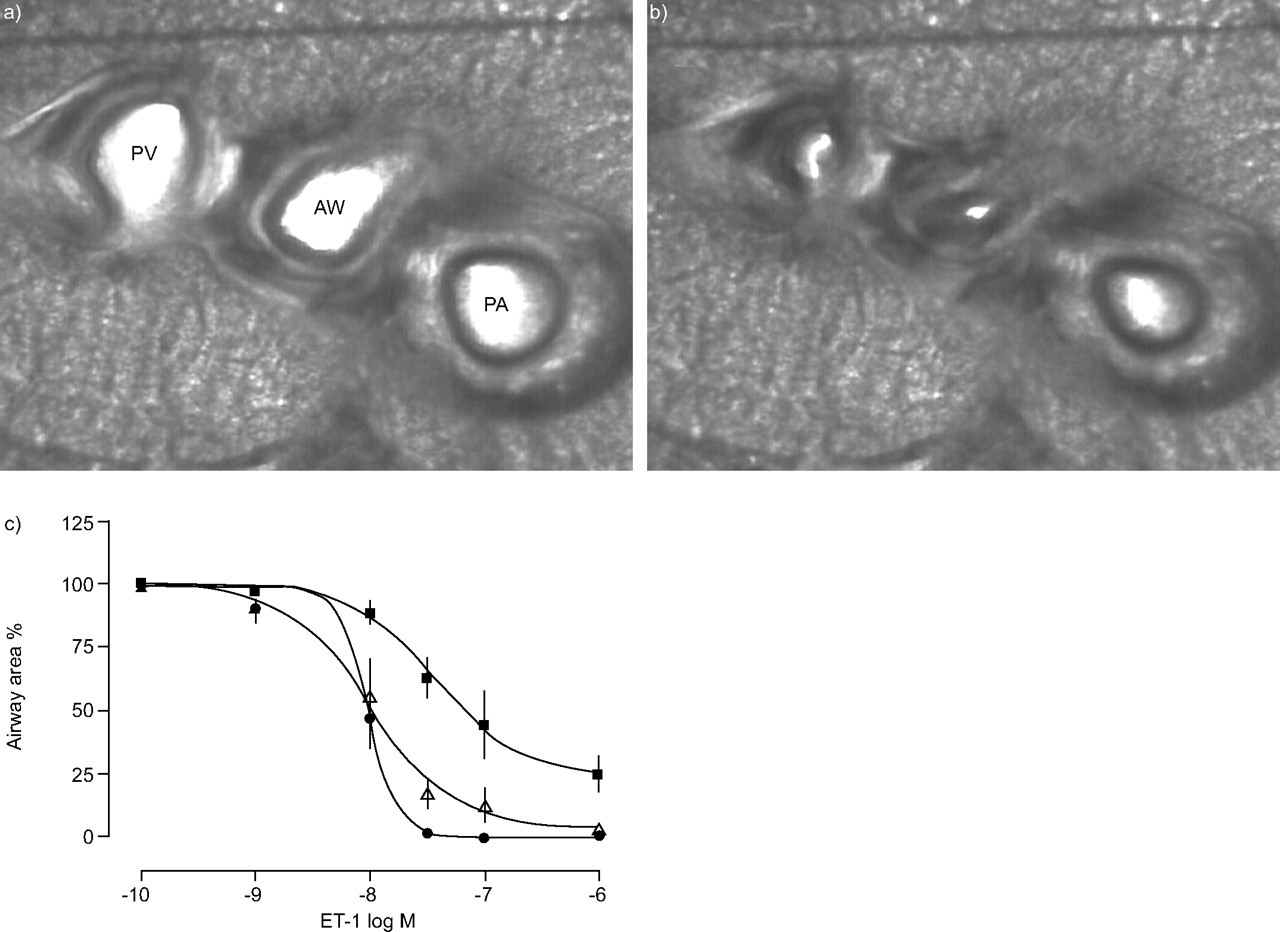
- Fig. 6—
Endothelin (ET)-1-induced contraction of airways and vessels. Microscopic images of a precision-cut lung slice (PCLS) a) before and b) after exposure to ET-1. AW: airway; PA: pulmonary artery; PV: pulmonary vein. c) Concentration–response curves of ET-1 (0.1–1 µM) showing contraction of airways (•, n = 4, median effective concentration (EC50) = 9.6 nM), pulmonary arteries (▪, n = 5, EC50 = 37 nM) and pulmonary vein (▵, n = 5, EC50 = 10 nM) measured in the same slice. For each concentration, a new PCLS was used. Data are presented as mean±se as percentage of original area.


Tables
- Table 1—
Median effective concentrations(EC50) for agonist-induced airway contractions in different in vitro models
Agent PCLS GP pD50 PCLS GP EC50 nM PCLS human pD50 PCLS human EC50 nM LTD4 8.7±0.10 1.8 8.3±0.10 5.0 U46619 7.8±0.07 16 8.8±0.21 1.3 Serotonin 7.2±0.02 69 Histamine 6.7±0.07 217 5.6±0.22 2710 Methacholine 6.6±0.10 231 6.6±0.10 234 Data are presented as mean±se. PCLS: precision-cut lung slice; GP: guinea pig; pD50: potency (-log(EC50)); LTD4: leukotriene D4.
- Table 2—
Mediators involved in the allergen-induced bronchoconstriction of PCLS from different species
Rat 8 Human 9 Guinea pig Serotonin X – – Histamine – (X) X Thromboxane – X X Leukotrienes – X X x: effective; –: ineffective; (X): partially effective.


