


Figures
- Fig. 1.—
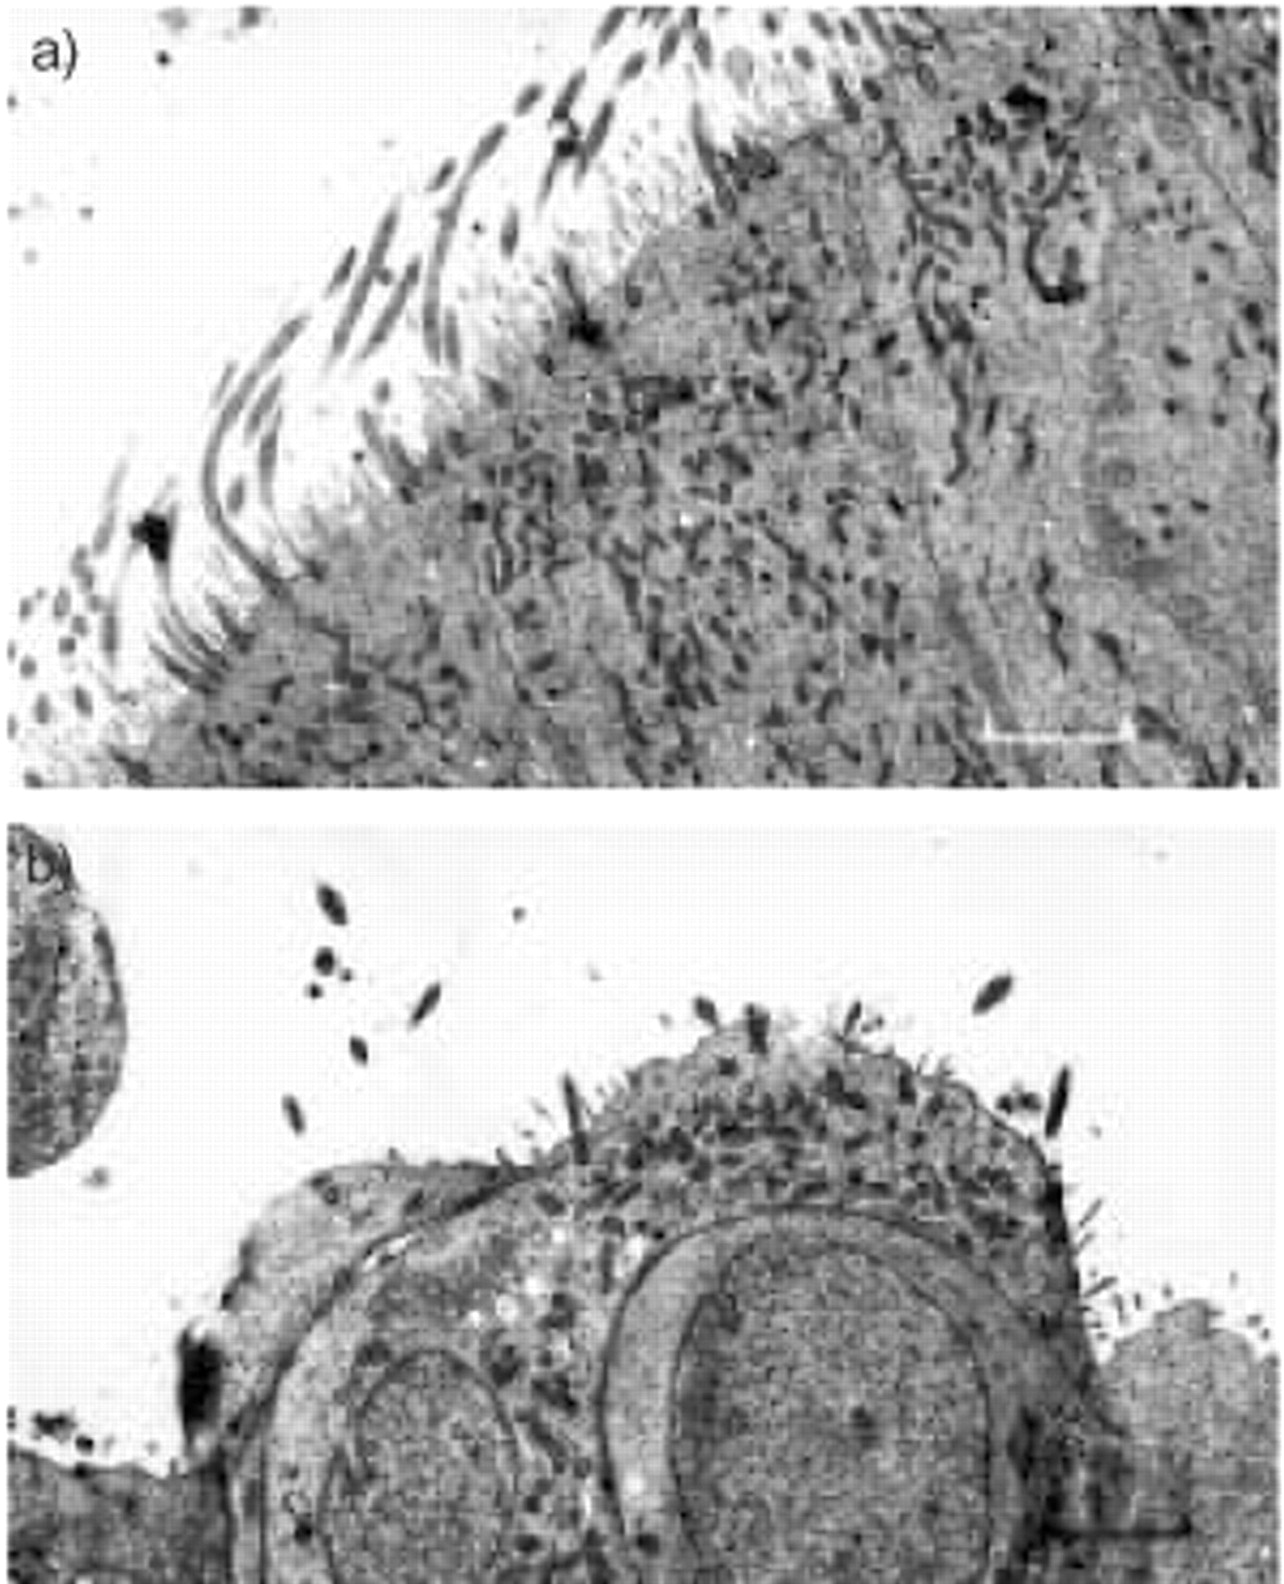
Transmission electron micrograph of nasal epithelium before and after coronavirus inoculation. a) Transmission electron micrograph day 0. This shows normal tissue with an intact well-ciliated surface and minimal disruption. b) Transmission electron micrograph day 3. This shows abnormal tissue with severely disrupted cell surface. Marked loss of cilia is seen. Internal scale bars=2.9 µm.

Tables
- Table 1—
Epithelial cell types pre and post virus or sham inoculation
Ciliated cells Dead cells Mucous cells Corona Day 0 63.7 (46.8–80.6) 0.0 (0.0–0.0) 10.2 (3.1–17.3) Day 3 20.5 (3.8–37.2)* 6.3 (1.4–11.2)* 11.5 (7.5–15.5) Sham Day 0 72.0 (66.2–77.8) 0.0 (0.0–0 0) 9.2 (7.8–10.6) Day 3 70.1 (67.5–72.7) 0.0 (0.0–0.0) 99 (8.3–11.5) Group difference# Corona - sham −41.3 (−80.7–−1.8)* 6.3 (0.5–12.2)* 0.58 (−12.2–13.3) -
Data are presented as mean percentage (95% confidence interval)
-
#: difference between changes from baseline in the two groups, i.e. (day 3 − day 0)corona−(day 3 − day 0)sham
-
*: p<0.05
-
- Table 2—
Assessment of epithelial integinty pre and post virus or sham inoculation
Cells with loss of cilia Cells extruding from surface Cells with cytoplasmic blebbing Cells with mitochondrial damage Corona Day 0 28.1 (15.4–40.8) 25.8 (21.5–30.1) 15.1 (10.7–19.5) 11.9 (5.4–18.4) Day 3 97.9 (93.8–101.9)* 63.4 (51.5–75.3)* 36.3 (24.2–48.4)* 44.2 (33.8–54.6)* Sham Day 0 31.9 (26.4–37.4) 25.7 (22.1–29.3) 17.6 (10.2–25.0) 10.4 (5.8–15.0) Day 3 23.3 (18.6–28) 21.4 (20.9–21.9) 17.1 (12.7–21.5) 12.6 (3.7–21.5) Group difference# Corona – sham 79.2 (58.2–100.2)*** 41.9 (25.6–58.2)*** 21.7 (3.8–39.6)* 30.1 (16.1–44.1)* -
Data are presented as mean percentage (95% confidence interval)
-
#: difference between changes from baseline in the two groups, i.e. (day 3 − day 0)corona−(day 3 − day 0)sham
-
*: p<0.05
-
***: p<0.001
-
- Table 3—
Ciliary function and ultrastructural analysis pre and post virus or sham inoculation
CBF Hz Ciliary dyskinesia score Dynein arm defects % Microtubule defects % Central microtubule defects % Ciliary orientation ° Corona Day 0 11.3 (8.6–14.0) 0.2 (0–0.5) 1.3 (0.3–2.3) 2.6 (1.4–3.8) 0.3 (0.0–0.6) 10.6 (10.1, 11.1) Day 3 9.4 (7.2–11.6) 1.1 (0.5–1.7)* 2.9 (0.8–5.0) 4.7 (3.2–6~2)* 1.0 (0.1–1.9) 11.4 (10.4, 12.4) Sham Day 0 11.9 (11.6–12.2) 0.1 (0.0–0.0) 0.9 (0.0–2 2) 2.2 (1.0–3.4) 0.0 (0.0–0 0) 10.7 (10.0–11.4) Day 3 10.8 (10.1–11.5) 0.2 (0.0–0.4) 1.2 (0.1–2.3) 2.3 (0.8–3.8) 0.0 (0.0–0 0) 11.0 (10.3–11.7) Group difference# Corona – sham −0.8 (−7.9–6.3) −0.8 (−1.5–−0.1)* 1.1 (−2.8–5.0) 1.8 (0.1–3.4)* 0.8 (−0.6–2.1) 0.7 (−1.1–2.5) -
Data are presented as mean (95% confidence interval)
-
CBF: ciliary beat frequency
-
#: difference between changes from baseline in the two groups, i.e. (day 3 − day 0)corona−(day 3 − day 0)sham
-
*: p < 0.05
-


