


Figures
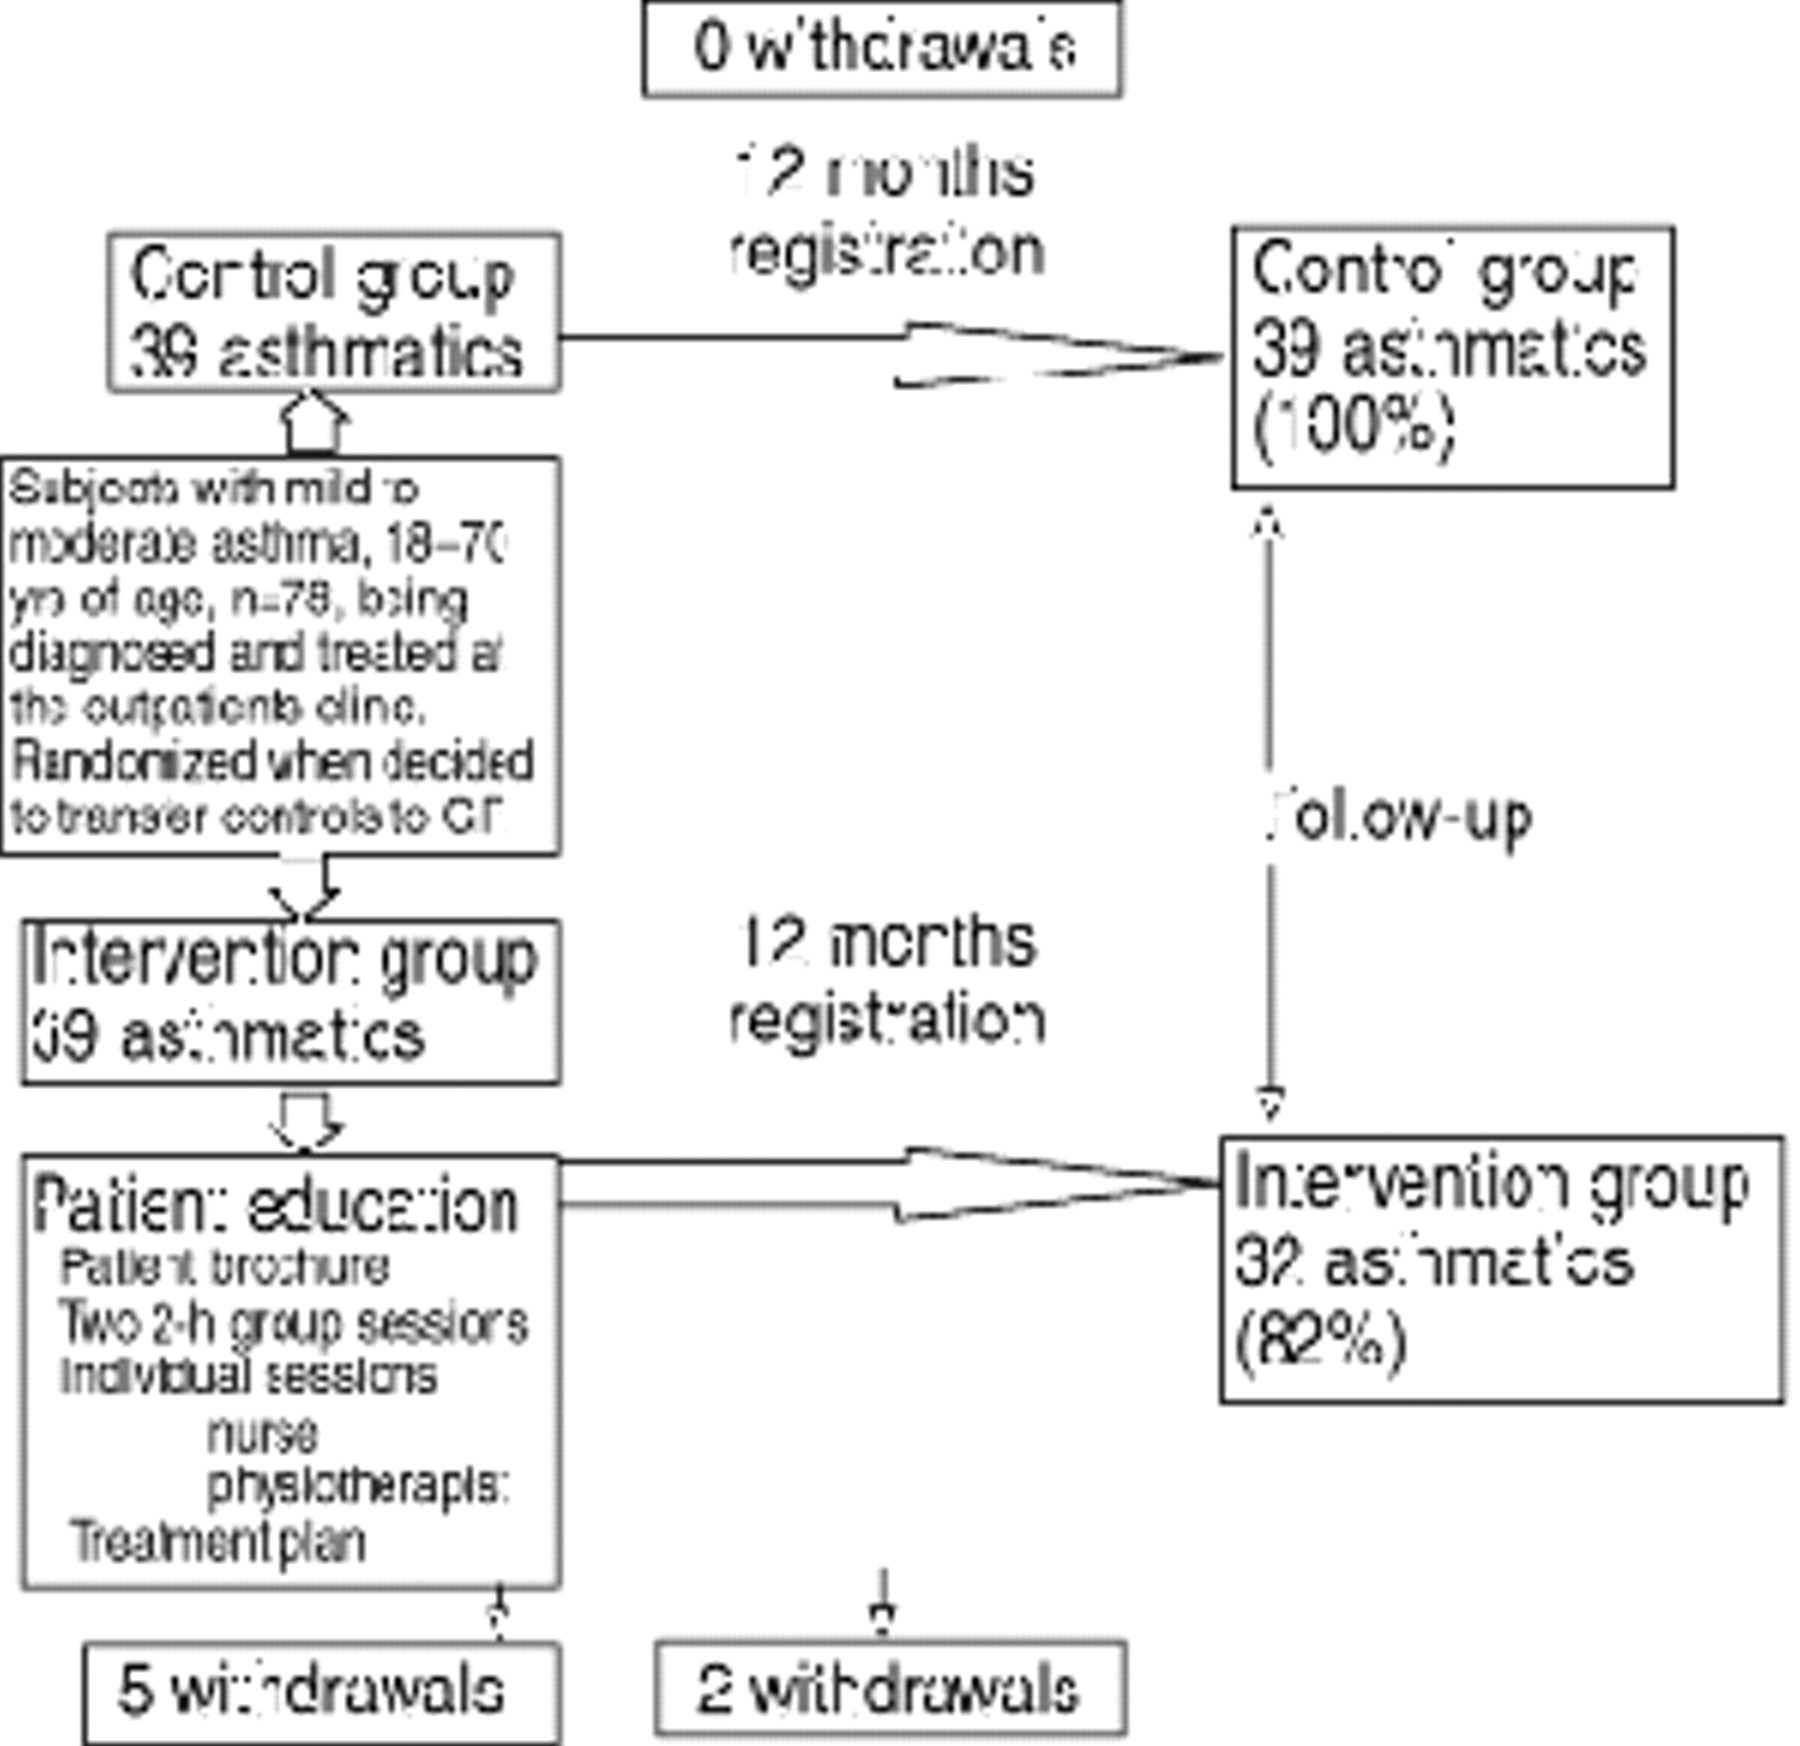
- Fig. 1.—
Scheme of study design and withdrawals.
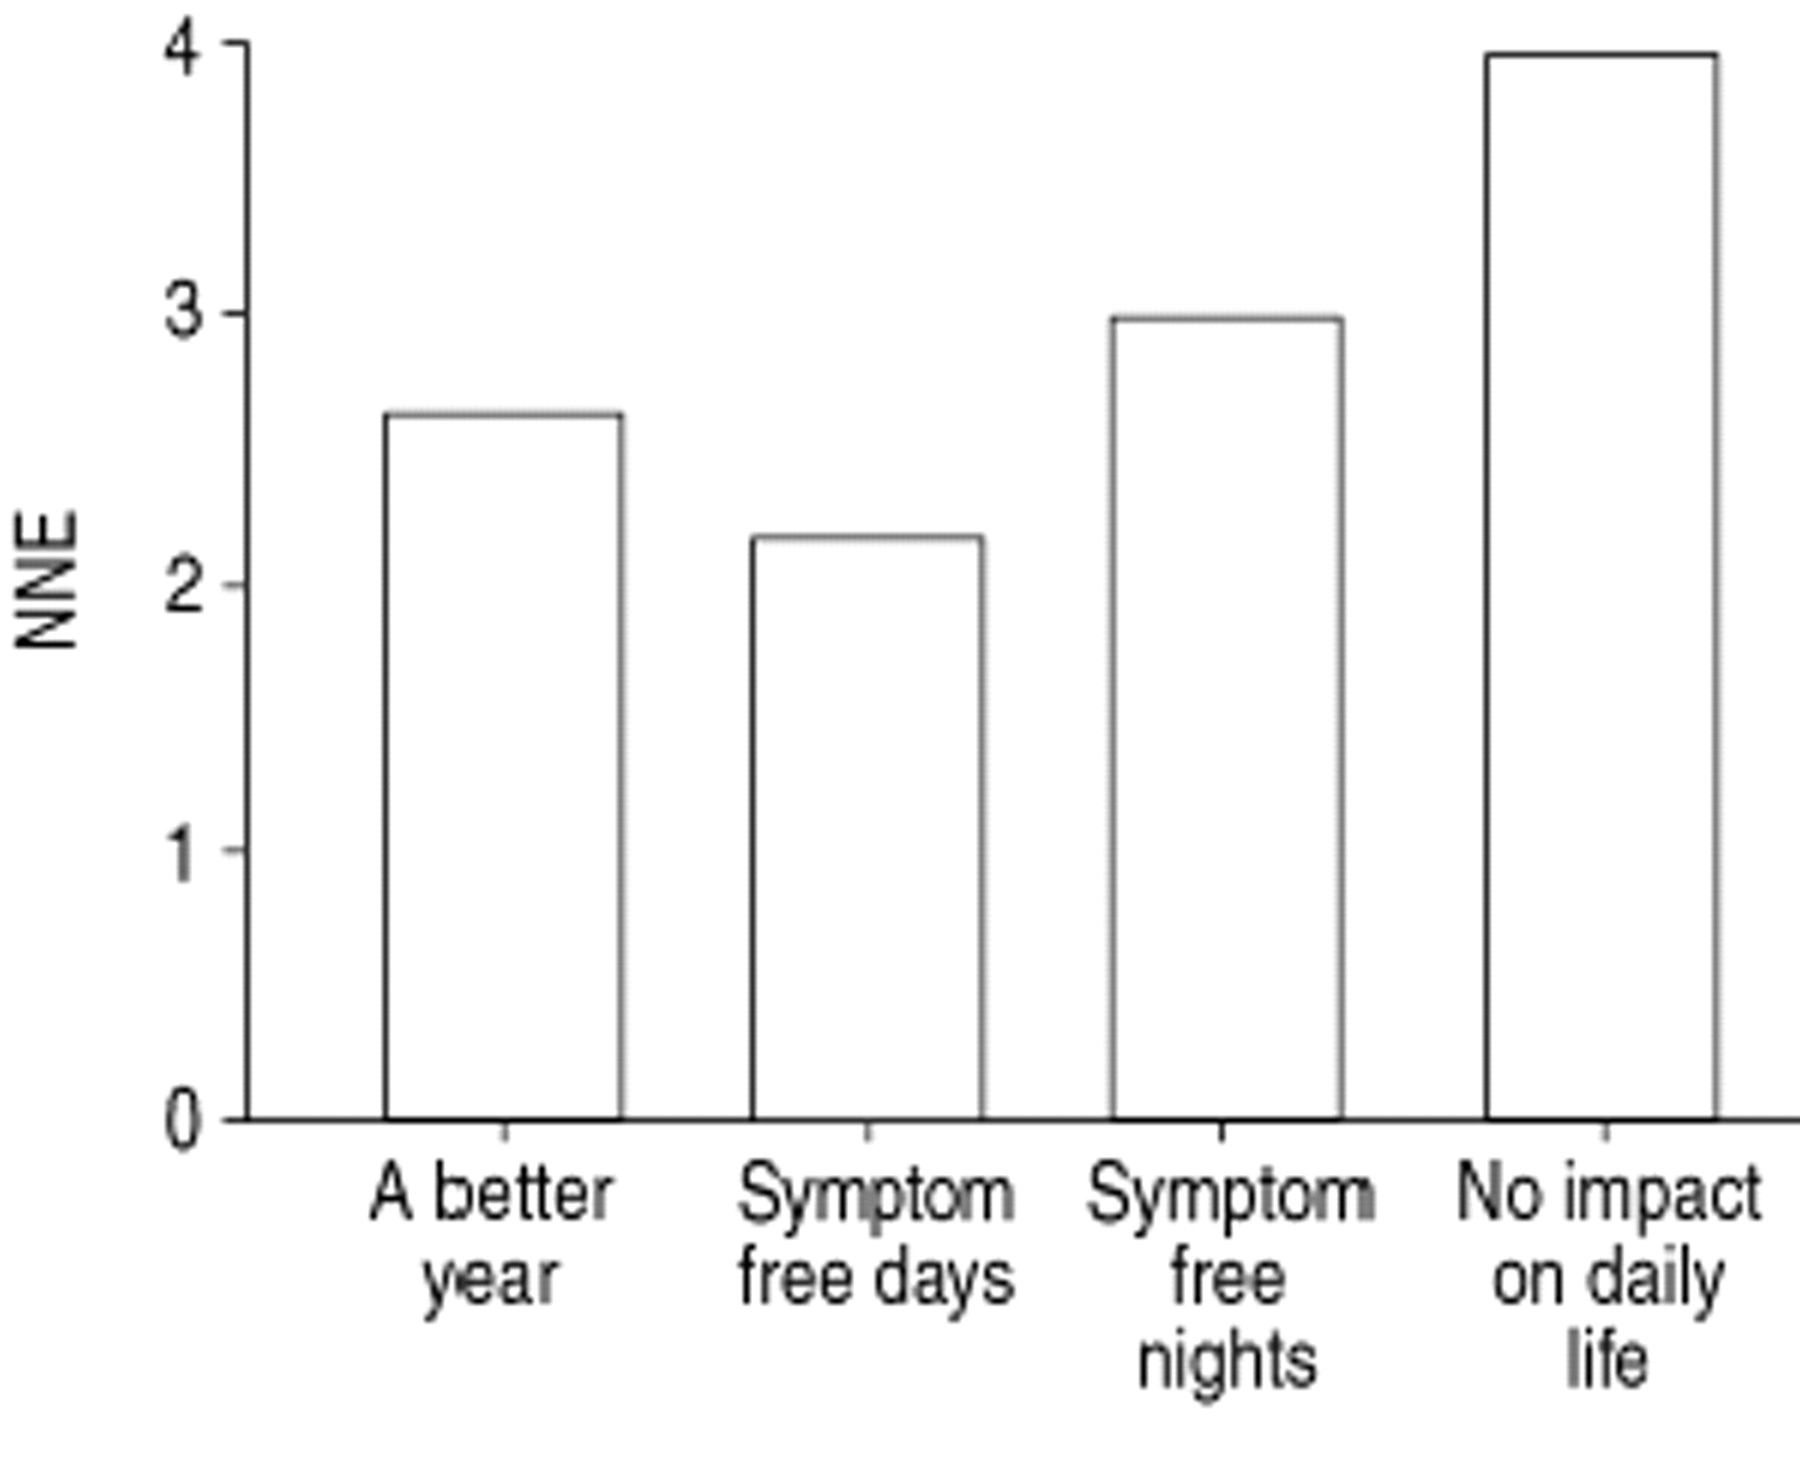
- Fig. 2.—
Number needed to educate (NNE) to make one person have 4 types of outcome. 95% confidence intervals: a better year: 1.7–5.9; symptom free days: 2–22; symptom free nights: 1.9–6.3; no impact on dailt life: 2.1–20.
- Fig. 3.—
The cost/concentration curve showing the cumulative costs plotted against the cumulative numbers of patients. ▪: control; □: intervention.


Tables
- Table 1—
Baseline characteristics of the asthmatics included in the study
Control group Intervention group Subjects n 39 39 Sex, Male 8 (21) 15 (39) Age yrs 44±12 41±12 Smoking habits current smokers 13 (33) 9 (23) Employed 24 (62) 29 (74) FEV1 % pred 95±17 93±13 FVC % pred 105±15 104±12 FEV1 % 78±9 75±8 Data are presented as n (%) or mean±sd
FEV1: forced expiratory volume in one second
FVC: forced vital capacity
% pred: per cent predicte.
FEV1 % was calculated according to the following, (FEV1/FVC)×100
- Table 2—
Health related quality of life according to St. George's Respiratory Questionnaire (SGRQ), change in forced expiratory volume in one second (FEV1) and response to four quality of life questions at 12 month follow-up
Control group Intervention group Difference 95% CI for the difference OR p-value Subjects n 39 32 SGRQ total scores at the one year follow-up 36.5±18 20.2±15 16.3 8.2–24.4 0.0002 FEV1 change in mL −83±38 112±39 195 11–377 0.038 FEV1 change in % −2.7±12 3.4±13 6.1 0.2–12.1 0.043 Percentage answering that they had A better year 43 81 1.8–16.5 5.5 0.002 Symptom free days 36 81 2.4–22.7 7.4 0.001 Symptom free nights 60 94 2.0–47.8 9.9 0.001 No impact on daily life 62 88 1.2–14.7 4.3 0.02 Data are presented as mean±sd
CI: confidence interval
independent-samples t-test
Chi-squared test
OR: odds ratio
- Table 3—
Direct, indirect and total costs (NOK) per patient during a 12 month follow-up for the intervention and control groups
Control Intervention p-value Mean±sd Median 25/75 P Mean±sd Median 25/75 P Cost items Patient education programme 0 0 900±50 900 (900/1000) <0.001 Peak flow meter 0 0 200 200 <0.001 Pharmaceuticals/drugs 3300±3100 2400 (1900/4500) 3700±3400 2400 (1000/5600) 0.703 GP visits 600±900 200 (0/800) 200±500 0 (0/200) 0.001 Pulmonary physician visits 55±200 0 (0/0) 52±200 0 (0/0) 0.555 Hospital admissions 0 0 700±2700 0 (0/0) 0.116 Travel costs doctor visits 63±89 22 (0/88) 21±55 0 (0/22) 0.001 Travel costs educational programme 0 0 100±34 100 (100/100) <0.001 Total direct costs 4000±3800 3400 (1100/5500) 5900±4800 4100 (2500/8800) 0.054 Patient time cost for education programme 0 0 1200±600 1400 (1100/1400) <0.001 Patient time cost for doctor visits 300±700 0 (0/200) 100±500 0 (0/0) 0.044 Production loss 11600±33100 0 (0/5100) 3400±16700 0 (0/0) 0.038 Total indirect costs 11900±33500 200 (0/6400) 4600±17300 1400 (1100/1500) 0.302 Total costs 16000±35400 5400 (1500/11100) 10500±20500 5800 (4000/10100) 0.510 Both cost items and sums are, if NOK >100, rounded off to nearest NOK 100. *Mann-Whitney U-test
25/75 P=25th and 75th percentiles
The mean number of GP visits, pulmonary physician visits and days off work in the control group were 2.6, 0.2 and 20.5, respectively. The corresponding figures for the intervention group were 0.7, 0.2 and 6.0 17. Median values with 25th and 75th percentiles are shown due to the skewed distribution of data. Time costs include travel time and are only calculated for those being employed, but alternative assumptions are explored through sensitivity analysis
Control: n=39
Intervention: n=32
- Table 4—
Cost-effectiveness ratios
Direct costs Total costs Cost-effectiveness ratios Difference in SGRQ total scores at 1-yr follow-up 1839/16.3=113 −5493/16.3=−337 FEV1, change in mL 1839/195=9.4 −5493/195=−28 FEV1, change in % 1839/6.1=301 −5493/6.1=−901 Adjusted cost-effectiveness ratios,, Difference in SGRQ total score at 1-yr follow-up 1110/10 −3400/10 FEV1, change in mL 900/100 −2800/100 FEV1, change in % 1500/5 −4500/5 Cost-effectiveness ratio/per % of patients having: A better year 1839/38=48 −5493/38=−145 Symptom free days 1839/45=41 −5493/45=−122 Symptom free nights 1839/34=54 −5493/34=−162 No impact on daily life 1839/26=71 −5493/26=−211 The cost of making one person have, A better year 4800 −14400 Symptom free days 4100 −12200 Symptom free nights 5400 −16100 No impact on daily life 7100 −21100 incremental cost (NOK)/unit of improvement
the main outcome cost-effectiveness ratios are rounded off to the nearest NOK 100
the cost of making one person have =(direct or total costs difference×number needed to educate)
an adjusted cost-effectiveness ratio relates to the cost per outcome of clinical significance
SGRQ: St. George's Respiratory Questionnaire
FEV1: forced expiratory volume in one second
NOK: Norwegian Krone
- Table 5—
One-way sensitivity analyses on costs
Variables Range of values Total costs Mean difference Control mean Intervention mean Time cost for those employed NOK·h−1 Base case 106.2 16000 10500 5500 Low 106.2×70% 15900 10100 5800 High 106.2×130% 16100 10800 5200 Time cost for those not employed NOK·h−1 Base case 0 16000 10500 5500 Low 106.2×70% 16200 10700 5400 High 106.2×130% 16300 11000 5400 Cost of educational programme NOK Base case 916 16000 10500 5500 Low Teaching costs 16000 10100 5900 High Teach costs×2 16000 10600 5400 Production loss NOK·h−1 Base case 106.2 16000 10500 5500 Low 106.2×70% 12500 9500 3000 High 106.2×130% 19500 11500 8000 Travel costs NOK Base case Bus fares 16000 10500 5500 Low 0 15900 10300 5600 High Bus fares×4 16200 10900 5300 Cost items and differences are rounded off to nearest NOK 100
“Base case” is the assumption for the main conclusion. “Low” and “High” means low and high estimates for the assumptions
Regarding the patient education programme, the amount paid and reimbursed is exchanged with the cost of teaching when the scale of pay is used as a basis


