


Abstract
The 50% reduced overall mortality previously associated with influenza vaccination among the elderly was based on studies neither fully taking into account systematic differences between individuals who accept or decline vaccination nor encompassing the entire general population.
A population-based prospective cohort study was performed in Stockholm County (Sweden), including all persons aged ≥65 yrs (n = ∼260,000), over three influenza seasons: 1998/1999, 1999/2000 and 2000/2001. The relative risks of mortality among vaccinated versus unvaccinated individuals were estimated using Cox's proportional hazards regression adjusted for, and stratified by, demographic factors and comorbid conditions during the three seasons and the respective following off-seasons.
Influenza vaccination was associated with an unadjusted reduction in all-cause mortality during the three seasons of 50, 46 and 42%, respectively, which decreased to 14, 19 and 1%, respectively, following adjustment for confounders and differences in mortality between vaccinated and unvaccinated individuals following the influenza season. The numbers needed to treat to prevent one death, during the three seasons, were 297, 158 and 743, respectively.
Vaccination remains the most important measure for prevention of influenza complications in elderly people, although the effectiveness in reducing all-cause mortality in elderly persons is lower than previously thought.
One high-quality randomised trial has shown that influenza vaccination is ∼50% efficacious in the prevention of clinical and serological influenza in the elderly 1. This study was not powered to assess mortality, but observational studies have described reductions in all-cause mortality of ∼≥50% in vaccinated versus nonvaccinated older persons 2–4. In a recent systematic review including 64 studies (five randomised controlled trials, 49 cohort studies and 10 case–control studies), vaccination was found to be effective against complications of influenza in elderly persons, in both those living in homes for the elderly and those living in the community 3. The effectiveness of vaccination against hospital admission due to influenza or pneumonia in these two groups was 45 and 27%, respectively, and 60 and 47%, respectively, against all-cause mortality.
Since annual mass vaccination of elderly individuals against influenza requires considerable resources, the anticipated benefits must be well characterised. Vaccination aims at preventing both morbidity and complications due to influenza, principally secondary pneumonia, which is associated with substantial mortality in the elderly. Mortality is, therefore, also an important end-point. People who seek or accept vaccination may exhibit a mortality pattern that differs from that of individuals who abstain from vaccination 3. In observational studies, adjustment for differences in baseline factors by multiplicative models does not circumvent such selection bias. Alternative approaches, such as comparing end-points among vaccinated individuals during the influenza season and off-season, may be more informative, but have, to date, yielded contradictory information 5, 6. The level of effectiveness of influenza vaccine in preventing death overall thus remains an open question. Moreover, it is far from certain that the findings of previous studies, based on subsets of the elderly adhering to a specific general practitioner 5, 7 or particular health maintenance organisation 8, can be generalised to the entire general population, which comprises the true target in mass vaccination campaigns.
A broadly advertised vaccination campaign targeted at all individuals aged ≥65 yrs (n = ∼260,000) was carried out in Stockholm County, Sweden, during 1998–2000 9. The aim of the present study was to assess the effectiveness of influenza vaccination as regards all-cause mortality over this 3-yr period of influenza epidemics of different strengths, after adjustment for demographic factors and underlying health characteristics, and after compensating for differences in mortality pattern between vaccinated and unvaccinated individuals by using influenza season and off-season comparisons.
SUBJECTS AND METHODS
Setting
Swedish inpatient care is public and population-based. Referrals are independent of financial capacity or insurance. The National Registration Number, a unique 10-digit number assigned to all Swedish residents at birth, permits record-linkage of health registers 10.
Study period and population
The study was conducted between September 1, 1998 and August 31, 2001, and included three consecutive influenza seasons, 1998/1999, 1999/2000 and 2000/2001, and the following off-seasons. The source population consisted of all residents of Stockholm County (∼1.8 million, mainly urban). The study population consisted of all individuals aged ≥65 yrs during the period 1998–2001 (n = ∼260,000 annually). All such individuals were invited by post to receive, at reduced cost (less than half of the ordinary price), influenza and pneumococcal vaccines over an 8-week period between September 1 and November 30 in each of the three seasons. The campaign was advertised on local television, in daily newspapers, on posters at general practitioners' surgeries and at pharmacies.
For follow-up, each influenza season was defined as the period December 1 to April 30, and the off-season, when no influenza was likely to circulate, as the period May 1 to August 31. However, during the first study season (1998/1999), follow-up started on January 1, 1999 since outcome data for December 1998 were unavailable. During the time period in which vaccination was performed each year, the same person could initially belong to the nonvaccinated group and later to the vaccinated group, and this period was, therefore, not included in the primary outcome analysis.
Intervention
Influenza vaccination
During all three study seasons, a trivalent split-virion influenza vaccine was used (1998: A/Beijing/262/95 (H1N1), A/Sydney/5/97 (H3N2), and B/Harbin/7/94 (B/Beijing/184/93-like strain); 1999: A/Beijing/262/95 (H1N1), A/ Moscow/10/99 (Sydney-like; H3N2), and B/Harbin/7/94; and 2000: A/Beijing/262/95 (H1N1), A/ Panama/2007/99 (H3N2), and B/Sichuan/379/99).
On vaccination, information regarding National Registration Number, date of vaccination and vaccines (influenza, pneumococcal or both) given was sent to a database at the Dept of Communicable Diseases Control and Prevention (Stockholm, Sweden). By linking this database to the population register corresponding to Stockholm County, each county resident could be classified as exposed or unexposed to either vaccine for each year, 1998/1999, 1999/2000 and 2000/2001. Vaccination coverage was 38% (98,199 individuals) in 1998, 39% in 1999 and 41% in 2000. Prior to the present study, there had been no targeted programmes or campaigns to increase the use of influenza vaccine in Stockholm County. Although the exact coverage among elderly persons in Stockholm prior to 1998 is not known, usage of influenza vaccine was generally very low in Sweden, and only 73 doses per 1,000 population were distributed in 1997.
Influenza activity
It is difficult to establish the exact incidence of a seasonal influenza A, since most of those who become ill do not seek healthcare. In Sweden, the relative strength of an epidemic is estimated by the number of persons with laboratory-verified influenza and/or the number of persons with influenza-like illness detected by weekly sentinel surveillance and reported to the Swedish Institute for Infectious Disease Control (SMI; Solna, Sweden) 11. Based on laboratory reports, the SMI estimated that influenza activity was moderate and moderate–high, respectively, during the first two seasons (1998/99 and 1999/2000), whereas there was very low activity during the 2000/2001 season (A. Linde, SMI, personal communication; fig. 1⇓). The dominating circulating strain was influenza A H3N2, which matched the vaccine strains well during both the 1998/1999 and 1999/2000 seasons (fig. 2⇓; table 1⇓). During the third season, 2000/2001, concordant with reports from other European countries 7, there was some circulation of mainly influenza type B, but no clear epidemic activity.

Number of patients reported to the Swedish Institute for Infectious Disease Control (Solna, Sweden), by Swedish viral laboratories, as having positive findings of influenza A or B during the three influenza seasons. ––––: 1998/1999; -------: 1999/2000; ……: 2000/2001. During the final season, 2000/2001, there was still some circulation of influenza when reporting was stopped after calendar week 15, and it was estimated that circulation would have continued until week 17.

Mortality rates among unvaccinated (•) and vaccinated (▪) individuals over the three influenza seasons and following off-seasons: a) 1998/1999; b) 1999/2000; and c) 2000/2001.
Epidemiological data and vaccine effectiveness based on comparison of the fully adjusted hazard ratios(HR) during influenza seasons and the following off-seasons, and numbers needed to treat (NNT) to prevent one death during the three influenza seasons
Baseline information
Through linkage of the study population with the Swedish Inpatient Register (which contains information on all Swedish inpatient care since 1987), individual information was obtained regarding all inpatient care (dates and registered diagnoses) since 1995. This information was subsequently categorised according to the medical diagnoses on the discharge files, which are coded according to the International Classification of Diseases (ICD) 9–10 (Appendix 1), as respiratory, cardiovascular, cancer and diabetes mellitus. Information was also collected on the parish of domicile and marital status during the period 1998–2001, through linkage to the population register, and on occupation held in 1980 and 1990, through linkage to the census surveys of the relevant years.
Outcome
Vital status and cause of death
Through linkage to the population register, the vital status of all individuals throughout the study period (January 1, 1999 to December 31, 2001) was ascertained, and, through linkage of the study population with the Swedish cause of death register, information was collected regarding deaths (including cause) during the same time period.
Statistics
Analyses of mortality covered the influenza seasons and off-seasons during the follow-up period, January 1, 1999 to August 31, 2001. Study subjects were censored upon emigration from Sweden. Hazard ratios for vaccinated versus unvaccinated individuals were estimated by weighted Cox's proportional-hazards regression stratified by age and sex, and the fully adjusted models were further stratified by socioeconomic status, marital status and respiratory, circulatory, malignant disease or diabetes mellitus comorbid conditions. Comorbidity was defined as having received any in-hospital care under such diagnoses (based on the ICD classification) during the 3 yrs preceding the start of each follow-up period. Differences in vaccination effects between influenza season and off-season were tested by pseudo time-dependent covariates estimating the ratio between effects during the two seasons.
Since Cox's regression does not accommodate for the varying effect of vaccination over the season, it was decided to apply an additive model when estimating the number needed to treat (NNT). The observed additive difference in mortality off-season was used as a measure of the unexplained selection effect. The vaccination effect was then estimated by subtraction from the mortality function for unvaccinated individuals during the influenza season of the corresponding curve for vaccinated individuals, parallel-displaced by the estimated shift parameter (Δ; fig. 3⇓). The expected absolute numbers of lives saved, during each month of the influenza season, were estimated by calculating the difference between observed deaths among unvaccinated individuals and the number of deaths expected had they been vaccinated. Further details of the calculations are given in the Appendix 2.
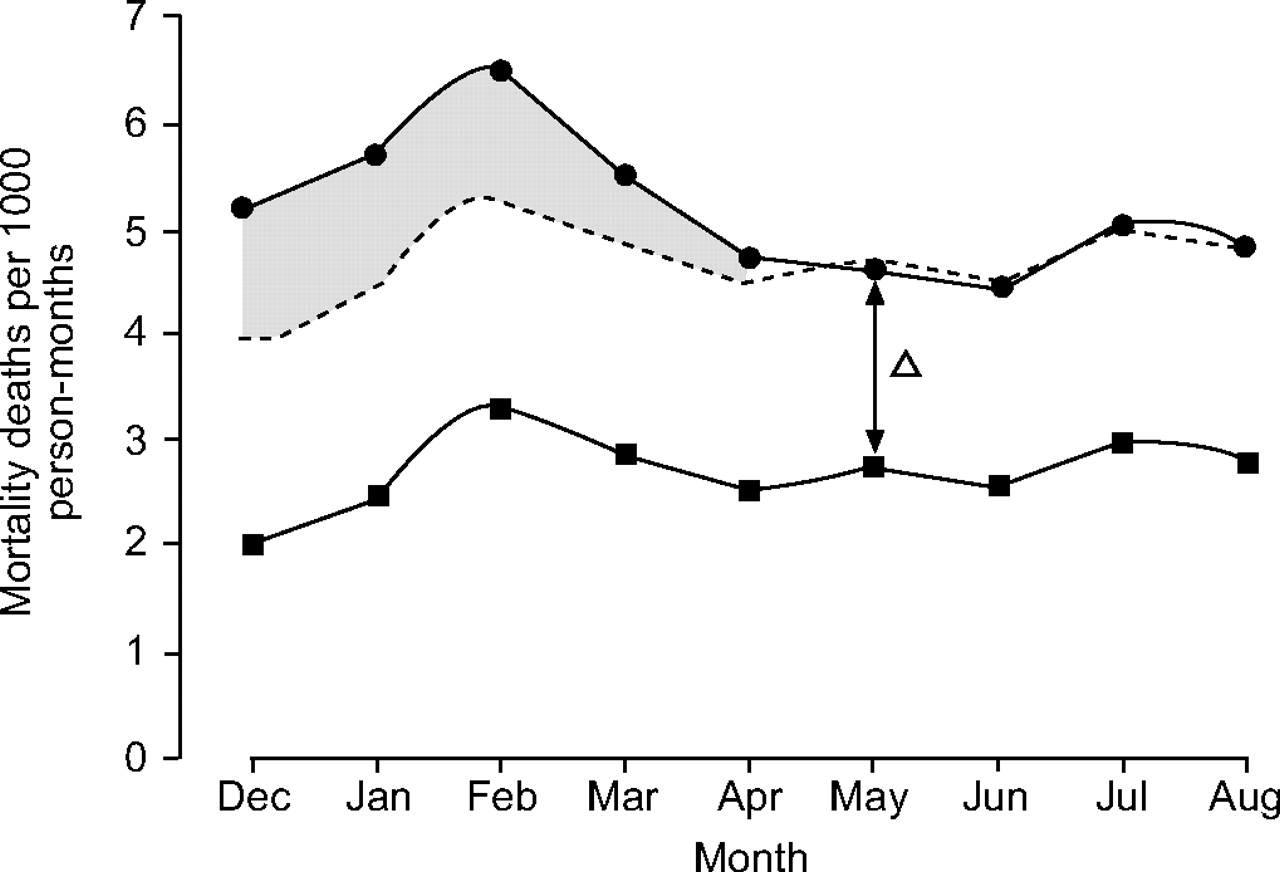
Illustration of the statistical method used to estimate number needed to treat. The vaccination effect (▓) was estimated by subtraction of the mortality function for vaccinated individuals (▪) during the influenza season (December–April), parallel-displaced by the estimated shift parameter (------), from the corresponding curve for unvaccinated individuals (•). Δ: difference in mortality off-season.
Ethical approval
The Regional Ethical Committee of the Karolinska Institutet (Stockholm, Sweden) approved the present study.
RESULTS
Predictors for vaccination and outcome
During the first study season, vaccination was more frequent among males than females, among those aged 70–79 yrs than those aged <70 or >79 yrs, in married than in single subjects, and in those who had had white-collar jobs than in those with blue-collar jobs (tables 2⇓ and 3⇓). All of these variables displayed confounding properties, i.e. were also associated with risk of death (table 3⇓). There was a modestly higher proportion of vaccinated individuals among those with chronic cardiac or respiratory disease. The same pattern was also observed during the two following seasons (data not shown).
Population characteristics among individuals vaccinated and unvaccinated at the start of the1998/1999 influenza season
Population characteristics, vaccination coverage and mortality during the 1998/1999 influenza season and following off-season
Effectiveness of influenza vaccination
Crude and adjusted analyses during the influenza season
The crude death rates per 1,000 person-months in vaccinated versus unvaccinated subjects were 2.82 versus 5.68 in the 1998/1999 season, 3.03 versus 5.63 in the 1999/2000 season and 2.94 versus 5.09 in the 2000/2001 season, corresponding to a vaccine effectiveness of 50, 46 and 42%, respectively. Adjustment for all variables displayed in table 3⇑ reduced these estimates by only ∼5%, to 44, 40 and 37%, respectively (fig. 2⇑).
Adjustment for vaccine effectiveness during the influenza off-season
A significantly lower risk of death in vaccinated versus unvaccinated subjects was also observed during the influenza off-season (May–August) in all three study periods, with a vaccine off-season effectiveness of 35, 25 and 37%, respectively (table 1⇑). Comparison of the fully adjusted hazard ratios during the influenza seasons and following off-seasons suggested that the protective effect of vaccination against death was significantly greater during the influenza seasons than the following off-seasons for 1998/1999 and 1999/2000, with an estimated vaccine effectiveness of 14% (95% confidence interval (CI) 5–23%) and 19% (95% CI 11–27%), respectively, but no vaccine effectiveness (1% (95% CI 10–11%)) during 2000/2001, when there was little influenza activity.
The NNT, i.e. the number of persons it is necessary to vaccinate in order to prevent one death, was estimated as 297 (95% CI 212–495) during the 1998/1999 season and 158 (95% CI 123–222) during the 1999/2000 season, whereas no significant estimate was obtained for 2000/2001 (table 1⇑).
Stratified analyses of effectiveness
During 1998/1999 and 1999/2000, the point estimates for the adjusted hazard ratios for death among vaccinated versus unvaccinated individuals were almost consistently lower during the influenza season than the following off-season, irrespective of comorbid conditions, sex or age (fig. 4⇓). In 2000/2001, when there was little influenza circulating, no differences in vaccine effectiveness between the influenza season and the following off-season were observed.

Vaccinated-to-unvaccinated fully adjusted hazard ratio (HR) for mortality during the three influenza seasons (⋄) and following off-seasons (♦) stratified by: a) comorbidity; b) sex; and c) age on vaccination. Horizontal bars represent 95% confidence intervals.
Cause-specific mortality
During the seasons 1998/1999 and 1999/2000, there were consistent differences between the influenza season and following off-season as regards deaths related to respiratory, circulatory and malignant diseases (fig. 5⇓). The most striking difference was observed during 1999/2000, for patients with malignant diseases. In contrast, the corresponding analyses for 2000/2001 showed no apparent differences between season and off-season, with the exception of there being a tendency for a higher vaccinated-to-unvaccinated hazard ratio for death due to respiratory diseases during the influenza season than during the following off-season.

Vaccinated-to-unvaccinated fully adjusted hazard ratio (HR) for various cause-specific mortalities during the three influenza seasons (⋄) and following off-seasons (♦): a) 1998/1999; b) 1999/2000; and c) 2000/2001. Horizontal bars represent 95% confidence intervals. All: all causes; Res: respiratory; Cir: circulatory; Tum: tumours; Ex: external.
DISCUSSION
Principal findings
The present study confirmed the fact that influenza vaccination is effective in reducing deaths among the elderly. During an ordinary seasonal epidemic, vaccination reduced all-cause mortality by 15–20%, and it was only necessary to vaccinate 150–300 individuals in order to prevent one death. Similar to the results of earlier studies 7, 8, vaccination was effective irrespective of sex or underlying disease, and in almost all age groups. However, although the present results confirm vaccine effectiveness, this effectiveness was substantially lower than that observed in most previous reports 3, 12.
Strength and weaknesses in relation to other studies
The substantial previously reported influenza-associated mortality among the elderly 11, 13–15 was recently indirectly challenged by Simonsen et al. 16. In a study of seasonal mortality, they could attribute <10% of the excess all-cause mortality among the elderly during the influenza season to influenza, a finding that is incompatible with the observed reduction in all-cause deaths of 50% 2–4. The methodological challenges in observational assessments of vaccine effectiveness are not trivial, and may have affected some of the previous estimates.
With respect to internal validity, individuals who seek or accept vaccination are likely to differ from individuals who are unvaccinated 3, 17. For instance, although concomitant chronic respiratory disease may increase the likelihood of getting vaccinated (confounding by indication), so also may a high degree of health consciousness among healthy individuals (healthy-user bias). Furthermore, the propensity for being vaccinated may not be the same among all persons suffering from the same underlying disease. For instance, vaccination might be more common in persons with severe than with mild chronic obstructive pulmonary disease, whereas the reverse might be true for those suffering from malignant diseases. Although baseline differences between vaccinated and unvaccinated individuals can be addressed using classical confounding-control, such adjustments may leave room for considerable residual confounding. Moreover, baseline differences representing confounding by indication or healthy-user biases must be addressed by other methods, such as using vaccinated and unvaccinated subjects as their own reference, by comparing mortality during the influenza epidemic with that during a period with no circulating influenza 5. Depending upon the analytical strategy chosen, the conclusions may be very different, as illustrated by the present results. During the first influenza season, the unadjusted effect of vaccination was ∼50% (as previously reported 9), which is in the same range as that reported by Nichol et al. 8, for example. However, the present cohort of vaccinated individuals also exhibited a 35% lower mortality during months when there was no influenza, suggestive of a healthy-user bias. Thus it is likely that, within each stratum of adjustment, i.e. for age, sex, socioeconomic status and comorbid conditions, vaccination uptake in the present cohort was higher among persons with a lower risk of death. This phenomenon was particularly evident during the 2000/2001 season, when there was little or no influenza, but when vaccinated subjects remained at a 37% reduced risk of death during the influenza season (after adjustment for known confounders). However, this selection bias could be adjusted for by taking the reduced off-season mortality into account, resulting in the effectiveness of vaccination decreasing to only 14, 19 and 0%, respectively, during the three seasons. This range of estimated vaccine effectiveness further illustrates the fact that vaccine effectiveness should not be thought of or estimated as a fixed average but rather as a moving target.
In contrast to the present findings, Nichol et al. 8 stated that “vaccination against influenza was not associated with significant reduction in the odds of hospitalisation during the summer months”, but did not provide any data to substantiate this statement or describe whether there was any difference in all-cause mortality over the seasons. In a Dutch study 7, a comparison of the influenza season and off-season was made, but the potential effects of selection bias were dismissed on the basis of lack of significance of the effect of vaccination during the off-season.
With respect to generalisability, the results of an observational study may be limited by the selection of individuals from the general population into the study population. Although the General Practice Research Database (London, UK) has been shown to reflect the general population with respect to morbidity and mortality, the study population in the report of Mangtani et al. 5 showed a 20% lower rate of hospitalisation due to respiratory disease than did the general population. In the study of Voordouw et al. 7, almost 50% of the eligible study population were excluded from analyses, on the basis of data availability, in turn determined by the frequency of visits to their general practitioner. In comparison, one of the strengths of the present study is the inclusion and analysis of all individuals within the population targeted by the vaccination campaign. The present definition of study population may also be one reason for the lower vaccination coverage in the present study than in the Dutch and USA studies 7, 8, although it was similar to that of the UK study 5.
In the comparison of the effects of influenza vaccination during the influenza season and following off-season, the same time periods (December–April and May–August) were used each year, rather than the exact influenza periods. There were two main reasons for this choice. The exact influenza periods are based upon laboratory-confirmed influenza cases, and influenza may be circulating for some time both before and after these periods. It was also desired to catch persons who, late in the season, developed a complicating influenza that led to death after the end of the influenza period. In order to adjust for this somewhat broad influenza period, the difference in hazard ratios per month was also calculated. Despite this measure, a slight risk of underestimation of vaccine effectiveness cannot be formally excluded. However, although the influenza season was confined to the period of peak influenza activity and the peri-influenza season was used as a comparision in the study of Mangtani et al. 5, the results were similar when they, instead, compared the influenza season to the summer season.
In a retrospective cohort study, Jackson et al. 6 recently demonstrated that the relative difference in mortality between vaccinated and unvaccinated individuals was greatest during the period before the influenza season (during the vaccination period), and then decreased during the influenza period to be lowest following the season; it was concluded that this indicated preferential receipt of vaccine by relatively healthy seniors. In order to assess whether or not a similar trend was evident in the present data, hazard ratios for death over time were calculated in vaccinated versus unvaccinated persons during the two pre-influenza seasons for which such data were available, 1999 and 2000 (table 4⇓). The hazard ratios in both years were 0.32 during the pre-influenza season (and particularly low at the beginning of the vaccination period), as compared to 0.60 during the influenza season and 0.75 following the influenza season of 1999/2000, and 0.63 both during and following the influenza season of 2000/2001. The present authors do not think that this pre-influenza season effect substantially compromises the season versus off-season comparison of the present study. The main reason for this is that the mortality within the vaccinated group has already stabilised in December, and then remains essentially constant throughout the follow-up period (data not shown). Thus, the present analyses indicate that there are two principally different selection processes involved. The first is that persons with higher likelihood of dying within a few weeks show a lower likelihood of receiving vaccination. The second mechanism is a more general association between the probability of dying and the probability of having a vaccination at all, which is manifested in the observed difference in mortality following the influenza season, which could not be explained using the individual characteristics available.
Hazard ratios for all-cause mortality before the influenza season in vaccinated versus unvaccinated individuals stratified according to calendar period of vaccination
Limitations of study
One limitation of the present study is that some subjects within the unvaccinated group may have been vaccinated outside the campaign, which could have lowered the effectiveness of vaccination. It is considered that this is not particularly likely, since the campaign comprised the 2 months during which influenza vaccination is usually performed and was broadly advertised, and since all of the elderly received a personal letter inviting them to be vaccinated for less than half of the normal price.
Another limitation is that the present criterion for assigning presence or absence of underlying disease may be considered over-stringent in that it required prior hospitalisation for a defined diagnosis. The reason for not including outpatient visits for the same diagnoses was that such records are not generally available in Sweden. There are also several other variables of possible importance to the outcome of an influenza illness, i.e. smoking, alcoholism and the capacity to pay for the vaccine, which it has not been possible to adjust for. Since adjustments for all variables included in the model (tables 2⇑ and 3⇑) only reduced the estimates of effectiveness by ∼5%, it is unlikely that addition of outpatient diagnoses or other variables would have made a significant difference. Furthermore, by taking the reduced off-season mortality into account, it is likely that such possible biases would also be adjusted for. Finally, it is difficult to estimate the possible impact of simultaneous vaccination with the 23-valent capsular pneumococcal polysaccharide vaccine. Pneumococcal vaccine had rarely been administered to the elderly in Stockholm before the start of the current study, but records are lacking as to exactly how many of the present study group had previously been immunised. During the first study year (1998) 77% (75,317 out of 98,199) of those who were vaccinated against influenza also received pneumococcal vaccination. During the subsequent 2 yrs, 81 (81,482 out of 100,980) and 88% (93,703 out of 106,490), respectively, of the study population were vaccinated (during either the current or the preceding study year/years). Persons receiving pneumococcal vaccination alone were not evaluated and comprised 826 persons in the first study year, and 291 and 211 persons in the following 2 yrs. If pneumococcal vaccination has an impact upon mortality in older persons, the present findings could overestimate the effectiveness of the influenza vaccine. However, in contrast to the reduced risk of invasive pneumococcal disease in the elderly, any effect of pneumococcal vaccination on mortality has not been established 18, 19. Furthermore, the use of vaccinated individuals as their own controls would limit the risk of confounding by pneumococcal vaccination, which is effective for several years 20. In accordance with this, the most recent meta-analysis did not find that addition of pneumococcal vaccination significantly improved the effectiveness of influenza vaccines 3.
Conclusion
In conclusion, when offered to the general population, influenza vaccination was effective in preventing death from all causes among the elderly. Although this effectiveness (0–19%) was considerably lower than previously thought, influenza vaccination remains a very important preventive intervention, since only 150–300 elderly persons need to be vaccinated in order to prevent one death during an epidemic season.
Appendix 1: International Classification of Diseases groups
International Classification of Diseases (ICD) 9–10 codes
Appendix 2: Statistical analysis
Poisson regression (with identity link) was applied in order to estimate the additive Δ in mortality between vaccinated and unvaccinated persons during the influenza off-season, used for estimation of the NNT. There was no instance of a significant lack of fit for a homogeneous Δ over the months observed. The variances of the estimated number of saved deaths and NNT were calculated under the assumption that the observed deaths each month among vaccinated and unvaccinated persons followed a Poisson distribution, and also accounted for the estimation error in Δ.
Footnotes
-
For editorial comments see page 407.
- Received October 18, 2006.
- Accepted May 4, 2007.
- © ERS Journals Ltd
References


