


Abstract
Ciliary beating of airway epithelial cells drives the removal of mucus and particles from the airways. Mucociliary transport and possibly airway epithelial development are governed by muscarinic acetylcholine receptors but the precise roles of the subtypes involved are unknown.
This issue was addressed by determining cilia-driven particle transport, ciliary beat frequency, and the composition and ultrastructural morphology of the tracheal epithelium in M1–M5 muscarinic receptor gene-deficient mice.
Knockout of M3 muscarinic receptors prevented an increase in particle transport speed and ciliary beat frequency in response to muscarine. Furthermore, the ATP response after application of muscarine was blunted. Pretreatment with atropine before application of muscarine restored the response to ATP. Additional knockout of the M2 receptor in these mice partially restored the muscarine effect, most likely through the M1 receptor, and normalised the ATP response. M1, M4 and M5 receptor-deficient mice exhibited normal responses to muscarine. None of the investigated mutant mouse strains had any impairment of epithelial cellular structure or composition.
In conclusion, M3 receptors stimulate whereas M2 receptors inhibit cilia-driven particle transport. The M1 receptor increases cilia-driven particle transport if the M3 and M2 receptors are missing. None of the receptors is necessary for epithelial development.
Mucociliary clearance is a primary defence mechanism of the airways against inhaled microorganisms and noxious particles. Ciliated cells propel mucus and particles by the coordinated beating of their cilia. Acetylcholine (ACh) is known to increase ciliary beat frequency (CBF) 1, 2, which is generally believed to increase mucociliary transport. ACh is the main transmitter of parasympathetic nerve fibres in the airways but it can also be released from the bronchial epithelium and cells of the immune system 3, 4. It exerts its ciliostimulatory effect via muscarinic receptors (MRs) 1, 5.
Five MR subtypes (M1–M5R) have been identified by molecular cloning 6. Activation of each subtype can lead to different physiological effects based on the specific distribution pattern of each of these receptors and the signalling cascades they are linked to 6–8.
In murine, porcine and human lung, at least three MR subtypes, M1R, M2R and M3R, are expressed 9–12. Pharmacological studies suggest that the M1R and M3R subtypes are involved in the regulation of CBF 1, 5. However, conclusions derived from experiments using pharmacological inhibitors are limited by the rather small degree of MR subtype selectivity of these agents 8.
In the present study, mouse strains with genetic disruptions of the M1R, M2R, M3R, M4R and M5R genes were used 8, in order to assess the role of each individual MR in regulating surface particle transport of the tracheal epithelium and on CBF. The current authors also examined the effect of MR deficiency on ATP signalling, because ATP is an important epithelial mediator known to regulate CBF and is endogenously released from the airway epithelium 13, 14. Since MRs have also been implied in regulating proliferation and, possibly, differentiation of airway epithelial cells 4, 15, the epithelial cell type composition and cellular ultrastructure were also determined, in order to elucidate whether the lack of specific MR subtypes is associated with specific histological changes that might transmit into impaired mucociliary transport.
MATERIALS AND METHODS
Animals
The generation of M1R-/-, M2R-/-, M3R-/-, M4R-/-, M5R-/- and M2/3R-/- mice has been described previously 16–21.
The M1R-/- and M3R-/- mice and the corresponding wild-type (WT) mice that were used for studies examining relative cell frequencies had the following genetic background: 129SvEv (50%)×CF1 (50%). The M2R-/- mice and the corresponding WT mice (M2R+/+ mice) had a slightly different genetic background 20: 129J1 (50%)×CF1 (50%). For functional studies and for the determination of the number of brush and neuroendocrine cells, knockout mice were used that had been backcrossed for ≥10 generations onto the C57BL/6NTac background. C57BL/6NTac mice were used as WT controls. Animals deficient in both the M2R and M3R subtypes (M2/3R-/-) and control mice (M2/3R+/+) with an equivalent genetic background (129J1 (25%)×129SvEv (25%)×CF1 (50%)) were generated as previously described 21. Adult mice of both sexes that were ≥8 weeks old were used for all experiments. All mice were held under specified pathogen-free conditions prior to experiments. All experiments were made in accordance with the German animal protection law.
Real-time RT-PCR
The epithelial cells from the tracheae of WT, M1R-/-, M3R-/- and M2/3R-/- mice (n = 5 in each group) were abraded using cotton swabs that were carefully rolled over the epithelial layer, and the total RNA was isolated by using the RNeasy method according to the manufacturer’s protocol (Qiagen, Hilden, Germany). Contaminating DNA was degraded using 1 U DNase-I (Invitrogen, Karlsruhe, Germany) per μg of total RNA, and reverse transcription was done for 50 min at 42°C using 200 U Superscript II reverse transcriptase (Invitrogen) per μg of RNA.
Real-time quantitative PCR was performed in an I-Cycler (Bio-Rad, Munich, Germany) using QuantiTec SYBR Green PCR kit (Qiagen). Primer sets for the different MR subtypes and the housekeeping gene β2-microglobulin (β2-MG) are given in supplemental table 3 (see online supplementary material). The PCR conditions included initial denaturation for 10 min at 95°C followed by 40 cycles of 20 s at 95°C, 20 s 62°C and 20 s at 72°C. All analyses were done in triplicate. For quantification, the mean cycle thresholds (CT) were calculated and the corresponding CT values of the target gene were subtracted from mean β2-MG-CT according to the following:
ΔCT = CTtarget gene - CTβ2-MG (1)
The difference in expression of a target mRNA between two mouse strains was calculated as follows:
ΔΔCT = ΔCTtarget gene, strain a - ΔCTtarget gene, strain b (2)
The PCR products were analysed by electrophoresis on a 2% Tris-acetate-EDTA agarose gel.
Evaluation of epithelial composition and morphology, and immunohistochemistry for the M2R
For electron microscopy and determination of cell numbers, M1R-/-, M2R-/-, M3R-/- and their respective WT mice (n = 5 in each group) were killed by an overdose of isoflurane and perfusion fixed using a solution containing 2.5% polyvinylpyrrolidone (Sigma, Schnelldorf, Germany) and 0.5% procainamide HCl (Sigma) 22 to remove blood, followed by fixative containing 100 mL 1.5% glutardialdehyde and 2% paraformaldehyde in 0.1 M phosphate buffer (PB), pH 7.4. The trachea was removed, dissected into a laryngeal and a thoracic part and stored for 1 h in fixative. The tissue was then stained en block using OsO4 and uranyl acetate, dehydrated in increasing alcohol concentrations and embedded in Epon (Sigma). Semithin sections (1 µm) of whole tracheal cross sections were cut using an Ultracut E ultramicrotome (Leica, Bensheim, Germany) mounted on glass slides, stained with Rüdeberg stain and coverslipped with Eukitt (Fluka, Buchs, Germany).
To quantify the relative numbers of epithelial cells, the sections were viewed using a bright field microscope (Olympus BX60; Olympus, Hamburg, Germany) equipped with a 60× oil immersion objective lens. The epithelium was grouped into three regions, according to its underlying tissue: cartilage, tracheal muscle and ligament. For each region, 200 cells were examined (a cell was counted if its nucleus was visible) and the portions of ciliated, nonciliated and basal cells were determined.
From the same specimen, ultrathin sections were cut and counterstained with lead citrate. They were evaluated for morphological changes in epithelial cells using a transmission electron microscope (EM 906; Leo, Wörrstadt, Germany).
To determine if deficiency in muscarinic receptors influences the number of brush cells or neuroendocrine cells, M1R-/-, M2R-/-, M3R-/- and WT mice (n = 5 in each group) were perfusion fixed as described, using 4% paraformaldehyde in 0.1 M PB as fixative. Tracheas were removed, dissected into a laryngeal and a thoracic part, washed, cryoprotected with 18% sucrose, oriented to allow cutting of cross sections and snap frozen in liquid nitrogen. Frozen sections 10 μm thick were cut and incubated using either rabbit polyclonal antibody against protein gene product (PGP) 9.5 (1:10,000; Biotrend, Cologne, Germany) to label neuroendocrine cells or rabbit polyclonal antibody against villin 23 to stain brush cells. A Cy3-conjugated donkey anti-rabbit immunoglobulin (Ig) antibody (Dianova, Hamburg, Germany) was used for detection. The slides were washed and coverslipped using carbonate-buffered glycerol, pH 8.6, and evaluated using a BX60 microscope in epifluorescence mode with an appropriate filter set for Cy3. From five cross sections per animal per tracheal region, the numbers of PGP-immunoreactive and villin-immunoreactive cells were counted and normalised to the average diameter of the cervical and thoracic part of the WT animals.
For immunohistochemistry of M2R, mouse tracheas from WT and M2R-/- animals were dissected, shock frozen in melting isopentane and cut at 10 µm thickness. Sections were fixed for 30 min in Zamboni’s fixative 24 and then washed repeatedly in 0.1 M PB. Sections were covered for 1 h with PBS containing 10% normal donkey serum, 0.1% bovine serum albumin and 0.5% Tween 20, followed by incubation with rabbit anti-M2R antibody (1:500; Chemicon, Boronia, Australia). The sections were then washed in PBS and covered for 1 h with Cy3-conjugated donkey anti-rabbit Ig antibody (1:1000; Jackson, Baltimore, MD, USA). For multiple-labelling immunofluorescence experiments, the sections were incubated overnight with M2R antibody in combination with a monoclonal fluorescein isothiocyanate-labelled mouse anti-α-smooth muscle actin (α-SMA) antibody (1:400; clone 1A4; Sigma, Castle Hill, Australia) and in some experiments with a rat anti-CD31 antibody (1:500; clone MEC 13.3; BD Pharmingen, North Ryde, Australia), washed and covered with Cy3-conjugated donkey anti-rabbit IgG antibody and, if applicable, with Cy5-conjugated donkey anti-rat IgG (1:25; Jackson). After incubation with the secondary reagents, the slides were washed in PBS and coverslipped in carbonate-buffered glycerol at pH 8.6. The slides were evaluated by sequential scanning using a confocal laser scanning microscope (TCS SP5; Leica).
Measurement of particle transport speed
Mice were killed by inhalation of isoflurane (Baxter, Unterschleissheim, Germany). The thorax was opened and the submandibular gland and the infrahyoid muscles were removed. The trachea was cut caudally to the larynx and cranially to the bifurcation. The trachea was then removed and transferred to a Delta T culture dish (Bioptechs, Butler, PA, USA) whose glass bottom was covered with a thin layer of Sylgard polymer (Dow Corning, Wiesbaden, Germany) and that was filled with 2 mL cold hydroxyethyl piperazine ethane sulphonic acid (HEPES)-Ringer solution. Surrounding connective tissue was removed, and the trachea was oriented with the musculus trachealis facing upward and fixed with two insect needles. The m. trachealis was cut open using Vannas-Tübingen spring scissors (FST, Heidelberg, Germany). The preparation was then gently rinsed with HEPES-Ringer solution to remove mucus followed by exchange with 1.5 mL fresh warm buffer submerging the trachea. The culture dish was transferred to the Delta T Stage holder 30–40 min after the animal’s death and was held constant at 30°C. Imaging was performed with a Till Vision imaging system (Till Photonics, Gräfelfing, Germany) based on a BX50 WI fixed-stage microscope (Olympus) equipped with an Imago CCD camera with 1280×960 pixels (Till Photonics).
Prior to measurements, ∼500,000 polystyrene beads of a diameter of 4.5 µm (Dynabeads; Dynal Biotech GmbH, Hamburg, Germany) were added to the buffer solution. The epithelial surface of the trachea was then imaged in brightfield mode using an UMPLFL20×W/0.50 water immersion objective (Olympus). Muscarine (10−4 M; Sigma), ATP (10−4 M; Sigma) and atropine (10−6 M; Sigma) were added to the dish and were dispersed by gentle pipetting. Polystyrene beads were readily identified by their brownish colour. An area between two cartilages was chosen for imaging, in order to prevent large differences in image brightness. For each time-point, 200 images (640×480 pixels, 2×2 binning, 12 bit) were taken with an exposure time of 20 ms at a frame rate of 11.76 images·s−1.
To determine the track and the speed of individual particles, the following image processing was performed: non-moving objects in the images were eliminated by subtracting an average image of the 200 images of an individual series from each picture of the series on a pixel-by-pixel basis. If the value of a subtraction got negative, the absolute value was taken. Through this procedure, the image of the formerly darker Dynabeads became bright. A copy of this series was then changed to a binary picture by a thresholding procedure so that the Dynabeads were set to bright and the background was set to dark. The original film was reduced from 12-bit to 8-bit greyscale and both series were used to track the Dynabeads by an automatic tracking procedure using the TILLvisTRAC software (Till Photonics). Only tracks that were measured over a length of ≥10 frames were included in further calculations.
Measurement of CBF
To measure CBF, the trachea was prepared as described for measuring particle transport speed (PTS) and the same microscope setup was used. An area of the tracheal surface was imaged with an UMPLFL40×W/0.8 water immersion objective (Olympus) and imaging was performed with a high speed EHDcmos1.3 camera (EHD imaging GmbH, Damme, Germany).
In total, 1,000 images (640×480 pixels) were taken at a frame rate of 105 images·s−1. To calculate CBF, the mean grey value of a small area over ciliated cells was determined for each image in the time series. In each imaging series, 10 ciliated cells were evaluated. CBF was determined by resolving the dominating frequency by fast Fourier transformation using AutoSignal 1.7 (Seasolve, Framingham, MA, USA). For control, areas of the same size were examined in nonciliated cells. No dominating frequency was present in these control experiments.
Statistical analysis
To compare two experimental conditions and their controls, all groups of the experiment were compared by the Kruskal–Wallis test. If the resulting p-value was <0.05, the knockout groups were compared with the WT group using Mann–Whitney tests. The comparison was rated significant if p<0.05.
If time-points within a group were examined, all time-points were compared by the Friedman test. If the resulting p-value was <0.05, comparison between time-points was performed using Wilcoxon tests. The comparison was rated significant if p<0.05.
RESULTS
Expression of MR subtypes in the tracheal epithelium
To identify the MR subtypes that are expressed in tracheal epithelial cells, abraded tracheal epithelium of WT mice was analysed for the expression of M1–M5R mRNA. M1R and M3R mRNA was readily identified (mean ΔCT for M1R of 7.73, mean ΔCT for M3R of 6.49, compared with β2-MG mRNA) but mRNA coding for M2R was not. Although PCR products for the M4R and M5R were detectable, the expression levels were too low for reliable quantification (mean ΔCT for M4R of 13.82, for M5R of 12.95, nonspecific PCR products in M2R RT-PCR reached cycle threshold at ΔCT of 12.61).
Immunohistochemistry confirmed the lack of M2R in the mouse tracheal epithelium at the protein level (fig. 1a–c⇓). M2R immunoreactivity was not detectable in tracheal airway epithelial cells, whereas the antibody readily detected M2R in the tracheal smooth muscle as shown by double labelling with an α-SMA antibody (fig. 1d–f⇓). Immunoreactivity for M2R was found in nerve fibres around arteries but was not detected in nerve fibres in the epithelium or in the underlying lamina propria (fig. 1⇓). The M2R immunoreactivity of these structures was specific, since it was absent in sections from M2R-/- mice. Staining of pericyte-like cells in the lamina propria that surrounded CD31-immunoreactive microvascular endothelial cells was nonspecific as judged by its presence in sections from M2R-/- animals (fig. S1 in the supplementary material).
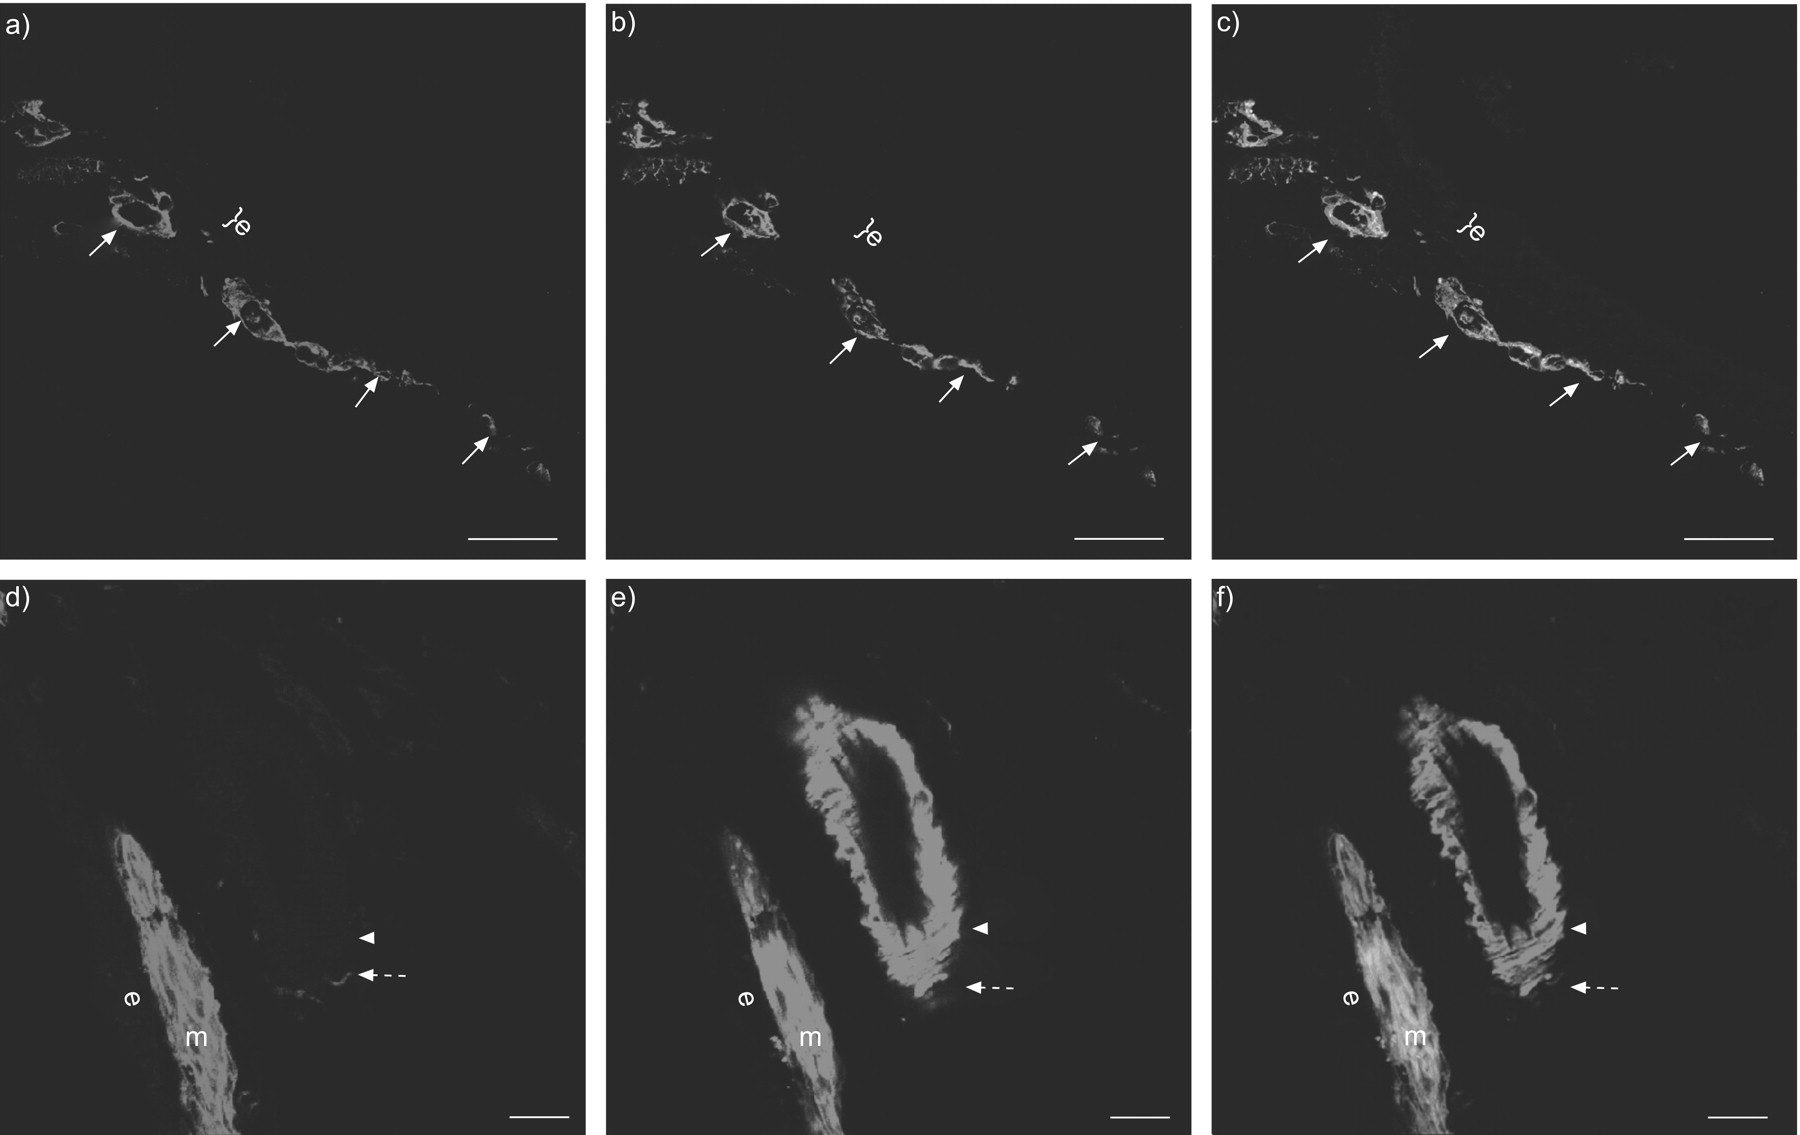
Muscarinic receptor M2R expression in the trachea in wild-type animals. a) M2R and b) CD31 immunohistochemistry and c) merge. a–c) No M2R immunoreactivity was present in the epithelium (e). Labelling of cells with morphology resembling pericytes (arrows), which surrounded CD31-immunoreactive endothelial cells, was nonspecific as judged by its presence in M2R-/- mice (see also fig. S1 in the supplementary material). d) M2R and e) α-smooth muscle actin (α-SMA) immunohistochemistry and f) merge. d−f) Double labelling immunohistochemistry demonstrated the presence of M2R immunoreactivity in the membrane α-SMA-positive airway smooth muscle cells (m) and in nerve fibres close to bronchial arteries (dashed arrows). The α-SMA-positive vascular smooth muscle (arrowheads) and the airway epithelium (e) showed no M2R immunoreactivity. Scale bars = 50 µm.
When compared with WT mice, M1R-/- mice exhibited a reduction of M3R mRNA expression (ΔΔCT = 1.01, p = 0.016). In M3R-/- mice, a reduced amount of M1R mRNA was detected (ΔΔCT = 2.37, p = 0.008). In M2/3R-/- mice, no statistically significant change in mRNA expression of M1R was found (ΔΔCT = 1.47, p = 0.095). Expression of M5R and M4R mRNA remained low in all examined knockout lines.
PTS in WT and MR-deficient mice
In WT mice, muscarine (10−4 M) induced an increase in mean±sem PTS from 43.5±2.7 µm·s−1 immediately before application of muscarine to 92.0±7.0 µm·s−1 8 min after drug administration (p = 0.002; fig. 2a⇓). Subsequent stimulation with ATP (10−4 M) resulted in a PTS of 101.3±6.7 µm·s−1 3 min after application (fig. 2a⇓ and supplementary movie 1). This further increase was not statistically significant (p = 0.071). In M3R-/- mice, basal PTS was reduced and muscarine had no effect on PTS (p = 0.81; fig. 2a⇓). ATP increased PTS in M3R-/- mice (p = 0.002), but the PTS was markedly lower than in WT mice (49.0±8.0 versus 101.3±6.7 µm·s−1 in WT; fig. 2a⇓ and supplementary movie 2). In M1R-/- mice, muscarine resulted in an increase in PTS from 42.0±4.1 to 106.6±5.7 µm·s−1 (p = 0.02; 8 min after administration) that was not statistically different from that observed in WT animals. Additional application of ATP resulted in a PTS of 107.1±6.0 µm·s−1 (not statistically significant compared with muscarine alone: p = 0.75), which was not significantly different from ATP-stimulated PTS in WT animals.
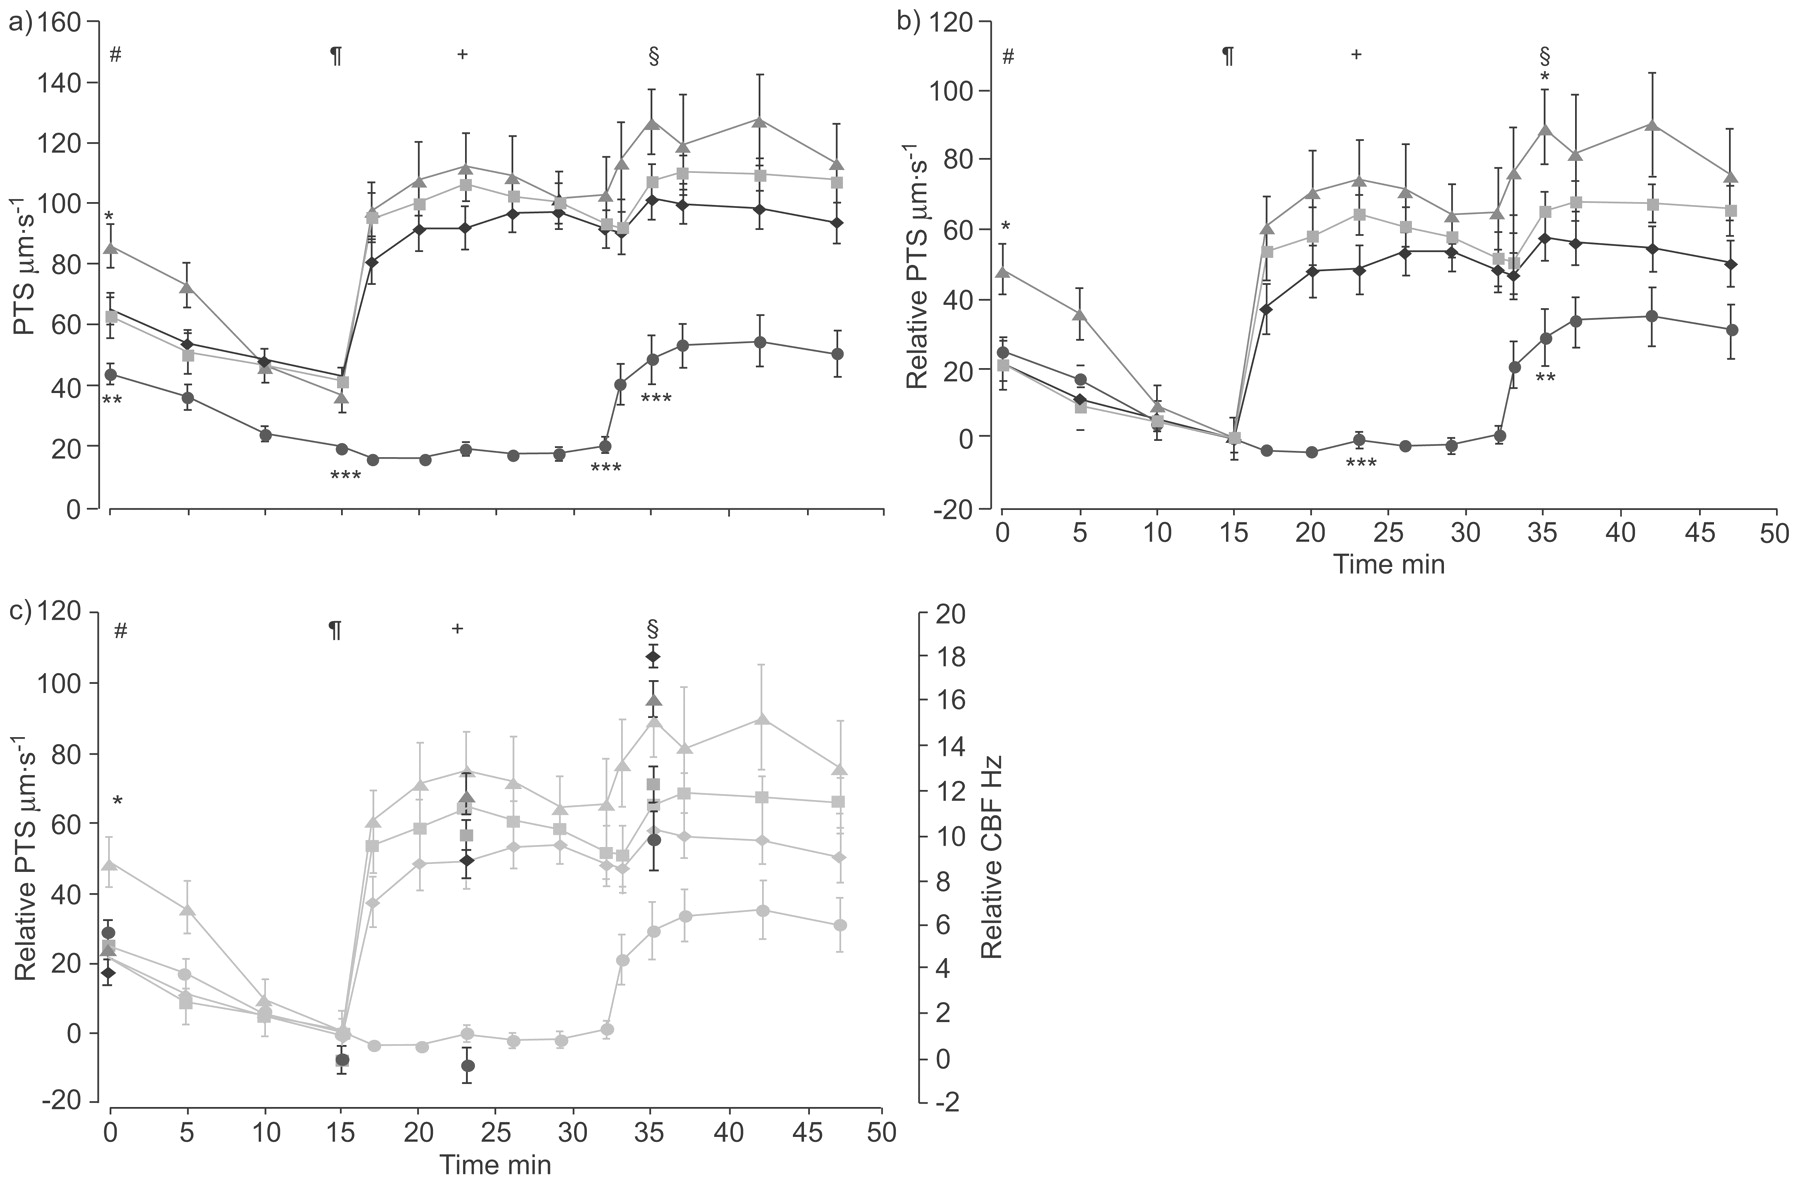
Particle transport speed (PTS) and ciliary beat frequency (CBF) in response to stimulation with muscarine and ATP in tracheae from wild-type (WT; black), M1R-/- (green), M2R-/- (red) and M3R-/- (blue) mice. a) PTS in tracheae from WT, M1R-/-, M2R-/- and M3R-/- mice in response to muscarine and ATP. b) Relative PTS, with the 15-min value set to zero to correct for baseline differences. Data are displayed as mean±sem, n = 6 for M1R-/- and M2R-/- mice and n = 12 for WT and M3R-/- mice. c) CBF corrected for baseline differences (colours as above) shown from WT, M1R-/-, M2R-/-, and M3R-/- mice and superimposed on the relative PTS graph (grey). Data are displayed as mean±sem, 40 cells from four animals for each group. Statistical analysis of the group differences (a and b) and CBF measurements (c) were performed at various times as follows. #: beginning of the experiment; ¶: immediately before addition of muscarine; +: 8 min after addition of muscarine; §: 3 min after addition of ATP. Statistical analysis between groups was carried out by Kruskal–Wallis test followed by Mann–Whitney test. *: p<0.05; **: p<0.01; ***: p<0.001.
In M2R-/- mice, addition of muscarine increased PTS in a manner comparable to that seen in the WT (to 111.9±11.1 µm·s−1; p = 0.15). In contrast to WT and M1R-/- mice, PTS was further increased by addition of ATP (to 126.8±10.7 µm·s−1; p = 0.02; fig. 2a⇑).
To evaluate whether differences in absolute speed were due to differences in basal speed, the value of the 15-min time-point was subtracted from each curve from all other time-points of the curve (fig. 2b⇑). Using this approach, the PTS in M3R-/- mice after application of muscarine followed by ATP was still statistically lower than in the other three examined mouse strains (p = 0.006). Furthermore, the relative PTS after application of muscarine and ATP in M2R-/- mice compared with WT mice was statistically significant (p = 0.01).
Reduced PTS coincided with reduced CBF in M3R-/- mice
The CBF was determined at the beginning of the experiment, immediately before addition of muscarine, 8 min after addition of muscarine, and 3 min after addition of ATP. These time-points corresponded with the time-points chosen for statistical comparisons of the PTS in previous experiments. During the first 15 min, a decrease in CBF in WT as well as in M1R-/-, M2R-/- and M3R-/- mice was observed (p<0.001 for each strain).
Strikingly, muscarine failed to induce an increase in mean CBF in M3R-/- mice and CBF was even reduced (mean±sem 7.70±0.46 versus 7.40±0.75 Hz; p = 0.049). In contrast, WT (11.90±0.63 versus 20.83±0.80 Hz; p<0.001), M1R-/- (9.80±0.36 versus 19.80±0.67 Hz; p<0.001) and M2R-/- (7.78±0.40 versus 19.63±0.88 Hz) mice responded to muscarine with an increase in CBF.
ATP evoked a further, statistically significant increase in CBF in all strains examined (p<0.001). The ATP-induced increase in CBF was substantially smaller in M3R-/- (17.78±1.28 Hz) than in M1R-/- (22.10±0.76 Hz), M2R-/- (23.9±0.77 Hz) and WT mice (29.9±0.77 Hz). Taken together, these data indicate that a lack of increase in CBF can explain the lack of increase in PTS in M3R-/- mice after muscarine application and can partially explain the reduced PTS after additional application of ATP.
To compare the changes in CBF with changes in PTS the relative increase in CBF was calculated by subtracting the value of the 15-min time-point and superimposing the data over the curves shown in figure 2b⇑ (fig. 2c⇑). The changes in CBF correlated with changes in PTS although they could not explain all differences in PTS (e.g. changes in PTS versus CBF after application of ATP), indicating that additional mechanisms that influence PTS are present.
Role of M4R and M5R in PTS
Neither M4R-/- nor M5R-/- mice differed significantly from WT mice in PTS and its responses to muscarine and ATP (fig. 3⇓).

M4R-/- (red) and M5R-/- (blue) mice did not differ from wild-type (black) mice in their particle transport speed (PTS) response to muscarine and ATP. Data are displayed as mean±sem, n = 6 for each animal group. Statistical analysis of the group differences was performed at various times as follows. #: beginning of the experiment; ¶: immediately before addition of muscarine; +: 8 min after addition of muscarine; §: 3 min after addition of ATP. Statistical analysis was carried out using the Kruskal−Wallis test, which showed no statistically significant difference at any of the time-points examined.
Relative frequencies of epithelial cell types and morphology do not explain differences in PTS of MR mutant mice
Since differences in the relative frequency of ciliated cells might explain the observed differences in PTS, the relative frequencies of ciliated cells, nonciliated cells and basal cells in WT, M1R-/-, M2R-/- and M3R-/- mice were quantified in the laryngeal and thoracic parts of the trachea (fig. S2 in the supplementary material). It was previously noted in rats that the relative frequency of ciliated cells is lower in the epithelium overlying the cartilage compared with areas overlying the ligament or the m. trachealis 25. Therefore, these areas were assessed separately. As in the rat, the current authors noted a significantly reduced frequency of ciliated cells overlying the cartilage (table S1 in the supplementary material). In neither part, however, did MR deficiency result in differences in cell type composition (see figure 4⇓ for the epithelium over the ligament of the cervical trachea and table S1 in the supplementary material for all data). The numbers of brush cells and neuroendocrine cells were also quantified by immunolabelling for villin (fig. S3a–d in the supplementary material) and PGP 9.5, respectively (fig. S3e–h in the supplementary material). No differences in numbers of brush cells were found in any of the areas examined (table S2 in the supplementary material). Neuroendocrine cells were significantly more numerous in the cervical but not in the thoracic part of the trachea in M1R-/- mice compared with WT mice (table S3 in the supplementary material). To investigate whether changes in ultrastructural morphology accounted for the observed differences in PTS, the tracheal epithelia were examined by electron microscopy. No significant differences were found among WT and MR mutant mice in the general structure of the epithelium, the subcellular morphology of ciliated epithelial cells or of the cilia in particular (fig. 5⇓). The morphological findings indicate that neither number nor subcellular structural alteration of ciliated cells contributed to the observed differences in PTS.

The relative frequency of ciliated (▒), nonciliated (□), and basal (░) cells was not changed in wild-type (WT), M1R-/-, M2R-/- and M3R-/- mice over the ligaments of the cervical trachea. Data are displayed as mean±sem, n = 5 animals for each group. Statistical analysis was carried out by Kruskal–Wallis test, which showed no statistically significant difference. For complete data please refer to table S1 in the supplementary material.

Ultrastructural morphology of cells in the tracheal epithelium of a and b) wild-type, c and d) M1R-/-, e and f) M2R-/- and g and h) M3R-/- mice. a, c, e and g) Overview of a ciliated cell. b, d, f and h) Cilia. a, c, e and g) Scale bars = 1 µm; b, d, f and h) scale bars = 0.05 µm.
Atropine pretreatment rescues the reduced responsiveness to ATP in M3R-/- mice
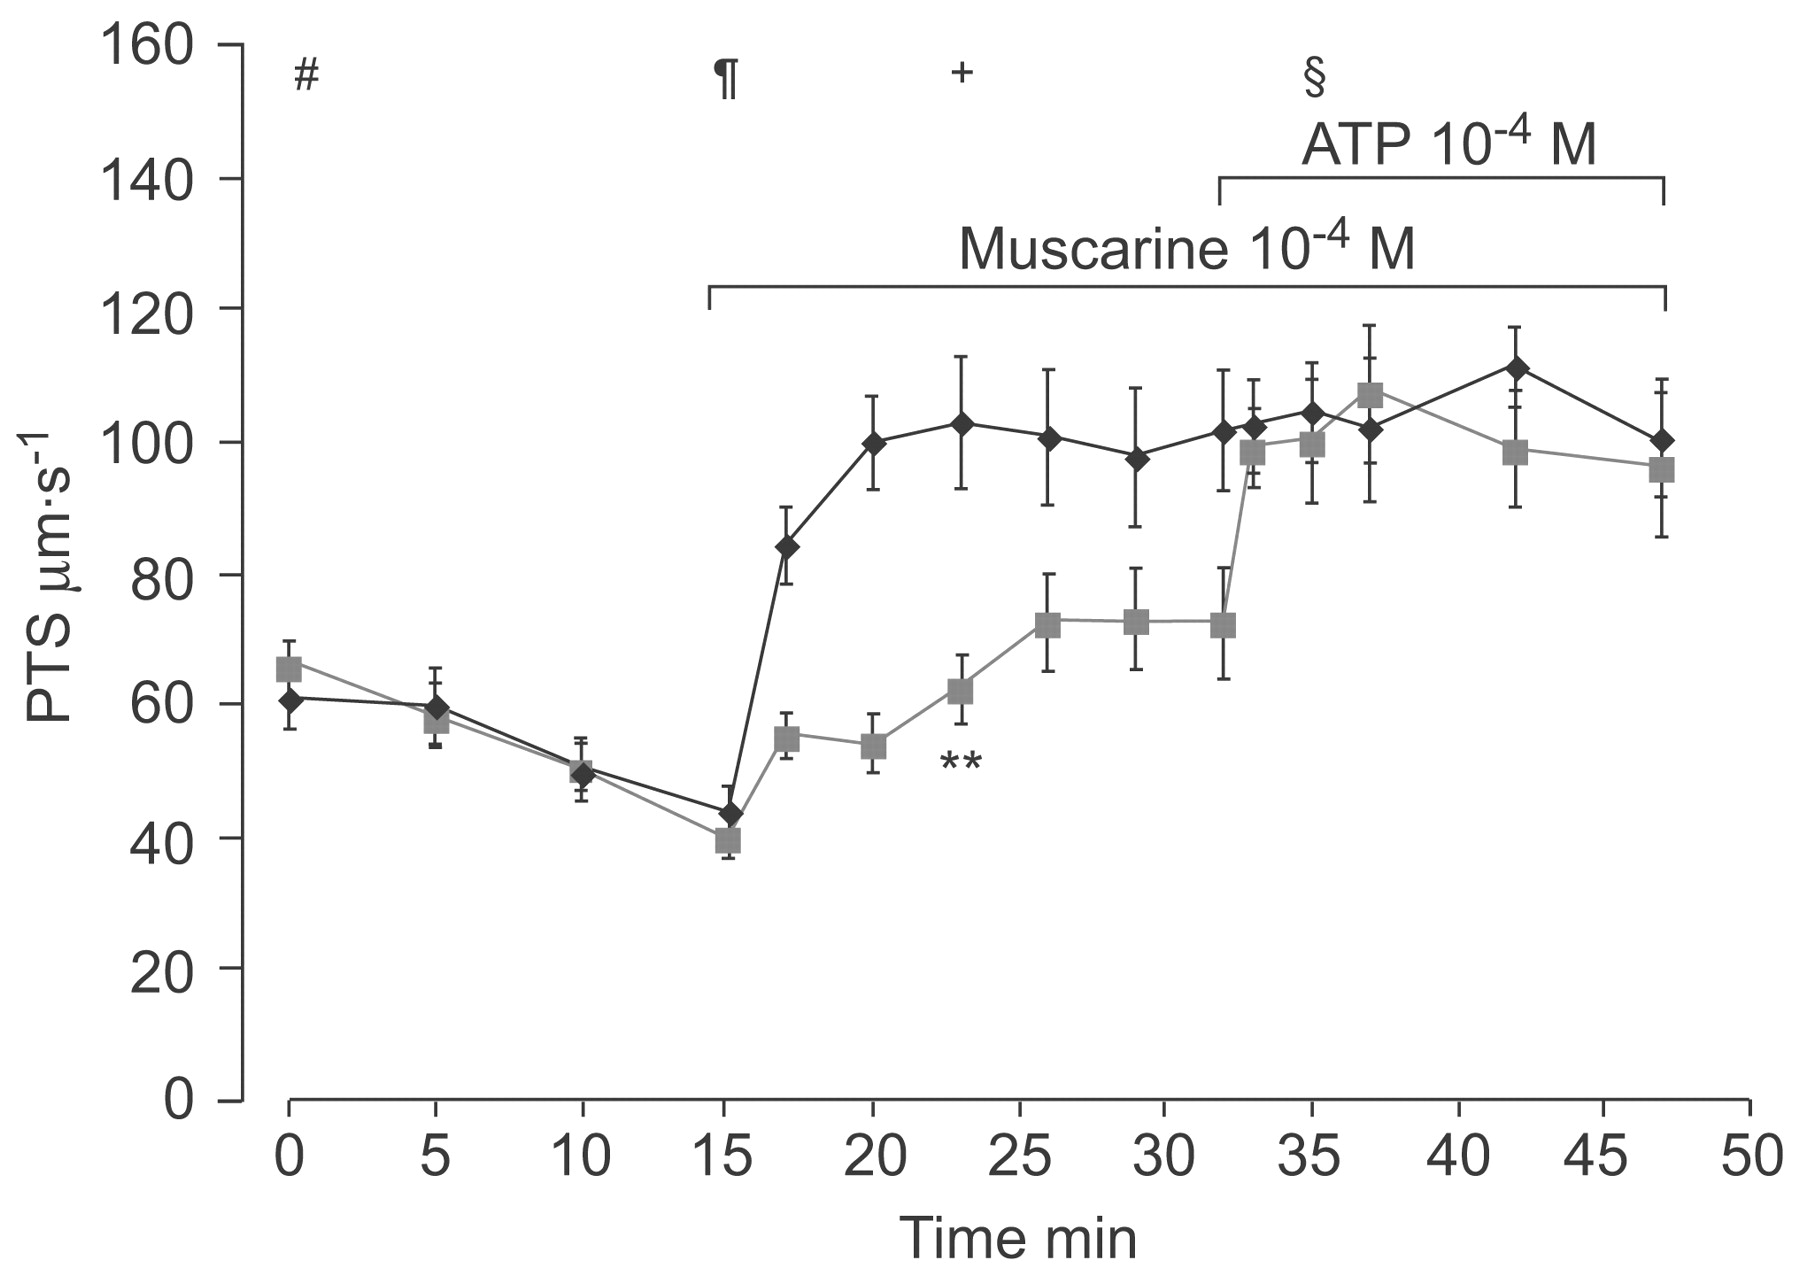
Since M2R-/- mice exhibited an enhanced PTS response to ATP, it was hypothesised that activation of the M2R prior to ATP stimulation might account for the reduced ATP response in M3R-/- mice. If this were the case, blockade of all MRs by atropine should rescue the effect of ATP in M3R-/- mice. Pretreatment with atropine (10−6 M) totally blocked the response to muscarine in WT mice (fig. 6⇓). In M3R-/- mice, pretreatment with atropine restored the ATP response, indicating that activation of the M2R is responsible for the blunted response to ATP in the absence of M3R.

Atropine prevented the blunted particle transport speed (PTS) response to ATP after application of muscarine in M3R-/- mice. PTS response of M3R-/- mice (blue) in comparison with wild-type mice (black). Data are displayed as mean±sem, n = 6 for each animal group. Statistical analysis of the group differences was performed at various times as follows. #: beginning of the experiment; ¶: immediately before addition of atropine; +: immediately before addition of muscarine; §: 8 min after addition of muscarine; ƒ: 3 min after addition of ATP. Statistical analysis was carried out by Kruskal–Wallis test followed by Mann–Whitney test.
Additional M2R deficiency rescues PTS increase after ATP in M3R-/- mice
To validate the inhibitory role of the M2R in M3R-/- mice, mice deficient for both the M2R and the M3R subtype (M2/3R-/-) and their corresponding WT mice (M2/3R+/+) were assessed for differences in PTS. In line with the hypothesis that the M2R is responsible for the slower PTS in M3R-/- mice, the ATP-induced PTS in M2/3R-/- mice was indistinguishable from that in WT mice (fig. 7⇓). The reactivity to muscarine was partially restored (62.3±5.3 versus 104.3±7.5 µm·s−1 in WT; fig. 7⇓), indicating that inactivation of the M2R not only restores the response to ATP but also unmasks stimulatory effects of other MRs (most likely the M1R).
M2/3R-/- mice (green) were responsive to muscarine and showed a normal ATP response with respect to particle transport speed (PTS) compared with corresponding wild-type mice (M2/3R+/+; black). Data are displayed as mean±sem, n = 6 for each animal group. Statistical analysis of the group differences was performed at various times as follows. #: beginning of the experiment; ¶: immediately before addition of muscarine; +: 8 min after addition of muscarine; §: 3 min after addition of ATP. Statistical analysis was carried out by Kruskal–Wallis test followed by Mann–Whitney test. **: p<0.01.
DISCUSSION
Six different knockout strains were used to clarify the role of MR subtypes in the epithelial transport of particles in the trachea. Subtypes M1R, M2R and M3R, but not M4R and M5R, are substantially involved in the regulation of particle transport.
The current authors determined the function of these receptors using the acutely removed and submerged mouse trachea and focused on PTS for the following reasons. The trachea contains different components, such as nerve fibres and/or cells of the immune system, which are likely to influence the function of ciliated cells in vivo but would be lost or are not present during long-term culture or in isolated cell models. Furthermore, since changes in epithelial morphology and composition as well as other factors that influence cilia-driven particle transport could not be ruled out, determining CBF alone ran the risk of overlooking other factors that might influence cilia-driven transport without impairing CBF.
The present results showed that the three MR subtypes involved in the regulation of PTS (M1R–M3R) exert their actions via different mechanisms. Deficiency of M3R resulted in a total loss of muscarine-induced increase in PTS. This was due to a total lack of increase in CBF, as suggested by classic pharmacological studies on cultured ovine tracheal and frog oesophageal epithelium 1, 5. The influence of the M3R knockout on PTS and CBF was not confined to muscarine but also resulted in a blunted response to ATP if given after stimulation with muscarine. This effect was due to an activation of the M2R, as will be discussed.
Knockout of the M2R resulted in a small increase in the response to muscarine and ATP, indicating that the M2R, when activated, can exhibit an inhibitory role. Since the increase was moderate compared with WT mice, the M2R does not seem to be a major regulator under normal conditions, which explains why this receptor was not previously regarded as important for the regulation of cilia-driven transport. However, the current data indicate that this inhibitory role of the M2R can be pronounced if the M3R is not functional. In M3R-/- mice, the effect of muscarine reversed from stimulatory to inhibitory, leading to a blunted response to ATP if applied after muscarine. This inhibitory effect of muscarine was prevented by pre-incubation with atropine, indicating that it is indeed mediated by an MR. That this inhibitory receptor is the M2R is indicated by the fact that additional knockout of the M2R in M3R-/- mice also reversed the effect of muscarine from inhibitory in M3R-/- to excitatory in M2/3R-/- and restored full reactivity to ATP. Release of ACh and activation of M2R during the removal of the trachea might also explain the reduced basal rate that was present in M3R-/- mice, although this was not a consistent feature of M3R-/- mice (fig. 6⇑).
Since neither M2R mRNA nor M2R protein were found in epithelial cells, the observed M2R-mediated effects are most likely not caused by an epithelial M2R but have to be mediated by other cell types harbouring M2R. In general, identification of the cellular distribution of MRs is hampered by the poor quality of antibodies against MRs 26. Even with the antibody used in the current study, which reliably detected the M2R in smooth muscle cells and some nerve fibres and which did not label these structures in M2R-/- mice, cross reactivity with an unrelated protein was experienced in pericytes. Although this antibody can detect M2R in some cells, the current authors cannot be sure that the antibody detected M2Rs in all cell types in the trachea that expressed this protein. Lung fibroblasts express functional M2R at least under cell culture conditions 27, 28. Since fibroblasts are found close to the epithelium in airways, it is possible that they can influence ciliated cells. However, the precise cell type(s) through which M2R exerts its inhibitory action on the epithelium remain to be determined.
M1R mRNA is expressed in the airway epithelium as judged by real-time RT-PCR. However, in M1R-/- mice, the reactivity to muscarine regarding PTS and CBF was not different from WT mice. This indicates that the presence of the M3R is sufficient for full reactivity to muscarine, and the M1R is not capable of preserving partial reactivity to muscarine in M3R-/- mice. Since a decrease in M1R mRNA was also detected in M3R-/- mice, it is possible that a reduced M1R receptor expression contributes to this effect. If the inhibitory M2R was deleted in addition to the M3R in M2/3R-/- mice, an increase in PTS after application of muscarine could be detected.
Since MRs have been implicated in regulating the proliferation and differentiation of the airway epithelium 4, the current authors expected changes in the morphology and/or relative cell number of epithelial cells. However, they found differences neither in the number of ciliated, nonciliated, basal and brush cells nor in the morphology of these cells among WT and the various MR mutant mice. Only an increased number of neuroendocrine cells was detected in M1R-/- mice, which was limited to the cervical part of the trachea.
Despite the observed functional differences in the M1R-/-, M2R-/- and M3R-/- mice, no profound general effect of MR deficiency on the morphology and cell composition of the tracheal epithelium was detected. This shows that these receptors are not necessary for proper development of the epithelium.
Although one has to keep in mind that results derived from experiments in mice are not necessarily applicable to humans, the present data indicate that a functional M1R conserves a partial particle transport speed response to acetylcholine and that activation of M2R can reduce the response to ATP. Since M2R and M3R mediate bronchoconstriction in mice 21, selective targeting of the M2R and the M3R might also be sufficient to antagonise cholinergic bronchoconstriction in humans. Blocking M3R and M2R and sparing the M1R would not compromise anticholinergic bronchodilator efficiency but could reduce negative effects on cilia-driven particle transport. The current results also indicate that muscarinic receptors are dispensable during the formation of the airway epithelium.
Support statement
M.K. Klein received a scholarship from the Deutsche Pneumologische Gesellschaft (Werne, Germany). P. König received a young scientist grant from the Dept of Medicine of the Justus-Liebig-Universität Giessen (Giessen, Germany) and a grant from the Medical Faculty of the University of Lübeck (no. A31-2007; Lübeck, Germany). The study was supported by the Deutsche Forschungsgemeinschaft, Excellence Cluster Cardiopulmonary System (Bonn, Germany).
Statement of interest
A statement of interest for W. Kummer can be found at www.erj.ersjournals.com/misc/statements.dtl
Acknowledgments
Affiliations are as follows. M.K. Klein, P. Hartmann, P. Faulhammer, K.S. Lips and W. Kummer: Institut für Anatomie und Zellbiologie and University of Giessen Lung Center, Justus-Liebig-Universität Giessen, Giessen, Germany. R.V. Haberberger: Institut für Anatomie und Zellbiologie and University of Giessen Lung Center, Justus-Liebig-Universität Giessen, and Anatomy and Histology, Flinders University, Adelaide, SA, Australia. B. Krain: Institut für Anatomie und Zellbiologie and University of Giessen Lung Center, and Abteilung für Anaesthesie, Operative Intensivmedizin, Schmerztherapie, Justus-Liebig-Universität Giessen. J. Wess: Laboratory of Bioorganic Chemistry, National Institute of Diabetes and Digestive and Kidney Diseases, Bethesda, MD, USA. P. König: Institut für Anatomie, Zentrum für Medizinische Struktur- und Zellbiologie, University of Lübeck, Lübeck, and Institut für Anatomie und Zellbiologie and University of Giessen Lung Center, Justus-Liebig-Universität Giessen, Giessen, Germany.
The authors thank D. Drenckhahn (Julius-Maximilians-Universität Würzburg, Würzburg, Germany) for the kind gift of the villin antibody and S. Wiegand (Justus-Liebig-Universität Giessen, Giessen, Germany) for expert animal breeding.
Footnotes
-
This article has supplementary material accessible from www.erj.ersjournals.com
- Received January 31, 2008.
- Accepted December 1, 2008.
- © ERS Journals Ltd
References


