


Abstract
Leptin is a powerful stimulant of ventilation in rodents. In humans, resistance to leptin has been consistently associated with obesity. Raised leptin levels have been reported in subjects with sleep apnoea or obesity–hypoventilation syndrome. The aim of the present study was to assess, by multivariate analysis, the possible association between respiratory centre impairment and levels of serum leptin.
In total, 364 obese subjects (body mass index ≥30 kg·m−2) underwent the following tests: sleep studies, respiratory function tests, baseline and hypercapnic response (mouth occlusion pressure (P0.1), minute ventilation), fasting leptin levels, body composition and anthropometric measures. Subjects with airways obstruction on spirometry were excluded.
Out of the 346 subjects undergoing testing, 245 were included in the current analysis. Lung volumes, age, log leptin levels, end-tidal carbon dioxide tension, percentage body fat and minimal nocturnal saturation were predictors for baseline P0.1. The hypercapnic response test was performed by 186 subjects; log leptin levels were predictors for hypercapnic response in males, but not in females.
Hyperleptinaemia is associated with a reduction in respiratory drive and hypercapnic response, irrespective of the amount of body fat. These data suggest the extension of leptin resistance to the respiratory centre.
Obese subjects have respiratory impairment 1 due to the increment of total body fat, which produces diminished compliance and increased resistance and work of breathing. In addition, a significant proportion suffer from obstructive sleep apnoea. A small subgroup, most of whom have sleep apnoea syndrome, have diurnal hypoventilation with hypoxaemia and hypercapnia 2. Standard pulmonary function tests show a mild decrease in forced vital capacity (FVC) and forced expiratory volume in one second (FEV1), and a more evident reduction in expiratory reserve volume (ERV). Most of these subjects have an increased respiratory drive 3 and a diminished hypercapnic response. The latter is especially true in subjects with the obesity–hypoventilation syndrome 3, 4. These alterations are explained mainly by mechanical factors, as the extra fat load provokes a higher work of breathing and obstruction of the upper airways during sleep.
Some authors have, however, proposed the involvement of several adipose-derived factors 5, 6. In this context, leptin has emerged as a relevant adipokine playing a role as a stimulant of ventilation 5, with levels being raised in subjects with sleep apnoea syndrome or obesity–hypoventilation syndrome 6. The reason for this elevation is attributed either to stimulation by hypoxia or to leptin insensitivity in obese subjects. In general, subjects with hypoventilation seem to exhibit higher levels of leptin for a given amount of body fat.
The aim of the present study was to assess the relationship between hyperleptinaemia and respiratory centre parameters after adjusting for respiratory impairment and the severity of obesity (sleep apnoea, nocturnal desaturation, restrictive pattern, percentage of body fat and fat distribution, age and sex), taking into account menopausal status in females. Serum leptin levels correlate mainly with body fat percentage and logarithmic transformation improves linear correlation. Thus, log serum leptin was chosen as an independent variable.
METHODS
Subjects
Obese adult subjects (≥17 yrs old and body mass index (BMI) ≥30 kg·m−2) referred for obesity treatment were included in the current analysis. Those with a diagnosis of restrictive pulmonary disease, neuromuscular disease or a previous pulmonary resection were excluded. Subjects with an obstructive spirometry pattern defined as an FEV1/FVC <70% were also excluded. The protocol of the study was approved by the local Ethics Committee.
Body composition
Body fat percentage was assessed by air displacement plethysmography (Bod-Pod®; Life Measurements, Concord, CA, USA), which is a previously validated bicompartmental method 7. Waist and hip circumference were measured in all patients using a standard method 8. Waist circumference was measured at the midpoint between the lateral lower ribs and the iliac crest, and hip circumference was measured at the level of the greatest extension of the hips.
Serum leptin levels
Fasting leptin levels were measured by a double antibody radioimmunoassay technique (Linco Research Inc., St Charles, MO, USA). Intra- and inter-assay coefficients of variation were 5.0 and 4.5%, respectively.
Polysomnographic study
Those patients not previously tested underwent a polysomnographic study. Nocturnal sleep was recorded with Harmonie 5.2 (Stellate, Montreal, QC, Canada) using Lamont 32-Sleep amplifiers (Lamont Medical, Madison, WI, USA). The recordings included seven electroencephalogram channels referenced to both balanced mastoids, right and left electroculogram, oxygen saturation, airflow thoraco-abdominal bands, body position sensor and electrocardiogram. Apnoea was defined as cessation of nasal or oral airflow for ≥10 s. Hypopnoea was defined as a 50% decrease in the airflow channel for 10 s. The apnoea/hypopnoea index (AHI) was calculated as the mean number of apnoeic and hypopnoeic events per hour of sleep. The hypnogram was visually analysed off-line following standard criteria, while the programme automatically calculated the AHI and the frequency and severity of oxygen desaturations.
Lung function tests
Spirometry was performed with a calibrated, dry-rolling seal spirometer (SensorMedics 2130 System; SensorMedics Co., Yorba Linda, CA, USA) according to current guidelines. Static lung volumes were measured by body plethysmography (SensorMedics V6200 Autobox; SensorMedics Co.). The predicted values used for spirometric and thoracic gas volumes were those of the 1993 European update 9.
Patients underwent ventilatory drive assessment, including minute ventilation (V′E), tidal volume(VT), inspiratory time (tI), mouth occlusion pressure at 0.1 s of inspiration (P0.1) and end-tidal carbon dioxide tension (PET,CO2). P0.1 was measured using the method described by Whitelaw et al. 10. The occlusion pressure valve was automatically occluded at random every 2–6 respiratory cycles, using software provided by SensorMedics. The hypercapnic response was assessed by the method described by Read 11 and the slope of P0.1/PET,CO2 and V′E/PET,CO2 was calculated by the minimal square regression method.
Statistical analysis
Variables are shown as mean±sd. The effect of sex, menopausal status and obstructive sleep apnoea syndrome (OSAS) on the descriptive variables was initially analysed by Mann–Whitney U-test and the Chi-squared test. Bivariate correlations were studied using Spearman’s rho correlation.
P0.1 analysis
Multivariate analysis was performed as a stepwise linear regression model with baseline P0.1 as the dependent variable and age, sex, height, waist circumference, % body fat, total lung capacity (TLC) % predicted, baseline PET,CO2, log serum leptin level, AHI and minimal and mean nocturnal oxygen saturation as independent variables. Male and female subjects were analysed both together and as separate groups. Menopausal status was included as an independent variable in the analysis of the females. The criteria for inclusion of variables into the stepwise linear regression were p in 0.05, p out 0.10 and minimal tolerance threshold (1-r2) of 0.01. A listwise exclusion for multivariate analysis was performed.
Hypercapnic response
The analysis of the hypercapnic response was performed with the same independent variables and slope of response (P0.1/PET,CO2) as the dependent variable. A similar regression analysis was performed using V′E/PET,CO2 as the dependent variable.
RESULTS
Descriptive data
In total, 364 subjects were included in the present study. Descriptive variables and differences between sex and between pre- and post-menopausal females are shown in table 1⇓. The number of subjects undergoing the different tests is shown in table 2⇓. Following exclusion of missing values from the multivariate analysis, 245 subjects were included in analysis of baseline respiratory centre assessment and 186 in the hypercapnic response assessment.
Subject characteristics and comparison by sex and menopausal status
Number of subjects who underwent each test
Sleep studies were performed in 194 females and 104 males. The AHI was between 5 and 30 ·h−1 in 29.7 and 23.3% of females and males, respectively, and >30 ·h−1 in 15.1 and 44.7% of females and males, respectively (p<0.001).
Respiratory drive measurements were not different between subjects with or without OSAS (AHI> or <15 ·h−1, respectively) after stratifying by sex, as shown in table 3⇓. Subjects with OSAS had a greater BMI, a larger waist circumference and a higher respiratory impairment.
Differences between subjects with and without obstructive sleep apnoea syndrome(OSAS) stratified by sex
The relationship between the percentage of body fat and leptin improved with logarithmic transformation; the linear correlation between leptin and percentage of body fat was stronger using log leptin (R = 0.629) rather than leptin (R = 0.565). The correlation of body fat and log leptin was 0.342 and 0.513 for females and males, respectively.
Bivariate correlations
Bivariate correlations are shown in tables 4⇓, 5⇓ and 6⇓ for P0.1, hypercapnic response by P0.1 and hypercapnic response by minute ventilation, respectively. Each table provides data for the whole sample, males and females.
Spearman’s rho bivariate correlations for baseline mouth occlusion pressure (P0.1)
Bivariate correlations with hypercapnic response(mouth occlusion pressure/end-tidal carbon dioxide tension (PET,CO2))
Bivariate correlations for hypercapnic response(minute ventilation/end-tidal carbon dioxide tension (PET,CO2))
Multivariate analysis models
The multivariate analysis included the following variables: age, obesity parameters (percentage of body fat and fat distribution), log leptin levels, pulmonary function (TLC % pred) and sleep study parameters (AHI, minimal and mean nocturnal saturation). Analysis of the whole group included sex as a variable, and the analysis of females included menopausal status. After bivariate analysis, waist–hip ratio and waist circumference were used as a measurement of fat distribution in males and females, respectively.
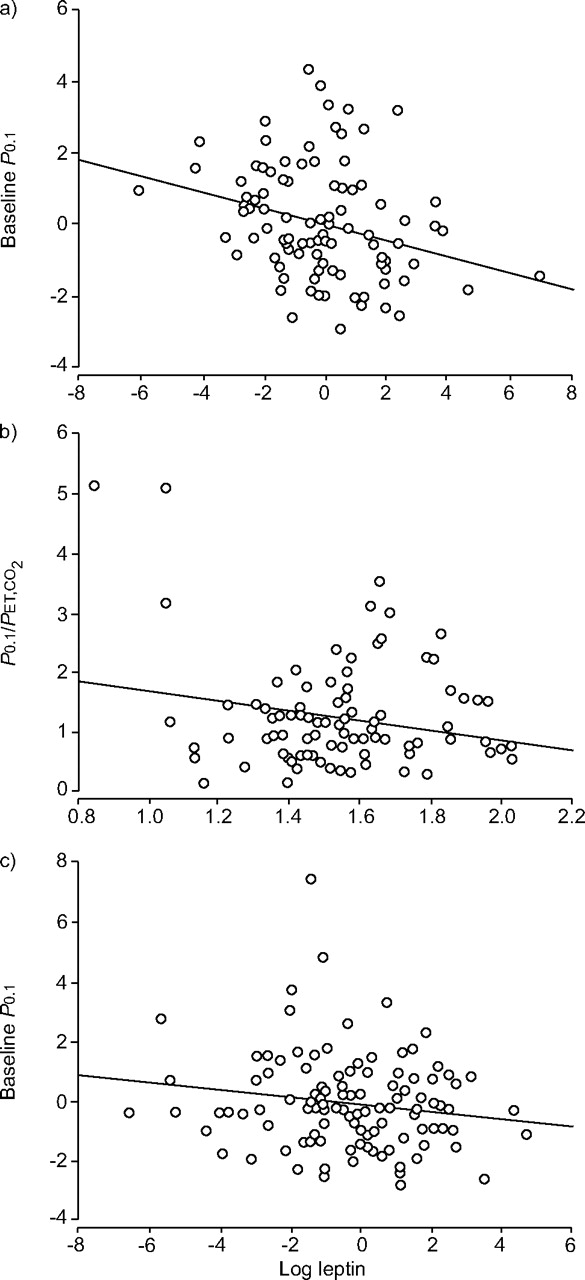
The results of the multiple linear regression analyses are summarised in table 7⇓. Figure 1⇓ shows significant adjusted partial correlation between log leptin levels and P0.1 in males and pre-menopausal females and log leptin levels and hypercapnic response in males, after the multivariate analysis. Other partial correlations between respiratory centre parameters and significant variables after multivariate analysis are shown in the supplementary material.

Partial correlations between log leptin levels and respiratory control parameters that were significant in the multivariate analysis. a) Partial correlation between log leptin levels and baseline mouth occlusion pressure (P0.1) in males after adjusting multivariate analysis. r2 = 0.0795. b) Correlation between log leptin levels and delta P0.1/end-tidal carbon dioxide tension (PET,CO2) in males. r2 = 0.0406. c) Partial correlation between log leptin levels and baseline P0.1 in pre-menopausal females after adjusting multivariate analysis. r2 = 0.0253.
Regression models for ventilatory control parameters by sex and menopausal status
Baseline P0.1
The variables associated with P0.1 in the whole sample were age, percentage of body fat, log leptin levels, TLC % pred, baseline PET,CO2 and minimal nocturnal saturation. In males, the associated variables were percentage of body fat, log leptin levels, TLC % pred, baseline PET,CO2, minimal nocturnal saturation and waist–hip ratio. In this group, log leptin levels accounted for a change in r2 of 0.029, with a p-value for the change in F of 0.050. The analysis in females showed a significant association with log leptin levels in pre-menopausal but not in post-menopausal females, which accounted for a change in r2 of 0.05 (p = 0.017). The other explanatory variables in this group were age, percentage of body fat and PET,CO2.
Hypercapnic response
The multivariate analysis for hypercapnic response showed that the explained variability of the slope of P0.1/PET,CO2 was 5.6% (p = 0.002), with height and leptin levels as the only explanatory variables. The separate analyses showed that log leptin level was the only explanatory variable in males (r2 = 0.051; p = 0.027), but was not an explanatory variable in females.
The regression analysis for V′E/PET,CO2 showed an explained variability of 26.1% (p<0.001), with height and log leptin levels as independent variables. The separate analyses showed that height was the only explanatory variable in males. In pre-menopausal females, height and waist were explanatory variables; in post-menopausal females, TLC % pred was the only independent variable.
DISCUSSION
The present study demonstrates that in obese patients, higher concentrations of serum leptin are associated with a reduced respiratory drive and a reduced hypercapnic response. As leptin is a stimulant of ventilation, these results suggest an extension of leptin resistance to the respiratory centre. Clinical studies of obesity–hypoventilation syndrome have suggested an association between respiratory drive and leptin but this has not previously been demonstrated.
Leptin, the product of the Ob gene, is a protein secreted by adipocytes that regulates body weight 12–14 by increasing satiety and reducing food intake. Serum leptin levels correlate with body fat percentage 15. It has been shown that, in mice, leptin deficiency induced by an Ob gene mutation is associated with morbid obesity, hyperphagia, insulin resistance and hypoventilation. Seminal studies in animals describe the characteristic hypoventilation of mice associated with Ob mutation and the subsequent improvement with exogenous leptin administration, even before the consequent reduction in body weight 5. Prolonged treatment (6 weeks) with leptin in leptin-deficient mice modifies the animal's ventilatory pattern, increases lung compliance and restores the abnormal adaptation of the diaphragm 16. While most obese subjects have markedly increased levels of plasma leptin, only a few cases of human genetic abnormalities of leptin have been reported. Obesity has been postulated to be a state of leptin resistance. Two distinct mechanisms of resistance have been proposed in human obesity: an impaired transport of leptin across the blood–brain barrier 17, 18 and altered signalling pathways or receptors. Leptin resistance can also be induced by feeding animals a high-fat diet 19.
The possible interaction between leptin and ventilatory parameters in humans is not as clear as that seen in animal models. Most of the studies in this regard have investigated the relationship between leptin levels, sleep apnoea syndrome and obesity–hypoventilation syndrome. However, there are no studies assessing the relationship between the respiratory centre and leptin in humans.
Compared with BMI-matched controls, higher plasma levels of leptin are described in hypercapnic obese subjects and those with OSAS 20, 21. Furthermore, treatment of the latter with continuous positive airway pressure reduces plasma leptin levels 22–26. Possible explanations for the reduction in leptin levels after treatment include a change in fat distribution 25, an improvement in sympathetic function 27 or an improvement in leptin sensitivity. However, the existence of an independent association between leptin and OSAS is controversial. Some studies have failed in their attempts to demonstrate the existence of this relationship, independent of adiposity 26, 28.
Another hypothesis is that hypoxaemia causes leptin secretion; this has been shown in experimental studies 29. In this hypothesis, leptin resistance and hyperleptinaemia might not cause hypoventilation but might be caused by it. Tatsumi et al. 30 studied 96 male nonobese patients with OSAS and 52 male patients without OSAS matched for BMI, and found that the average arterial oxygen saturation (Sa,O2) and lowest Sa,O2 were explanatory variables for serum leptin values, but AHI, BMI, visceral fat or subcutaneous fat were not. These results suggest that the elevation of leptin levels was a consequence of hypoxia and not of fat accumulation.
The present study analysed a larger size sample (245 subjects) than in previous studies, and in addition to body composition, also took into account fat distribution, nocturnal saturation, AHI, pulmonary function and sex. Leptin levels were an independent factor of respiratory drive, independent of apnoea events, nocturnal saturation, restrictive impairment or fat distribution. There are no previous studies in humans that analyse correlate respiratory drive measurements with leptin, although the relationship between hypercapnia and circulating leptin levels has been reported. However, as the present study is a cross-sectional study, the results cannot imply causality. These results are significant in the whole sample and in males, but the association in females could not be demonstrated. The association is weak, and log leptin levels account only for a 2.9 and 6.3% of the variance of baseline P0.1 and delta P0.1/PET,CO2 in males, so the size of the sample and the differences in the behaviour of leptin in females might explain the lack of significance in females.
Phipps et al. 6 found higher serum leptin levels in subjects with obesity–hypoventilation syndrome than in subjects with the same amount of body fat but without hypoventilation; the severity of OSAS had no effect. Shimura et al. 31 studied 185 male patients with OSAS (106 eucapnic and 79 hypercapnic) in which visceral and subcutaneous fat distribution was assessed by computed tomography. They found that leptin, and not fat distribution, was the only predictor of hypercapnia. No association was found between circulating leptin levels and AHI, nocturnal mean and nadir oxygen saturation, percentage of FVC, FEV1/FVC or fat content. They suggest that hypoventilation in OSAS is partly due to depressed sensitivity to leptin in the CNS.
One limitation of the present study is that arterial blood gas analysis was not performed, so it is impossible to be certain as to how many of the present study’s subjects had established hypoventilation–obesity syndrome.
In the present study, respiratory drive measured as baseline P0.1 was increased with respect to other studies 32, 33, although a control group assessment was not performed. There was a significant and independent correlation between the presence of a restrictive impairment and the increment in respiratory drive, as has been seen in obese subjects. This suggests a stimulation of the respiratory centre by the increased work of breathing. Respiratory drive also correlated positively with the severity of obesity defined as percentage body fat, and inversely with baseline PET,CO2, age and minimal nocturnal saturation. The nadir Sp,O2 was an independent variable for baseline P0.1 in males and post-menopausal females. The respiratory centre parameters were not different between subjects with and without OSAS.
Bivariate analysis did not demonstrate significant correlations between AHI and ventilatory control parameters, although there were significant correlations with nocturnal saturation indices. However, the effect of respiratory disorders during sleep was also assessed by including AHI and minimal and mean nocturnal saturation in the multivariate analysis.
No association was found between the AHI or saturation parameters with hypercapnic response. Studies have found that the hypercapnic response is increased in obese females irrespective of the presence of sleep apnoea syndrome, whereas the hypoxic response is significantly increased in obese females with OSAS compared with obese females without OSAS 34.
The hypercapnic response in males, measured by the increase in minute ventilation, had a strong correlation with height, as height correlates with absolute TLC and baseline minute ventilation. In females this response correlated with height but also with the presence of a restrictive pattern and waist circumference, probably reflecting mechanical limitations for ventilation.
Differences in variables between sexes were analysed. Several obesity and respiratory variables, but not BMI, were significantly different between males and females. Females had a different fat distribution, higher circulating leptin levels and a greater percentage of body fat, but fewer alterations in lung volumes and fewer and milder respiratory disorders during sleep. Sexual dimorphism in leptin levels has been repeatedly reported 35. This finding may be attributed to the different distribution of fat in both sexes, as visceral fat produces less leptin and is found in higher proportion in males. However, no effect of female sex or menopausal status was found on the respiratory centre measurements.
In conclusion, a lower respiratory drive in obese subjects is associated with higher serum leptin levels, adjusted by ventilatory parameters, age, severity of obesity, apnoea–hypopnoea index and nocturnal saturation. In males higher leptin levels are also associated with a lower hypercapnic response. These results suggest an extension of leptin resistance to the respiratory centre in obese subjects.
Acknowledgments
The authors wish to thank T. Jimenez and E. de Miguel (Pulmonary Function Laboratory, Dept of Pulmonary Medicine, University of Navarra, Pamplona, Spain) for their invaluable technical assistance.
Footnotes
-
This article has supplementary material accessible from www.erj.ersjournals.com.
- Received August 31, 2006.
- Accepted April 10, 2007.
- © ERS Journals Ltd
References


