


Abstract
It was hypothesised that the recruitment of atelectatic lung areas is signified by changes in the airway and tissue mechanics, and by the appearance of crackle activity attributed to the sudden reopening of collapsed airways. The authors also assumed that the acoustic activity is an earlier indicator of lung recruitment than the change in the overall mechanical state of the lungs.
Six thoracotomised and mechanically ventilated mini-pigs were studied. Low-frequency pulmonary impedance was measured at end-expiratory pauses at transpulmonary pressures of 4 and 1 hPa to estimate airway resistance (Raw) and the coefficient of lung tissue elastance (H), and tracheal sounds were recorded during subsequent slow inflations to 30 hPa, in the control state and following increasing doses of i.v. methacholine (Mch).
Raw and H were higher at baseline and increased more in response to Mch at 1 hPa than at 4 hPa. The crackles detected during the subsequent inflations were concentrated around and associated with the development of the lower knee of the pressure–volume curve. The number of crackles increased faster following the Mch doses and reached statistical significance earlier than Raw and H.
Crackle recording during mechanical ventilation can be employed as a simple method with which to monitor lung recruitment–derecruitment.
Mechanical ventilation in clinical situations associated with a lung function impairment requires close monitoring of pulmonary mechanical parameters in order to establish the appropriate therapeutic strategy. In lung diseases, different degrees of bronchoconstriction, airway collapse and parenchymal dysfunction due to surfactant damage and/or oedema formation are observed 1. Although these mechanisms are often intricate, the resulting lung function impairment in diseases such as asthma 2–5, chronic obstructive pulmonary disease 5–8, cystic fibrosis 5, 9, 10 and acute respiratory distress syndrome 5, 11–18 primarily affects the lung periphery. It is therefore essential to employ a method that provides an objective assessment of the patency of the peripheral airways.
Pulmonary function in mechanically ventilated patients can be assessed by monitoring the ventilator waveforms at the airway opening 2, 3, 5, 7, 9, 12, 18 and by measuring lung mechanical parameters, such as resistive and elastic properties elucidated by the interrupter technique 8, 13, 14 or the forced oscillatory method 8, 19. At most, however, these techniques only provide indirect information about the lung periphery. The patency of the peripheral airways can be assessed qualitatively by analysing the lower inflection point of the static pressure–volume (P–V) curve 1, 5, 11, 15–18, 20, 21. Although the shape of the P–V curve around the lower inflection point depends on many factors, such as chest wall tissue non-linearities 16, surfactant redistribution 17, 22, collapse and reopening of the alveoli and bronchi 15, 21, and dynamic hyperinflation 18, it is the analysis of the P–V relationships of the respiratory system that has afforded the most comprehensive data on pulmonary recruitment 1, 15, 17, 20, 21. Quantitative analysis of the small airway function can also be accomplished by using lung-imaging techniques, such as thoracic computed tomography or magnetic resonance imaging 23, although performance of these investigations in a continuous bedside setting is not yet feasible.
The present study focuses on the elementary phenomena of the recruitment process. The sudden reopening of closed airways is accompanied by short transient sounds called “crackles”; these acoustic events can be detected during chest auscultation in a number of lung diseases 24–29. Although crackle sounds have been studied extensively in vitro in collapsed lungs 30–33, the potential of acoustic measurements for the detection of airway recruitment in vivo has not been exploited. Accordingly, the authors set out to investigate whether the recording of crackles can be used to detect the involvement of airway closure in compromised lung function in vivo. The changes in airway resistance (Raw) and the coefficient of lung tissue elastance (H) demonstrated that the administration of methacholine (Mch) in increasing doses elicited progressive airway closure, which was facilitated by a decreased lung volume.
METHODS
Animal preparation
After approval had been granted by the Ethics and the Animal Care Committees of the Canton of Geneva (Geneva, Switzerland), six adult mini-pigs (17–25 kg) were studied in the supine position. The animals were anaesthetised by the inhalation of sevoflurane (up to 5%) until an i.v. line was secured into the ear; thiopentone (10 mg·kg−1) was then injected i.v. The mini-pigs were next tracheotomised with a polyethylene cannula (6.5 mm internal diameter (ID); Portex, Hythe, UK) and mechanically ventilated (Model 900C; Siemens-Elema, Solna, Sweden) with a tidal volume of 7–10 mL·kg−1 at a frequency of 15·min−1 and an inspired oxygen fraction of 0.3 in air. A continuous infusion of fentanyl (10 µg·kg−1·h−1) via the ear vein was maintained throughout the study to ensure adequate analgesia. Anaesthesia was maintained by the i.v. injection of thiopentone (5 mg·kg−1) every 45–60 min. The carotid artery was prepared surgically in a sterile manner and cannulated (28-gauge catheter; Braun, Melsungen, Germany) for blood sampling and continuous arterial blood pressure monitoring with a calibrated pressure transducer (model 156 PC 06-GW2; Honeywell, Zürich, Switzerland). The jugular vein was prepared in the same way as the femoral artery and cannulated for delivery of the constrictor agonist. Muscle relaxation was achieved by the i.v. administration of pancuronium (0.2 mg·kg−1). The thorax was opened by means of a midline thoracotomy following an additional i.v. bolus of fentanyl (25 µg·kg−1) and the ribs were widely retracted. Following chest opening, a positive end-expiratory pressure (PEEP) of 4 hPa was applied.
The airway pressure was measured continuously with a calibrated pressure transducer (Validyne DP 45, Validyne Inc., Northridge, CA, USA). The rectal temperature, monitored with a temperature sensor (Thermalert, model TH-8; Physitemp, Clifton, NJ, USA), was maintained at 37±0.5°C with a heating pad (Miostar, Zürich, Switzerland).
Arterial blood samples were analysed radiometrically (model 505; Acid Base Laboratory, Copenhagen, Denmark) and, if necessary, the mechanical ventilation parameters were adjusted to maintain normal gas exchange. The concentrations of O2 and CO2 were monitored throughout the study (UltimaTM; Datex/Instrumentarium, Helsinki, Finland).
Measurement apparatus
The set-up used for the forced oscillatory impedance measurements and the recording of intratracheal crackle sounds is shown schematically in figure 1⇓.

Experimental set-up for the measurement of pulmonary input impedance and crackles in the pigs. Taps A, B and C were adjusted according to the phases of ventilation, forced oscillation or slow inflation. PL: transpulmonary pressure; V′: gas flow.
Forced oscillations
The measurement system for collection of the input impedance spectra of the pulmonary system (ZL) in the mini-pigs was similar to that used previously in other mammals and humans 30, 34. Briefly, the tracheal cannula was detached from the respirator and connected to a loudspeaker-in-box system at end expiration. The pressure in the box chambers was set to the level of PEEP to keep the mean transpulmonary pressure (PL) constant during the measurements. The loudspeaker delivered a computer-generated small-amplitude (<1 hPa) pseudo-random signal between 0.5–21 Hz through a screen pneumotachograph (11 mm ID), which was used to measure the gas flow (V') with a differential pressure transducer (model 33NA002D; ICSensors, Malpitas, CA, USA). An identical pressure transducer was used to measure the tracheal pressure with reference to atmosphere (PL) via a catheter positioned 1–2 cm beyond the end of the endotracheal tube.
The PL and V' signals were low-pass filtered at 25 Hz and sampled with an analogue–digital board of a microcomputer at a rate of 256 Hz. The inspired volume was obtained by numerical integration of V'. Fast Fourier transformation with 4-s time windows and 95% overlapping was used to calculate ZL (ZL = PL/V') from the 10-s recordings.
Estimation of airway and parenchymal parameters
The airway and parenchymal mechanical properties were separated by fitting a model 34 to the ZL spectra by minimising the differences between the measured and modelled impedance values. The model consisted of an airway compartment containing Raw and Iaw (airway inertance), and a constant-phase tissue unit characterised by damping (G) and H:
ZL = Raw+jωIaw+(G−jH)/ωα
where j is the imaginary unit, ω is the angular frequency (2πf), and α is (2/π) arctan (H/G).
Crackle measurements
The technique for the measurement of the sound pressure field generated by airway reopenings was similar to that described previously 30, 32. A commercial miniature microphone (5×5 mm) was suspended beyond the end of the tracheal cannula for the recording of tracheal sounds during slow inflations. The electrical signal of the microphone was amplified and sampled at a rate of 22,050 Hz by another computer.
The sound recordings were first high-pass filtered at 2 kHz in order to enhance the sharp initial transients of the crackles and suppress the cardiac noise 30, thereby improving the temporal resolution of the superimposed crackles. Figure 2⇓ presents an example of the original sound, the high-pass filtered sound, and the lung inflation pressure and volume following the i.v. injection of a 40 µg·kg−1 Mch bolus when a PEEP of 4 hPa was maintained. It can be seen that, although the cardiac noise largely masked the crackles in the raw recording, the high-pass filtering diminished the cardiac noise in the tracheal-sound recording. The majority of the crackles, including the most intense ones, appeared in the first third of the inflation. After pre-processing, the maximum levels of background noise were estimated in each recording from the baseline and the end-inflation segments that were free of crackles, and a threshold was determined for the minimum crackle amplitude. The recordings were then divided into short intervals and the sound energy was computed for each interval. The occurrence of a crackle was defined as when the increase in sound energy in two successive intervals exceeded a preset value (fig. 3⇓). During the crackle measurements, the PL and V' signals were also recorded to monitor the lung inflation pressure and volume.

Tracings of a) the original and b) the high-pass filtered crackle sound pressure, with c) the inspired volume (———) and transpulmonary pressure (- - - - -) during the inflation of a lung.
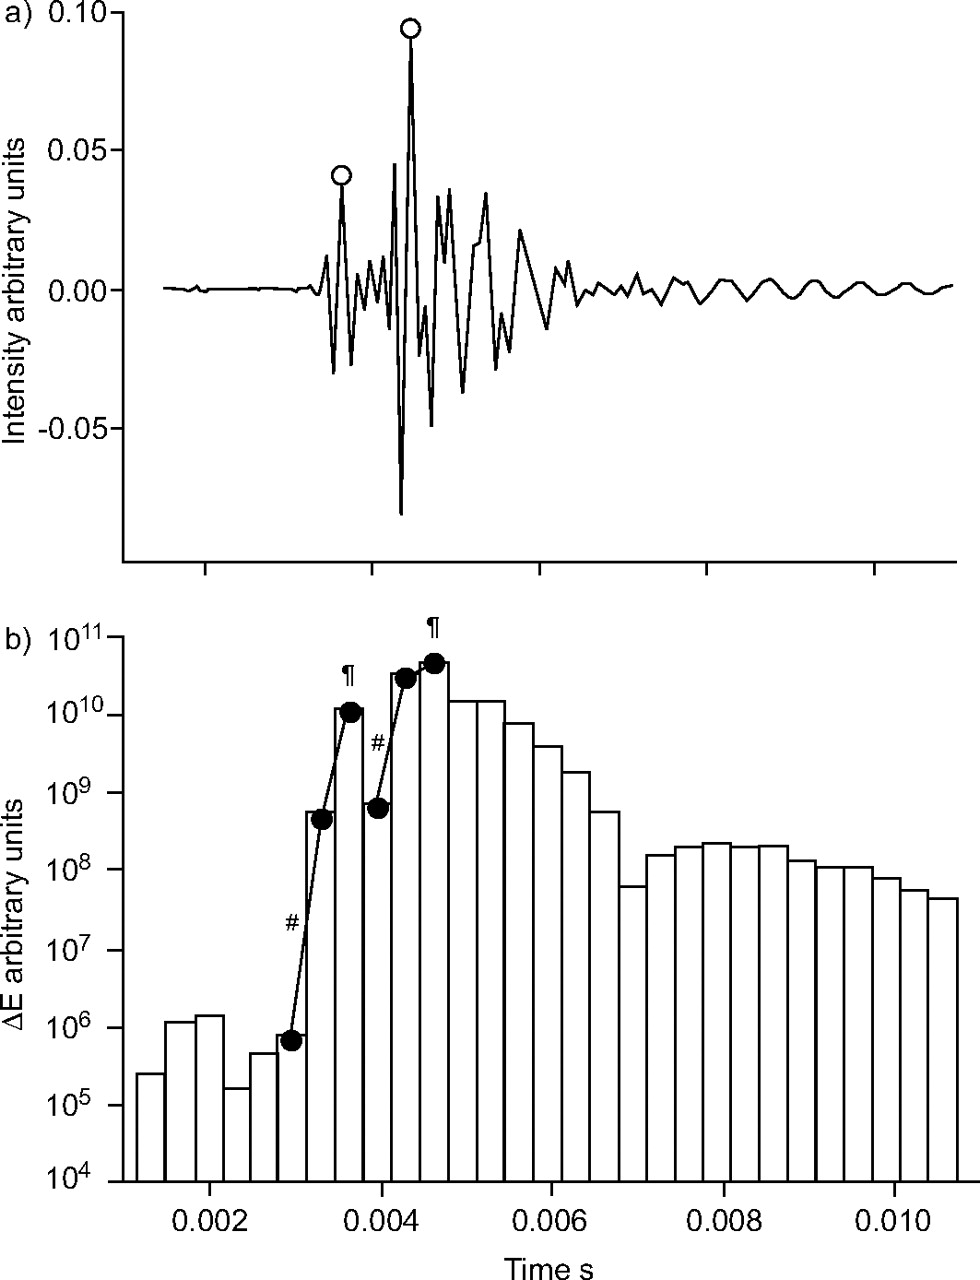
a) A short segment of sound recording with superimposing crackles to illustrate the method of identification of the location and amplitude of crackles (○). b) Sound energy (ΔE) is calculated for successive 0.33-ms intervals. A crackle is identified when the increase in ΔE between two successive intervals exceeds a pre-determined (e.g. a three-fold) value (#); if there is a further increase, the crackle amplitude is taken as the extreme value in the next interval (¶).
Study protocol
Before the measurements, two inspiratory cycles were superimposed to standardise the volume history of the lungs. The mechanical ventilation was suspended at a PEEP level of 4 hPa, and ZL was recorded during the resulting short (10-s) apnoeic period. Before mechanical ventilation was resumed, the lungs were slowly (over ∼45 s) inflated to a peak pressure of 30 hPa, during which period the intratracheal crackles were recorded. Following an ∼2–5-min period of mechanical ventilation, the baseline ZL and crackle measurements were repeated. Resumed mechanical ventilation was followed by the i.v. administration of a 5 µg·kg−1 Mch bolus. The crackles were recorded 30 s following the injection, ZL and immediately afterwards. Subsequent Mch challenges were made in the same way, by administering increasing doses of Mch: 10, 20 and 40 µg·kg−1. After completion of the Mch challenges at a PEEP level of 4 hPa, PEEP was decreased to 1 hPa to facilitate lung derecruitment. The experimental procedure was then repeated while this pressure level was maintained during the ZL recordings, and the subsequent inflation was also started from 1 hPa.
The ZL data measured under the control conditions were averaged and fitted by the model. The numbers of crackles obtained in the two baseline recordings were also averaged. The model parameters obtained from the ZL spectra collected following the Mch challenges were used to characterise the lung mechanics under these conditions. The lack of mechanical ventilation between the ZL measurement and the crackle recording guaranteed that these measurements reflected the same lung condition.
Statistical analysis
The precision of the parameters is expressed as mean±sem. The Kolmogorov–Smirnov test was used to test data for normality. Two-way repeated measures ANOVA using a linear mixed model was used to test significance with two within-subject factors: the Mch dose and the PEEP level. In the mixed model, a composite covariance model with separate covariance structures was specified for each of the repeat factors: equal correlations were assumed for the PEEP and a first-order autoregressive covariance structure was applied for the Mch dose. The choice of these covariance models was verified with likelihood ratio tests. For pairwise comparisons, 95% confidence intervals for the differences were computed by taking into account the significant interactions between the factors. Since the crackle number was not normally distributed, the changes in this parameter were tested after logarithmic transformation. The significance level was set at p<0.05.
RESULTS
The pulmonary mechanical parameters under control conditions and following Mch challenges at both mean PL levels are presented in figure 4⇓. With the exception of Iaw, all parameters were greater at the low PL than those at 4 hPa. The response to Mch was more pronounced when the low lung volume was maintained: the parameter values at 40 µg·kg−1 Mch, expressed as percentages of the control values, were significantly higher at the mean PL of 1 hPa than at 4 hPa (Raw: 1,165±188% versus 602±162%, p = 0.045; G: 679±141% versus 407±94%, p = 0.031; and H: 112±28% versus 84±29%, p = 0.040). Iaw did not change statistically significantly after any of the Mch doses administered at the PL of 4 hPa, but it fell significantly at the highest Mch dose at 1 hPa (−859±364%).

a) Airway resistance (Raw) and b) inertance (Iaw), c) tissue damping (G) and d) elastance (H) under the control conditions (C) and following the administration of increasing boluses of methacholine, estimated at mean transpulmonary pressures (PL) of 4 hPa (•) and 1 hPa (○). Data are presented as mean±sem in the six pigs. *: p<0.05.
An example of the inflation PL–V curves and the distributions of the number of crackles, obtained under the control conditions and after the two highest doses of Mch at both PL levels, is presented in figure 5⇓. At a PL of 4 hPa, the bottom knee (the lower inflexion point) of the PL–V diagram was not apparent until the highest doses of Mch, whereas it was typically observed even under the control conditions at 1 hPa. It is worth noting that, in general, crackle intensity increased significantly before the PL–V curve exhibited any alteration indicative of the development of the bottom knee (fig. 5c⇓). The histograms of the crackles exhibited their maxima at or slightly above the bottom knee and decayed rapidly around the highest slope of the PL–V curve. The crackles disappeared before the upper knee (the upper inflexion point) of the PL–V diagram was reached.

Inspired volume and number of crackles versus transpulmonary pressure (PL) from a typical experiment. a, c and e) show inflations from a PL of 4 hPa under the control conditions and after 20 and 40 mg·kg−1 of methacholine, respectively. b, d and f) relate to the corresponding inflations from a PL of 1 hPa in the same animal.
The relationships between the values of Raw measured after the Mch challenges at both mean PL and the crackle number recorded during the subsequent inflations are depicted in figure 6a⇓. Increasing doses of Mch induced progressive increases in both Raw and crackle number, with the elevations from the control values first being statistically significant in the crackles. The decrease in PL led to increases in both Raw and crackle intensity. Similar relationships can be observed between H and crackle number (fig 6b⇓), where the faster increase in crackle number as compared with that in H is more pronounced, especially at a PL of 4 hPa; the number of crackles is statistically significantly higher than the control level at the first dose of Mch, whereas H reaches statistical significance only at the second-highest dose. There is also a marked difference between the maximum changes in the number of crackles and H, with an average 38-fold rise in the crackle number between the control level and the highest Mch dose, whereas the corresponding increase in H is only around two-fold. Similar relationships were found between G and the number of crackles (data not shown). The earlier response in the crackle number to the constrictor challenge, as compared with the changes in the pulmonary mechanical parameters, is less marked at the lower lung volume (PL of 1 hPa), where the crackle activity was already considerable (>1,000) under the control conditions. The mean values and 95% confidence intervals for the differences in Raw, H and the natural logarithm of the number of crackles are listed for both mean PL levels and all Mch doses in the supplementary data available online.

Relationship between a) airway resistance (Raw) and the number of crackles and between b) tissue elastance (H) and the number of crackles in the six mini-pigs under control conditions and following the administration of increasing doses of methacholine (Mch). •: control, positive end-expiratory pressure (PEEP) of 4 hPa; ▾: Mch 5 µg·kg−1, PEEP of 4 hPa; ▪: Mch 10 µg·kg−1, PEEP of 4 hPa; ♦: Mch 20 µg·kg−1, PEEP of 4 hPa; ▴: Mch 40 µg·kg−1, PEEP of 4 hPa; ○: control, PEEP of 1 hPa; ▿: Mch 5 µg·kg−1, PEEP of 1 hPa; □: Mch 10 µg·kg−1, PEEP of 1 hPa; ⋄: Mch 20 µg·kg−1, PEEP of 1 hPa; ▵: Mch 40 µg·kg−1, PEEP of 1 hPa. * and #: indicate values of Raw or H and the number of crackles, respectively, that are significantly different (p<0.05) from the corresponding control data.
The pulmonary changes evoked by the two series of Mch challenges were fairly reversible: values slightly elevated above the control levels were observed only in H (31.5±4.7 versus 28.5±4.2 hPa·l−1; p = 0.006) and in the number of crackles (253±310 versus 86±26; p = 0.09).
DISCUSSION
In order to characterise the recruitment processes during an acute pulmonary constriction in mechanically ventilated animals, intratracheal recordings of crackles during slow inflations were combined with measurements of the pre-inflation oscillatory mechanics of the lungs. Airway closure was generated by lowering the lung volume and/or inducing lung constriction with Mch. The results of the experiments revealed that: 1) the impairment in lung mechanics and the development of the lower inflexion point of the PL–V curve were always associated with a significant increase in crackle activity; 2) the magnitude of the increases in the number of crackles was far greater than those observed in the Raw and pulmonary H, both following the lung volume decrease and during the constrictor responses of the lungs; and 3) the elevations in the crackle activity preceded those in the pulmonary mechanical parameters.
In order to quantify the reopening of lung units during obstructive disorders in mechanically ventilated mini-pigs, a crackle measurement technique was adopted that was previously employed in excised dog lungs 30. Although it has been proposed that crackles are generated by the abrupt reopening of lung units 24, 26, 29, evidence has been presented only recently that lung crackles originate from the sudden reopening of the conducting airways 30, 33. Since the acoustic events identified in the present experiments are very similar to those described previously 30, 33, it is assumed that they also originate from the opening of small lung structures.
Lung sounds are usually detected by auscultation on the chest surface; hence, preferentially the acoustic events occurring in the adjacent peripheral region and passing through the local pulmonary and chest wall tissues are sensed. These sounds therefore relate to the specific peripheral area, in contrast with the sounds recorded in the trachea, which are all transmitted from the source through a gaseous medium to the central airway and attenuated by every bifurcation between the source and the recording site. As the intensity of a crackle is related to the size of the opening airway, a higher number of peripheral airways would produce smaller crackles and involve more attenuation points. These factors and the actual level of noise determine the acoustic depth of the crackle-recording method, i.e. the generation number of the bronchi whose reopening sounds can still be detected at the airway opening. Although the cardiac sounds as the major source of noise could be completely filtered out because of their distinct spectral features, the environmental noise in the laboratory was more significant than that in an isolated lung measurement, where efficient acoustic isolation can be achieved. Accordingly, the fact that the crackle number plateaued (while Raw and H further increased) with increasing doses of Mch, may reflect the limit set by the noise to the sensitivity of crackle detection, and explain why the progression of reopenings towards the periphery could be followed until the number of crackles reached a value of ∼4,000 (corresponding to the 11th airway generation). Although the acoustic tracking of the recruitment process may have been incomplete, it is perhaps more important that the acoustic method indicated the occurrence of airway closure at an early stage when changes in the pulmonary mechanical parameters were still not apparent. The explanation for the higher sensitivity of the acoustic measurements lies in the fact that the closure of a relatively small number of peripheral airways does not lead to appreciable increases in total Raw and H because of the high number of parallel lung units, whereas every single airway opening that results in an above-threshold crackle is detected in the central airway.
Previous studies on the respiratory mechanics in pigs employed measurements during tidal ventilation 35, 36. The forced oscillation method selected in the present investigations offered a more accurate means of characterising the mechanical state of the lungs at a given PL, since the small-amplitude oscillations at the airway opening were unlikely to lead to recruitment–derecruitment during the measurement.
The dose–dependent changes in ZL in response to Mch were similar to those observed in other species 37−40: the elevations in Raw exceeded those in H, which indicated a significant bronchoconstriction, leading to a smaller degree of closure of lung units. The responses to Mch were enhanced at the lower mean PL, in agreement with those studies that reported greater lung responses in the presence of a low lung inflation pressure 41, where the disproportional increases in G as compared with those in H, and the sharp fall in Iaw at the highest doses of Mch, indicate the greatly increased inhomogeneity of the peripheral airway constriction 40. Use of open-chest preparation made it possible not only to exclude the chest wall mechanical properties, but also to lower the lung volume below the closing volume, thereby facilitating closure of the airways even without a bronchoconstrictor challenge. Indeed, re-inflation from PL of 1 hPa under control conditions resulted in a reopening activity comparable in the number of crackles to that reached at the third dose of Mch at the higher PL level.
The aims of this study were to evaluate the effect of airway closure on the pulmonary mechanics at different mean lung volumes and degrees of bronchoconstriction, and to quantify the recruitment via the crackle activity recorded during the subsequent slow inflations. The experimental model was therefore chosen to mimic situations characterised by airway obstruction, such as in anaphylactic reactions, the exacerbation of asthma or chronic obstructive pulmonary disease, and was not intended to include capillary filtration/resorption abnormalities typical of acute lung injury. Excessive intrabronchial fluid and foam production in pulmonary oedema may increase the number of crackle-like sounds not uniquely connected to airway opening; bubbles may pop up in large numbers during both inspiration and expiration, and produce transient sounds reminiscent of crackles 32. This did not happen in the present study; gross examination of the lungs and major airways revealed no fluid accumulation, and the Raw and H values had almost completely recovered by the beginning of the second sequence of Mch challenges.
In conclusion, the present study demonstrated that the quantification of airway closure on the basis of subsequent recruitment is feasible by monitoring intratracheal crackle sounds in vivo. The measurements revealed the importance of airway closure in the deterioration of the lung mechanical parameters following the administration of methacholine at a normal lung volume, and especially at a lung volume below the closing volume. Since the number of crackles increased significantly before any change occurred in the airway resistance, the pulmonary elastance or the shape of the transpulmonary pressure–volume curve, lung-sound recording appears to be a sensitive tool with which to indicate early impairments in the mechanics of the lung periphery. Thus, crackle recordings may have the potential to serve as a bedside monitoring tool for detection of the cyclic recruitment–derecruitment of the airways during mechanical ventilation, and hence contribute to the guidance of the optimal ventilation strategy.
- Received September 7, 2005.
- Accepted November 8, 2005.
- © ERS Journals Ltd
References


