


Abstract
A systematic literature review suggests that particulate air pollution is associated with daily admissions for both respiratory and cardiac diseases in people aged >65 yrs.
A model of acute effects is proposed which shows how admissions can be brought forward by a relatively short period of time as well as events being added that would not have happened at all except for air pollution. A model of the effects of air pollution on chronic disease is proposed that provides the background of long-term vulnerability upon which the increased short-term vulnerability is superimposed.
A study of daily hospital admissions in London shows that for respiratory disease the relative risks of admission associated with particles reduce with increasing age, while for cardiac disease, there is no trend. When the attributable risk is estimated using baseline admission rates for respiratory disease, it is children who have the highest attributable risk, followed by the elderly.
For cardiac disease there is a steep increase in attributable risk with age, reflecting the dominant influence of baseline risks. The attributable risk for cardiovascular disease in the elderly is considerably greater than for respiratory disease, due to higher baseline admission rates.
In the United Kingdom (UK), a series of studies have been initiated in the last decades by the concern that, despite the fall in air pollution levels since the 1950s, there might still be adverse effects at current levels.
In 23-yr-old subjects from the 1958 national birth cohort in the UK 1, phlegm symptoms increased with increasing black smoke (BS) levels with evidence of a plateau. Among a subsample examined at age 34–35 yrs 2, those currently using gas for cooking at home had a significantly reduced forced expiratory volume in one second (−70 mL) compared with those who used electricity for cooking.
In December 1991, London experienced an air pollution episode with elevated concentrations of nitrogen dioxide (NO2) and moderate increases of BS. Mortality was increased for all causes (relative risk=1.10) and cardiovascular diseases (1.14), and, nonsignificantly, for all respiratory diseases (1.22). In the elderly (≥65 yrs) the relative risk of hospital admission was increased for obstructive lung diseases (1.43) 3. Epidemic of asthma was not associated with such an episode of air pollution 4.
A series of studies utilised environment and health time-series data in London from 1987–1992. Ozone (O3) levels were associated with a significant increase in all cause, cardiovascular, and respiratory mortality 5. In the warm season a 29 parts per billion (ppb) increase of the 8 h O3 concentration was associated with increases of 3.5, 3.6, and 5.4% in all cause, cardiovascular, and respiratory mortality, respectively. BS concentrations on the previous day were significantly associated with all cause mortality; a 12 µg·m−3 increase in the warm season was associated with an increase of 2.5% in all cause mortality. Significant but smaller effects were also observed for NO2 and sulphur dioxide (SO2). O3 (lagged 1 day) was also significantly associated with an increase in daily admissions among all adult age groups 6. In the warm season, the relative risks of admission associated with an increase in 8 h O3 levels of 29 ppb were 1.05, 1.03, 1.08, and 1.06 for all ages and age groups 0–14, 15–64, and ≥65 yrs, respectively. Anderson et al. 7 found that O3 was significantly associated with daily hospital admissions for asthma in the age group 15–64 yrs (10 ppb 8 h: 3.93% increase), NO2 in the 0–14 and ≥65-yr age groups (10 ppb 24 h: 1.25% and 2.96%, respectively), SO2 in the age group 0–14 yrs (10 µg·m−3 24 h: 1.64%), and BS in the ≥65-yr age group (10 µg·m−3: 5.60%). There was little evidence of an interaction between pollens and pollution, except for synergism of SO2 and grass pollen in children.
Another series of studies utilised environment and health time-series data in London from 1992–1994. Bremner et al. 8 observed that each pollutant apart from O3 was significantly associated with respiratory mortality; particulate matter with a 50% cut-off aerodynamic diameter of <10 µm (PM10) showed the largest effect (4% increase in deaths of all ages for a 10th to 90th percentile increment). The pollutants significantly associated with cardiovascular deaths were NO2, O3, and BS. Atkinson et al. 9 found strong associations between visits to emergency departments in London for all respiratory complaints: e.g. a 2.8% increase for a 18 µg·m−3 increase in SO2 and a 3.0% increase for a 31 µg·m−3 increase in PM10. There were also significant associations between visits for asthma and SO2, NO2 and PM10. Atkinson et al. 10 found significant positive associations between emergency hospital admissions for respiratory disease and PM10 and SO2. Hajat et al. 11 observed positive associations between asthma general practitioner (GP) consultations and NO2 and carbon monoxide (CO) in children and PM10 in adults, and between other lower respiratory disease (LRD) consultations and SO2 in children. In the latter % change in asthma consultations during the warm season for a 10th to 90th percentile increase in 24 h NO2 lagged by 1 day was 13.2%, for CO 11.4%, and for SO2 9.0%. In adults the only consistent association was with PM10 (9.2%). The associations of pollution and consultations for LRD were increased mainly in the winter months. Hajat et al. 12 observed that in children a 18 µg·m−3 increase in SO2 levels of the preceding 4 days was associated with a 24.5% increase in GP consultations for allergic rhinitis symptoms; a 23 ppb increase in average O3 concentrations on the day of consultation and the preceding 3 days was associated with a 37.6% rise. Hajat et al. 13 estimated that a 18 µg·m−3 increase in SO2 resulted in a 3.5% increase in childhood consultations at family practices. Stronger associations were found for fine particles: 5.7% for a 31 µg·m−3 change in PM10 in adults aged 15–64 yrs, and 10.2% in adults aged ≥65 yrs. In general, associations were strongest in elderly people in the winter months.
Further, Poloniecki et al. 14, analysing data for 1987–1994, found the following attributable cases for acute myocardial infarction: BS: 2.5%; NO2: 2.7%; CO: 2.1%; and SO2: 1.7%. There were also associations between BS and angina, NO2 and arrhythmia, and CO and other circulatory diseases. The associations with acute myocardial infarction were significant only in the cool season. One in 50 heart attacks were estimated as being triggered by outdoor air pollution. By extrapolating these results to the whole UK, this would total 6,000 preventable heart attacks a year.
Wong et al. 15 found significant positive associations for respiratory admissions in the elderly with PM10, NO2, SO2, and O3 in both Hong Kong and London. They tended to be stronger at shorter lags in Hong Kong and at longer lags in London. They were stronger in the cool season in Hong Kong and in the warm season in London (lowest humidity in each city). For cardiac admissions (all ages) in both cities, significant positive associations were observed for PM10, NO2, and SO2 with similar lag patterns. Associations tended to be stronger in the cool season.
Pekkanen et al. 16 found that a 61.7 µg·m−3 increase in the 24 h mean NO2 and a 1.6 mg·m−3 CO increase during the previous day were associated with a 1.5% higher fibrinogen plasma concentration collected in a cross-sectional survey on a large group of office workers in London between 1991–1993. These associations tended to be stronger in the warm season, when significant associations were also found for BS and PM10. Increased fibrinogen concentrations, possibly due to an inflammatory reaction caused by air pollution, might be an underlying mechanism for cardiovascular events linked to air pollution.
Stedman et al. 17 in the UK, by combining locally-based exposure/response relationships with mapped estimates of O3 summer exposure, estimated that 0.10% (n=184) in 1993 and 0.35% (n=643) in 1995 of hospital admissions for respiratory disorders could be attributed to levels of O3 >50 ppb.
In the West Midlands conurbation of the UK for the period 1994–1996 18, there was evidence for associations between particulate matter with a 50% cut-off aerodynamic diameter of <2.5 µm (PM2.5), BS, SO2 and respiratory hospital admissions in the age group 0–14 yrs. PM10 had smaller and less consistent associations. The results for BS, an indicator of fine primary carbonaceous particles, were very similar to those for PM2.5. Thus, the active component of particles resides mostly in the fine fraction, mainly from combustion (mainly vehicle).
In a panel of 154 children aged 7–11 yrs attending a school close to a motorway in South-East England 19, there was a significant inverse relationship between daily mean PM10 levels lagged 1 day and forced vital capacity. Pollen levels on the previous day did not influence lung function, nor interacted with air pollutants.
Anderson 20, in reviewing the mechanistic and epidemiological evidence concerning air pollution and asthma, concluded that, although air pollution can provoke or aggravate asthma, existing evidence is not sufficient to link air pollution with the initiation of asthma in healthy subjects.
Since daily time-series data provide no direct information about the degree of life-shortening associated with the excess daily deaths, such data cannot contribute to the estimation of the effects of air pollution upon chronic disease incidence and long-term death rates 21. Such effects are best estimated from long-term cohort studies that incorporate good knowledge of local (or personal) exposure to air pollutants and of potential confounders. A recent example is the article by Pope et al. 22 in the USA.
Aim
From the background it emerges that a large number of studies have reported associations between air pollution and daily mortality and hospital admissions for cardiovascular and respiratory disease 1–26. The aims of this paper are: 1) to present a systematic review of time series studies of particulate air pollution and daily admissions for cardiorespiratory diseases in the elderly; 2) to explore conceptual models which could explain such associations; 3) to use data from daily time series and episode studies in London to examine the hypothesis that relative risks are higher in the elderly; and 4) to compare relative and attributable risks across the age groups.
Literature review
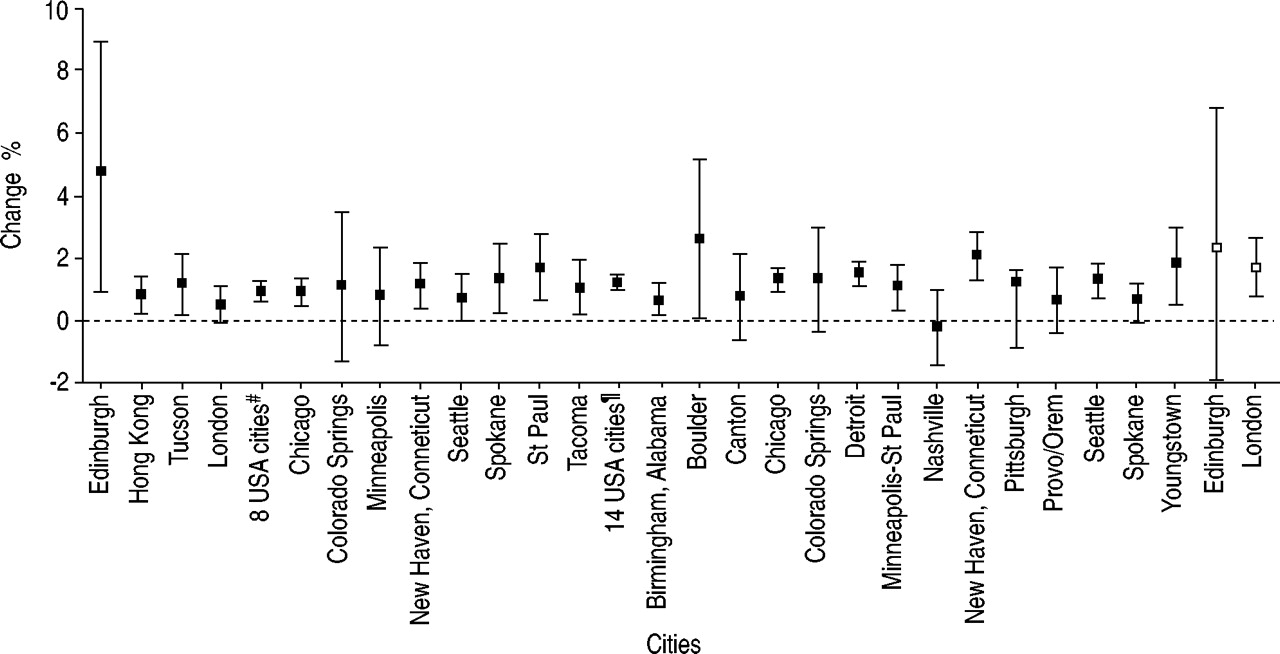
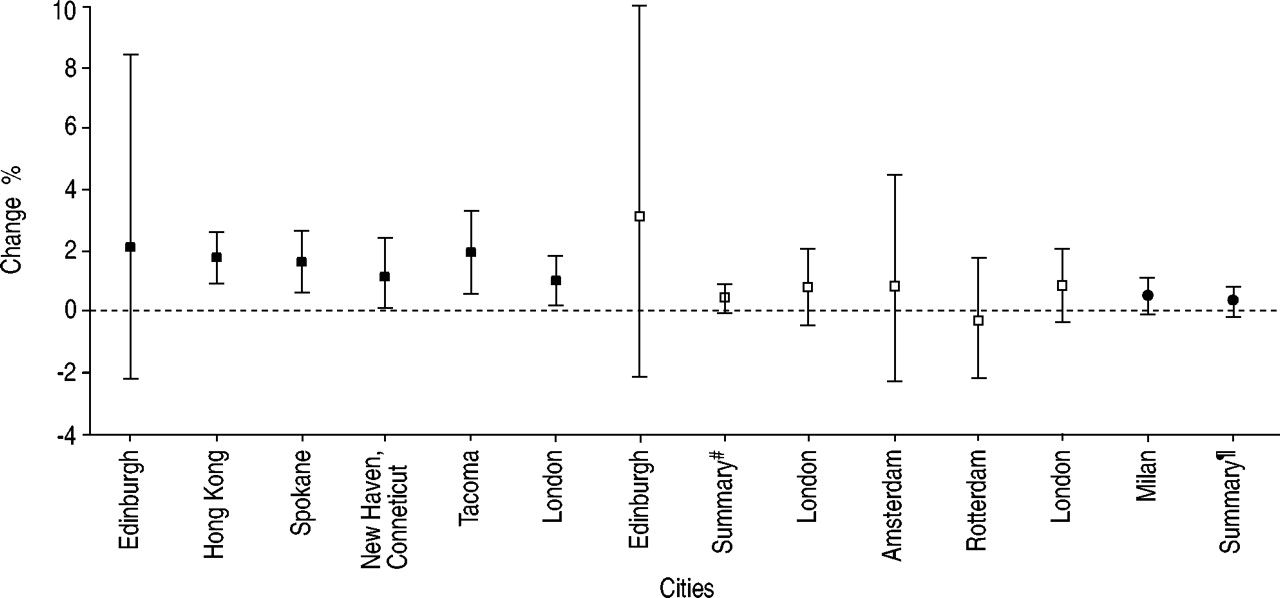
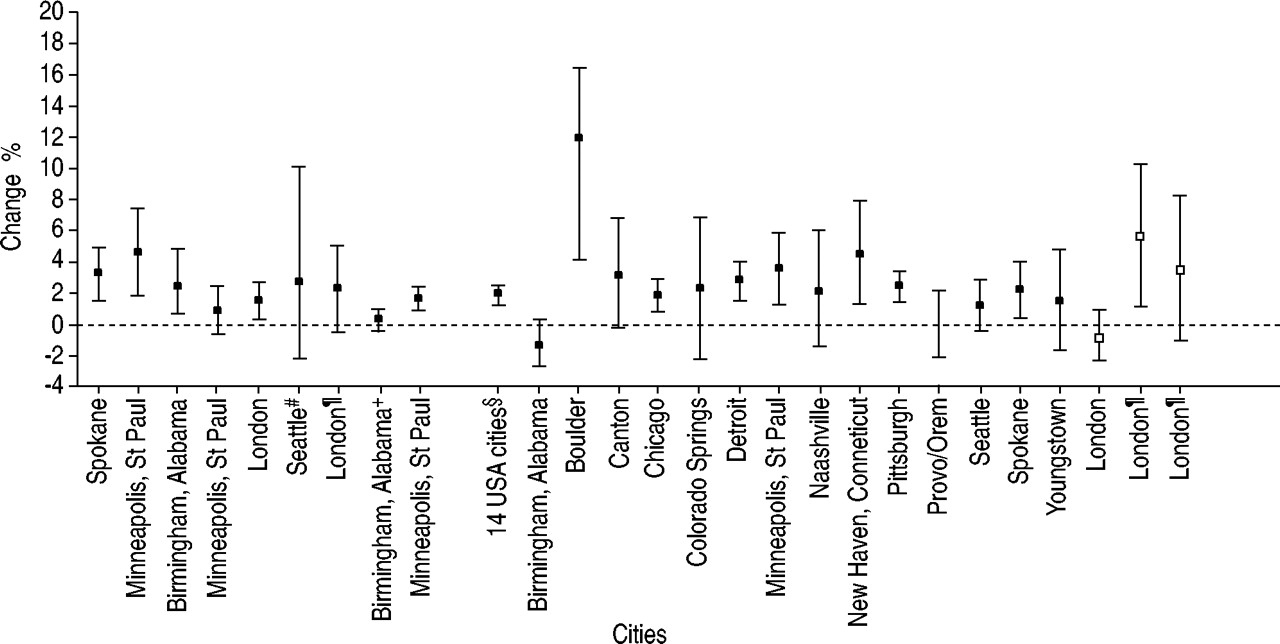
The current authors have conducted a systematic review of all available time series studies of admissions in the ≥65-yr age group and particles (PM10, BS and total suspended particulates (TSP)) available from the literature databases up to August 2000. The review results for lower respiratory emergency admissions are shown in figure 1⇓ 6, 8, 10, 25, 27–32. These studies come from North America, Europe and Hong Kong. For PM10, the estimates are mostly significantly positive at the 5% level. For BS all but one of the six cities show a positive association but none achieve statistical significance. Two studies report positive associations between admissions for respiratory disease and TSP. All of the studies of pneumonia are from North America (fig. 2⇓) and all show positive results for PM10 28, 33–37. The summary estimate for 14 cities as part of the National Morbidity, Mortality and Air Pollution Study (NMMAPS) 37 shows a small statistically significant association: 2.0% (95% confidence interval: 1.7–2.3). The results for studies of chronic obstructive pulmonary disease (COPD) with or without asthma also tend to show a positive association (fig. 3⇓) 7, 10, 28, 35–38. More recently studies of cardiovascular disease admissions have emerged, mainly from the USA (fig. 4⇓) 10, 27, 30, 37, 39. Nearly all the estimates are positive and summary estimates from two large USA studies show statistically significant effects. The relative lack of European results is being addressed with the very recent reports 40–42 and the forthcoming publications from Air Pollution on Health: a European Approach (APHEA) Phase 2.

Published studies of particles and daily emergency admissions for all lower respiratory diseases in the ≥65-yr age group. The percentage change for a 10 unit increase in particles is shown, with 95% confidence intervals. ▪: particles with a 50% cut-off aerodynamic diameter of 10 µm (PM10); □: black smoke; •: total suspended particulates. Summary#: summary estimates for Amsterdam, London, Paris and Rotterdam; Summary¶: summary estimates for Amsterdam, Milan and Rotterdam.

Published studies of particles with a 50% cut-off aerodynamic diameter of 10 µm (PM10) and daily emergency admissions for pneumonia in the ≥65-yr age group. The percentage change for a 10 unit increase in PM10 is shown, with 95% confidence intervals. #: summary estimates for the 14 USA cities listed to the right.

Published studies of particles and daily emergency admissions for chronic obstructive pulmonary disease (COPD) and asthma in the ≥65-yr age group. The percentage change for a 10 unit increase in particles is shown, with 95% confidence intervals. ▪: particles with a 50% cut-off aerodynamic diameter of 10 µm (PM10); □: black smoke. All are for COPD unless indicated by footnote: #: emergency room admission for asthma; ¶: asthma admissions; +: COPD+pneumonia; §: summary estimate for the 14 USA cities listed to the right.
Published studies of particles and daily emergency admissions for cardiovascular diseases. The percentage change for a 10 unit increase in particles is shown, with 95% confidence intervals.▪: particles with a 50% cut-off aerodynamic diameter of 10 µm (PM10); □: black smoke. #: summary estimate for the eight USA cities listed to the right; ¶: summary estimate for the 14 USA cities listed to the right.
Mechanisms
The mechanisms behind these associations are unclear. Air pollution could act as an irritant and evoke defensive responses in the airways, such as increased mucus secretion and impairment of clearance via the muco-ciliary system and increased bronchial hyperreactivity. This might affect ventilation/perfusion balance for example. It has also been postulated that saturation of the alveolar macrophages with particles could cause release of cytokines that might have systemic effects 43. This is supported by evidence which relates ambient pollution to changes in haematological indicators such as fibrinogen and blood viscosity 16, 44. Recent evidence suggests that a neural reflex effect on the heart may also be associated with particulate air pollution. This includes effects on heart rate variability 45, and the discharge of implanted cardioverter defibrillators 46.
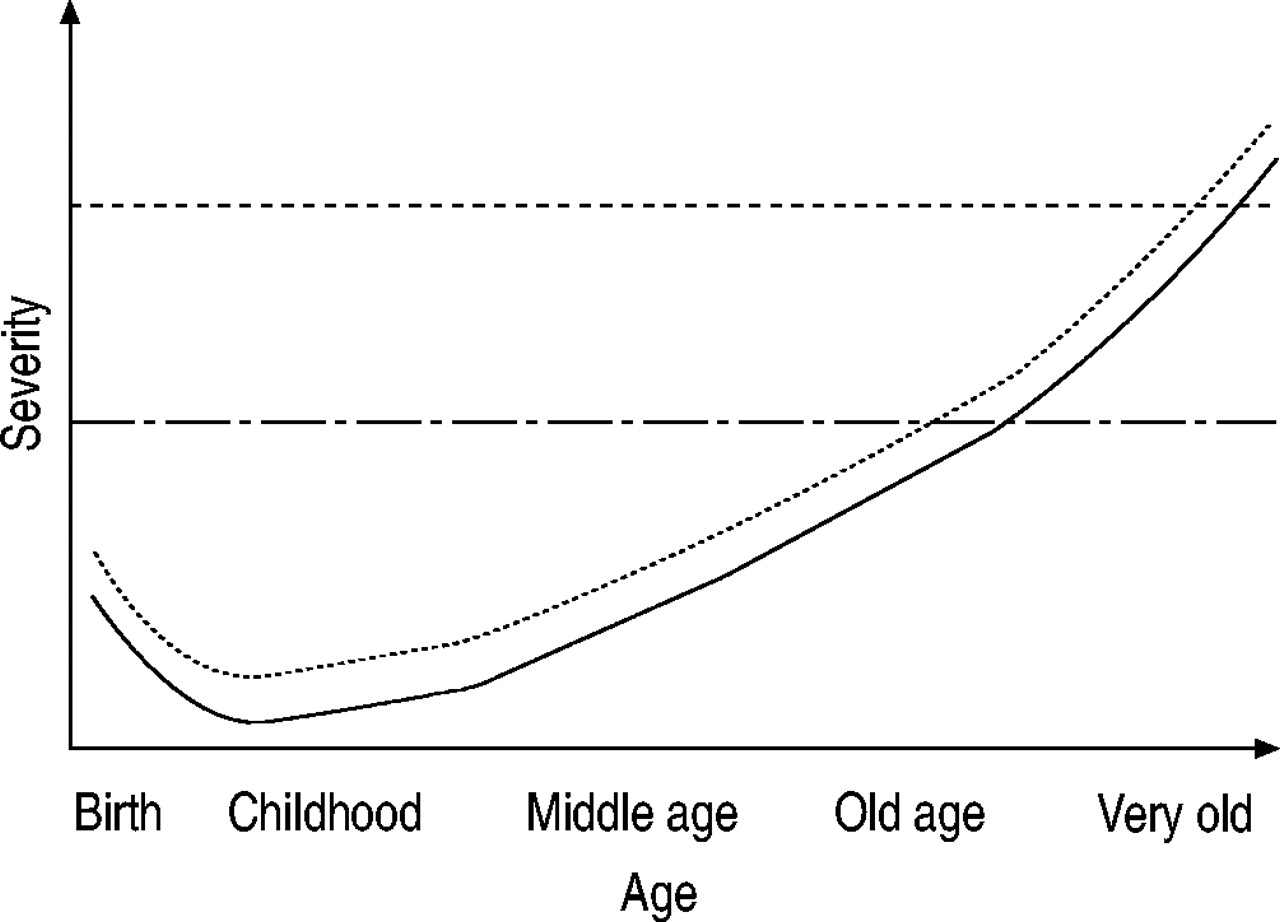
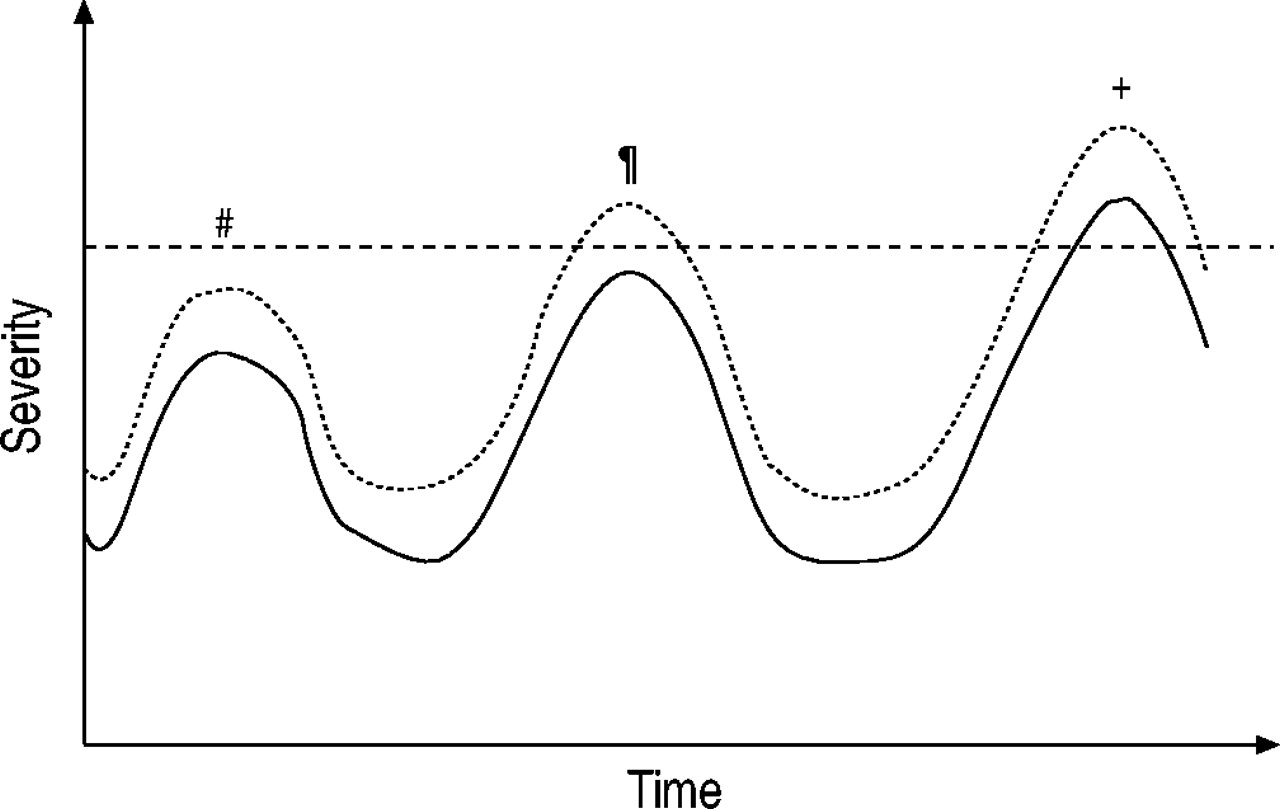
It is very likely that an increase in severity leading to hospital admission is due to a small effect of air pollution being added to, or interacting with, effects of other agents such as infections which have already created a situation of temporary vulnerability. This occurs against a background of longer-term vulnerability to which particulate pollution could also contribute. These concepts are illustrated in ⇓figures 5 and 6⇓. Figure 5⇓ shows three scenarios all of which are based on a short-term increase in vulnerability due to other factors (infection, for example). In the first, the increase in vulnerability is not enough to lead to a clinical event (such as hospital admission), even after adding the effect of air pollution. In the second, the effect of air pollution, though small, is enough to take the subject over the threshold for admission, but in the absence of air pollution this would not have occurred. It is the “last straw that breaks the camel's back”. This is an admission that would not have occurred if air pollution had not been present, and is not attributable to a short-term displacement (sometimes referred to as harvesting). The last scenario shows an admission that would have been inevitable due to other factors, but is made more severe by air pollution. The timing of admission has been advanced by a small amount and this represents short-term displacement. It is difficult to quantify the relative roles of scenarios two and three but recent evidence based on an analysis of daily time series of hospital admissions 47 suggests that scenario two is important and that the observed associations are not entirely attributable to short-term displacement (scenario three).

A conceptual model showing how the added effect of air pollution could cause a clinical event that would not have occurred otherwise, or could bring forward in time a clinical event that would have occurred anyway. The model assumes that the other causes are largely responsible for the increase in vulnerability. #: no event; ¶: added event; +: event brought forward. ------: threshold for change in clinical state; –––––: vulnerability; ······: reserve.
A conceptual model showing how the added effect of air pollution could bring forward the onset of clinical disease and death. It assumes that air pollution is an added factor in a disease with multifactorial aetiology. –·–·–: symptoms and disability; –––––: vulnerability; ······: reserve; - - -: death.
A possible mechanism for the longer-term effects of air pollution is illustrated in figure 6⇑. This represents the increase in vulnerability with age that is due to the net result of ageing and environmental factors such as infections, smoking, occupation etc. This vulnerability might be expressed biologically as reductions in lung or cardiac function, or in reduced resistance to infection. The added effect of air pollution on chronic vulnerability is illustrated by a fixed increase in risk but this may not be the case for the individual or the population in general. The effects of short-term increases in vulnerability will be overlaid on the long-term increase. Combining these models, air pollution could contribute to both the long- and short-term outcome of chronic lung disease. In the case of acute myocardial infarction, air pollution may only be responsible for the short-term effects, not the underlying atheromatous process. In the case of lung cancer, the effects of air pollution could be on induction, prognosis, and timing of death. These ways of explaining the epidemiological findings are largely conjectural, since there is insufficient knowledge about the underlying mechanisms of induction, progress and exacerbation of most of these diseases.
Association between relative risks and age
Few, if any, papers have addressed directly the question of whether the relative risks of hospital admissions increase with age. Some relevant data are available from an analysis of the health effects of an air pollution episode characterised by increases in particles and oxides of nitrogen which occurred in London in 1991 3. The admissions in the episode week were compared with those expected on the basis of the week prior to the episode, previous years and the rest of South East England. The results by age are shown in table 1⇓. For all lower respiratory admissions there is some indication of an increase in the risk of admission in the ≥75-yr age group compared to the younger age groups. This is more obvious for admissions for COPD (including asthma), where the estimate was statistically significant for the ≥75-yr age group. For ischaemic heart disease the risks were elevated for all ages, with no evidence of a trend (table 1⇓).
Association between the air pollution episode in London (1991) and the risk of hospital admission for lower respiratory and ischaemic heart disease, by age
The association between age and daily admissions can be explored in detail using the results of a study of admissions to London hospitals for the years 1992–1994. The main methods and results of this study have been published 10, but not those for the subgroups 65–74 yrs and ≥75 yrs 48. Because the population within London Health Authorities is large (7.2 million inhabitants), the precision of the estimates for subgroups is sufficient to compare age groups. The results for lower respiratory disease and cardiovascular disease are shown for PM10 and BS in table 2⇓. For PM10, the relative risks for lower respiratory disease admissions decline with increasing age; for cardiovascular disease there is no relationship with age. For BS, the pattern is less consistent, but is generally similar to that for PM10. Thus, the evidence is in favour of higher risks in the younger rather than the older age groups. For cardiovascular admissions, there is no evidence that particles (PM10 or BS) show stronger effects in the elderly.
Association between particulate matter with a 50% cut-off aerodynamic diameter of <10 µm (PM10) and black smoke (BS), and daily admissions for lower respiratory disease (LRD) and cardiovascular diseases (CVD) in London 1992–1994, by age
Space does not allow a full presentation of analogous results for the gaseous pollutants, but the data are available in the report cited above 48. For respiratory admissions, the pattern for NO2 was similar to that of PM10, with a downward trend in the effects on respiratory admissions with increasing age. In contrast, there was a strong suggestion that for cardiovascular admissions, the risks are higher in the ≥75-yr age group. For O3 there was no age trend in the risks of respiratory admissions but, as for NO2, the highest risk for cardiovascular admissions was seen in the ≥75-yr age group.
Association between attributable risks and age
In considering the question of risk, it is important to distinguish relative and attributable risks. The results of time series studies refer to the relative risk, which is the proportional change in daily admissions associated with an increment of pollution. The attributable risk is the absolute increase in admission rates associated with an increment of air pollution and is a function of both the baseline incidence and the relative risk. Assuming that 100% of the population are exposed, the population attributable admission rate is estimated by: baseline admission rate×(relative risk–1). Figure 7⇓ illustrates this point by comparing the attributable risk with the relative risk across the age groups, for respiratory and cardiovascular admissions. Baseline respiratory admission rates are about twice as high in the elderly as in the young, but because this is more than offset by the higher relative risks in the young, the attributable admission rates are highest in the young. For cardiovascular admissions there is a clear increase in attributable risk with age, due entirely to the increased baseline risk, since there is little change in relative risk with age.

Comparison by age of the relative risks of admissions for a) respiratory and b) cardiovascular diseases associated with particles with a 50% cut-off aerodynamic diameter of 10 µm (PM10) (♦: % increase in daily admissions for a 10 µg·m−3 increment), and the attributable increase in annual admission rates (□) associated with the respective relative risks.
Conclusion
There is accumulating evidence worldwide that particles are associated with cardiorespiratory admissions in the elderly. However, in London the highest relative risks for respiratory admissions were observed among children. The attributable risk was also highest in children, not only because of their larger relative risk but because of their higher baseline risk. For cardiovascular disease, there was no age trend in the relative risk of cardiovascular admissions associated with particles, but the highest attributable risk was among the elderly due to their greater baseline risk. There are indications that the relative risks associated with gaseous pollutants do not vary with age for respiratory admissions but are increased in the very elderly (≥75 yrs) for cardiovascular disease. Little is known about the mechanisms involved, or why the relative risks vary with age. For public health purposes, it is equally, if not more, important to consider the attributable risk rather than the relative risk.
Acknowledgments
The episode and time-series studies, and the systematic review were funded by the UK Department of Health. The study team for the London Episode analysis was: HR Anderson, ES Limb, J. Bower (AEA Technology Environment, Abingdon, UK), JM Bland, DP Strachan. The study team for the London daily time series study was HR Anderson, R Atkinson, JM Bland, J Bower (AEA Technology Environment), SA Bremner, J Emberlin (Worcester College), A Haines (London School of Hygiene & Tropical Medicine (LSH&TM)), S Hajat (LSH&TM), A McMichael (LSH&TM).
- Received April 12, 2002.
- © ERS Journals Ltd
References


