


Abstract
While a consensus definition of the clinical parameters important in asthma control exists, an adequate objective definition of a response to asthma treatment and parameters for prediction of that response remain undefined. Given that asthma is a complex biological disease and that different parameters may measure dissimilar aspects of the disease status, this study assessed the relationship among several end-points of asthma control, and attempted to select a combination of variables measured before (baseline characteristics) or early in asthma therapy which would be predictive of a long-term clinical response.
Data from two previously reported clinical studies which included montelukast, inhaled beclomethasone, and placebo in mild-to-moderate asthmatics (n=1,576) were analysed. The forced expiratory volume in one second (FEV1), daily symptoms score (DSS), β-agonist use, and morning peak expiratory flow (PEFAM) were recorded during the baseline period and throughout the 12-week treatment period.
For the long-term response, as measured during the last 9 weeks of treatment, there was a large within-patient variability and no more than a moderate correlation between the changes in FEV1 and PEFAM; DSS and FEV1; and DSS and β-agonist use. The overall predictive values for FEV1 and DSS were 70–80%.
The results showed that multiple measurements over a length of time are needed to establish a more complete profile of response, and that demographic and early treatment responses had a small but inadequate ability to predict future response. This study demonstrates the complex relationship among asthma end-points and the difficulty of reliably estimating long-term response using common, surrogate clinical markers of asthma control.
This study was supported by a grant from the Merck Research Laboratories.
Asthma is a complex biological disease; this syndrome is hypothesised to have multiple causes, and ranges in severity from intermittent to severe-persistent. The aim of treatment is control of asthma, which has been defined broadly in international guidelines by consensus expert panels as a decrease in chronic symptoms and the need for rescue medication use of inhaled β-agonists, an increase in airflow and the absence of worsening episodes 1, 2. While this model describes the general concepts and end-points important in asthma control, and although the response to therapy has been largely reported and measured by a number of variables (as outlined in the guidelines), a comprehensive description and understanding of the relationship among everyday measurements of clinical asthma control remains elusive 3, 4.
The authors recently showed that the forced expiratory volume in one second (FEV1) and morning peak expiratory flow (PEFAM) maintained a strong correlation with each other throughout a l-yr study, while FEV1 and the daily symptom score (DSS) or daily β-agonist use showed a weak correlation during the same time period 5; such differences suggest that these end-points may measure different aspects of asthma disease status. Nevertheless, it remains of interest to investigate if a combination of these variables could serve as predictors of a response to treatment 6. The ability to accurately and reliably predict individual long-term response would depend on the clinical end-points demonstrating both a small degree of variability within the study population and a large correlation coefficient between predictor and response variables. To further explore relationships among changes in asthma end-points after interventions and the predictability of these clinical parameters, data from two large clinical studies was analysed 7, 8 with the objective of: 1) determining the within-patient (over time) and between-patient variability of asthma, as indicated by objective and subjective measurements; 2) estimating the strength of univariate and multivariate correlations among such measures; and 3) testing whether an appropriate combination of baseline and early-response variables (demographic, objective and subjective) could reliably predict long-term response to therapy.
Methods
The data analysed were from two previously completed, randomised, multicentre, double-blind, placebo-controlled, parallel-group clinical studies comparing montelukast, inhaled beclomethasone and placebo in mild-to-moderate asthmatics (n=1,576) 7, 8. Each study consisted of a 2-week, single-blind placebo run-in period, a 12-week double-blind active-treatment period, and a 3-week double-blind wash-out period. Patient characteristics are described in table 1⇓.
Baseline characteristics of patients (all treatment groups pooled)
The factors and response variables measured were: 1) age, 2) sex, 3) duration of asthma, 4) baseline FEV1, 5) baseline FEV1 % predicted, 6) baseline FEV1 % reversibility after inhaled β-agonist, 7) baseline PEF (L·min−1). The following variables were measured postrandomisation: 1) FEV1 % change from baseline at week 3, 2) average DSS during first 3 weeks, 3) average daily β-agonist use during the first 3 weeks, 4) average DSS change from baseline over the last 9 weeks, 5) average daily β-agonist use over the last 9 weeks, and 6) FEV1 average % change over the last 9 weeks. The population of both studies included adult and adolescent patients with FEV1 of 50–85% of predicted FEV1 (after withholding β-agonist for at least 6 h), a minimum of 15% reversibility after β-agonist administration, a minimum average DSS of 1.14 (measured on a 0–6 point scale), and an average of at least one puff of β-agonist per day during a 2-week placebo run-in period. Patients taking concomitant oral theophylline (limited to 25% of patients in study 1) and patients taking concomitant inhaled steroids (limited to 25% of patients in study 2) were allowed to continue at a constant dose 7, 8.
The pulmonary function variable FEV1 was measured at baseline and every 3 weeks thereafter. Patient-reported measurements of DSS, daily β-agonist use, and PEFAM were recorded by the patient using a validated daily diary during the baseline period and throughout the 12-week treatment period 9. Other end-points included a patient's global evaluation (on a 7-point scale 10) and asthma-specific quality of life (QoL 11) assessment; these subjective measures provide further evidence for the impact of therapy on the patient's daily life. The average value over 3 weeks prior to a visit was used as the score at each office visit.
Statistical methods
Statistical analysis was based on an intention-to-treat approach including all randomised patients with a baseline value and at least one treatment measurement. The average value over the last 9 weeks of treatment is defined in this article as a long-term late response, while the average value over the first 3 weeks of treatment is defined as an early response.
Pair-wise correlations among variables of interest and potential predictors for late response were established by calculating Pearson's correlation coefficients on the possible predictor values prior to allocation, at baseline, and in the treatment periods.
To compute within-patient and between-patient variations for single visit measurements, the values from each visit were fitted via a variance component model, with factors for treatment and time as fixed effects and the subject as a random effect.
The within-patient and between-patient variations for the average of two measurements were obtained using the same model. The within- and between-patient variabilities for the average of three measurements were not computed directly, but were derived from a standard three-way analysis of a variance model. Each observation (measurement) Yijkα (which represents the variation of the particular value from the average value for treatment i and visit j and subject k) was assumed to be independent and identically distributed and equal to the sum of the following: an overall mean μ, a treatment effect τi, a time period (visit) effect Vj, a subject effect Sk, and an overall random error εijkα. The factors for treatment and time were assumed to be fixed and the subject effect was assumed to be random. Estimates for the within-patient and between-patient effects were solved directly from this analysis of variance model.
A multivariate linear regression was used to establish prediction models for late responses 12. The model included demographic variables, baseline measurements, early responses, and treatment groups as independent variables. Each factor was evaluated using an F-test. The proportion of variation, r2, in the dependent variable accounted for by the independent variables in the model was used to indicate a goodness of fit, with 1 indicating a perfect fit of the model.
Assumptions of normality and homoscedasticity were assessed. All statistical tests were two-tailed, and a p≤0.05 was considered to be significant.
Results
The variability of postrandomisation measurements and the correlation between variables were generally similar among the three treatment groups (for example, the sd in ΔPEFAM measured within patients in the placebo group, montelukast group and beclomethasone group were 22.0, 22.2, and 25.3, respectively; and the sd in ΔDSS measured within patients were 0.43, 0.45, and 0.44). However, the between-patient sd increased slightly in the active treatment groups because of a wider range of responses (e.g. the sd in ΔDSS measured between patients in the placebo group, montelukast group and beclomethasone group were 0.63, 0.71, and 0.77, respectively. The measured variability was therefore considered characteristic of the disease itself and not of each different therapy; consequently, the data were pooled when reporting variability and correlations.
Asthma variability
The variability of asthma was measured postrandomisation in two ways: as within-patient variability over time (the within-patient sd across the measurements taken for each patient during visits at 3, 6, 9, and 12 weeks), and as between-patient variability (the between-patient sd of all patients for the same measurements). Large variabilities for each of the four measurements were noted; the variabilities were largest for individual measurements at weeks 3, 6, 9, and 12 (table 2⇓).
Within-patient and between-patient variability
These variabilities were reduced in magnitude when the average value of measurements at weeks 3+6 and weeks 9+12 were used, and further reduced when the average of three measurements was computed.
The variability of responses to asthma therapy is represented graphically in figures 1a and b⇓.

a) Average % change in the forced expiratory volume in one second (FEV1) from baseline during the last 9 weeks of treatment. b) Average change in the daily symptom score (DSS) from baseline during the last 9 weeks of treatment. ┘: beclomethasone; ▪: montelukast; □: placebo.
There was large variability in Δ FEV1 (% change from baseline) and ΔDSS (change from baseline) when averaged over the last 9 weeks. Patients who had an ∼10% increase in FEV1 at week 3 had between a 50% decrease and a 75% increase in FEV1 at week 12 (fig. 2a⇓).
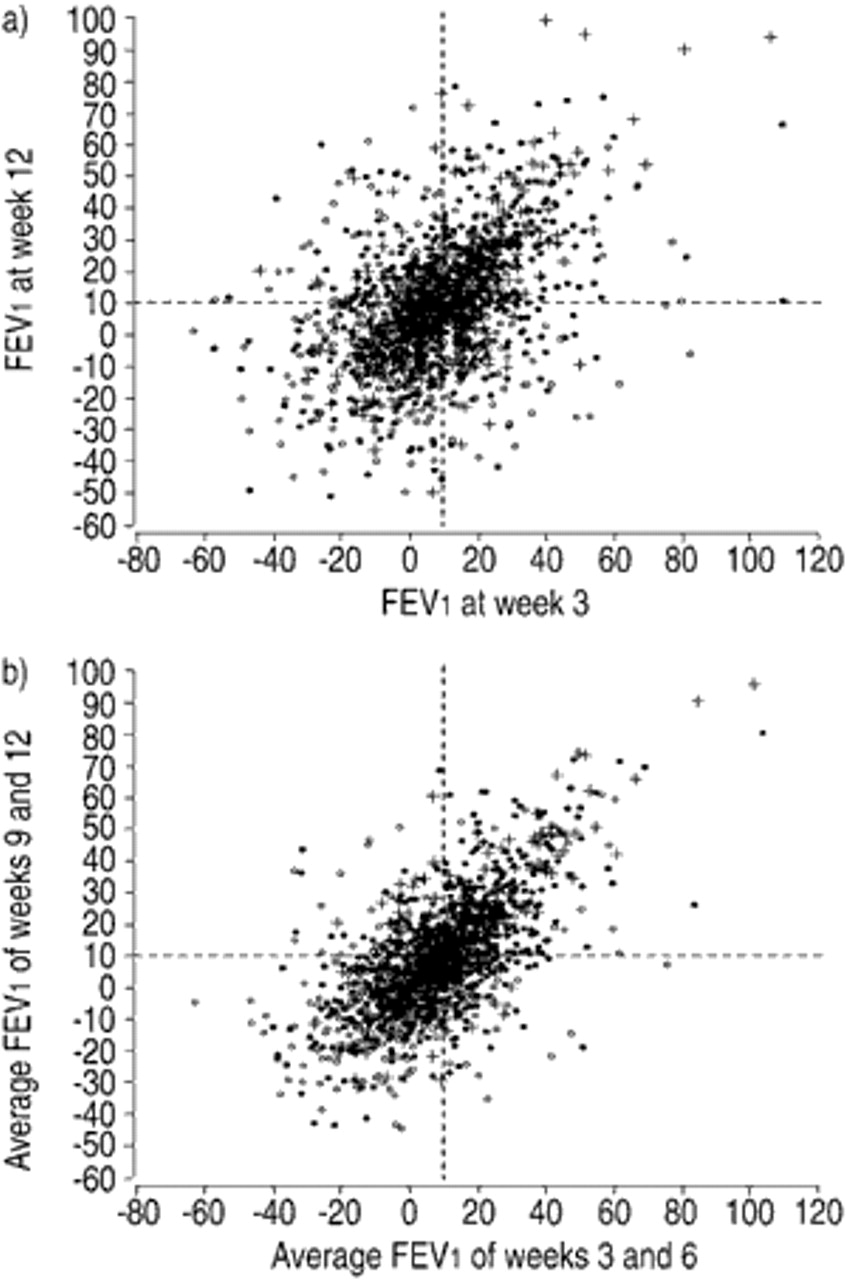
a) Therapy-induced changes in the forced expiratory volume in one second (FEV1) at 3 weeks after the initiation of treatment versus therapy-induced changes in FEV1 at 12 weeks after the initiation of treatment in asthmatics. A 10% increase at week 3 and a 10% increase at week 12 are shown by the dashed vertical and horizontal lines, respectively. b) Average of therapy-induced changes in FEV1 at weeks 3+6 versus the average of therapy-induced changes in FEV1 at weeks 9+12 in asthmatic patients. A 10% increase at weeks 3+6 and a 10% increase at weeks 9+12 are shown by the dashed vertical and horizontal lines, respectively. +: beclomethasone; •: montelukast; ○: placebo.
In contrast, the average ΔFEV1 (% change) at weeks 3+6 plotted against the average ΔFEV1 (% change) at weeks 9+12 showed reduced variability (fig. 2b⇑).
Correlations
The correlations among the different variables were computed. At baseline, there was a strong correlation (r2=0.76) between the objective measures of FEV1 and PEFAM, and a moderate correlation (r2=0.42) between the subjective measures of DSS and β-agonist use (table 3⇓).
Correlation matrix for response variables
The correlations between objective and subjective measures were weak (r2=−0.13–−0.18). To measure the results of therapy, the correlation was calculated for each of the four variables during the last 9 weeks of treatment measured as change or per cent change from baseline. The correlation of ΔFEV1 (% change) to ΔPEFAM was 0.36, substantially less than the 0.76 correlation coefficient measured with baseline values. Similarly, there was a large variability and a moderate correlation (r2=−0.33) between ΔFEV1 (% change) and ΔDSS (table 3⇑). Unlike the analysis of measurements at baseline, the correlation (0.58) was strongest between DSS and β-agonist use during the last 9 weeks.
The relationships between ΔFEV1 (% change) or ΔDSS and patient global evaluation or asthma-specific QoL were evaluated. As shown in table 4⇓⇓, a large cohort of patients showed a decrease or no change in FEV1 during the treatment period.
Per cent of patients whose forced expiratory volume in one second (FEV1) (% change) or daytime symptom scores (DSS) (change) were not improved, but whose patient global evaluation (PG) or quality of life (QoL) was improved
Correlation between response variables and potential predictors
However, QoL improved in 65% (placebo group), 72.5% (montelukast group), and 77.4% (beclomethasone group) of the patients; patient global evaluation improved in 57.3%, 76.4%, and 96.2% of the patients, respectively. Thus, a significant proportion of patients with no improvement in FEV1 nonetheless showed improved QoL and global evaluations. Similar results were recorded for ΔDSS and global evaluation and QoL (table 4⇑).
Predictive model
Because of the large variability and low pair-wise correlations found using univariate analysis, multiple predictors derived from baseline variables and early outcomes were employed to increase the correlation and potential predictability of long-term outcomes. Possible useful predictors that would correlate with ΔFEV1 (% change) or ΔDSS were first assessed.
Twelve variables that correlated (i.e. the correlation coefficient was calculated to be significantly different from zero) with FEV1, DSS, or both are shown in table 5⇑.
Multivariate predictive models for FEV1 and DSS were fitted using the significant variables. As each predictive variable was added to the model, the cumulative coefficient of determination r2 progressively increased. The r2 for predicting the per cent change from baseline of FEV1 was 0.404 when seven variables were used. Similarly, the r2 progressively increased to 0.537 for predicting changes in DSS on using four variables.
The relationship between the measured ΔFEV1 (% change) averaged over the last 9 weeks of treatment and the corresponding ΔFEV1 (% change) predicted by the model is shown in figure 3a⇓.

a) Forced expiratory volume in one second (FEV1) % change from baseline, observed (measured) and model-predicted, averaged over the last 9 weeks of treatment. A 10% increase in FEV1 predicted by the model and a 10% increase in observed FEV1 are shown by the dashed vertical and horizontal lines, respectively. b) Observed and model-predicted DSS change from baseline, averaged over the last 9 weeks of treatment. A 0.3 decrease in predicted DSS and a 0.3 decrease in observed DSS are shown by the dashed vertical and horizontal lines, respectively. +: beclomethasone; •: montelukast; ○: placebo.
For a model-predicted improvement in FEV1 of 10% change from baseline (chosen arbitrarily), the range of actual change in FEV1 improvement was from −20–35%. Similarly, the measured ΔDSS averaged over the last 9 weeks of treatment was compared with predicted ΔDSS (figure 3b⇑). For an improvement of predicted DSS of −0.3, the range of actual change of DSS was −2.2–1.4.
Three individual patients were selected to illustrate the model. Their observed and model-predicted values for ΔFEV1 (% change) (fig. 4⇓) and ΔDSS (data not shown) were plotted along with the corresponding 95% confidence interval of the prediction.

Forced expiratory volume in one second (FEV1) % change from baseline, observed and model-predicted, and the 95% confidence interval of the predictions for three representative patients. •: observed; ○: model-predicted.
Although the differences between the observed and predicted values for both of these response variables are not large, the 95% confidence intervals were large, indicating a limited certainty of prediction.
Predictive value
The sensitivity and specificity of the predictive models for responses using both FEV1 and DSS were evaluated in part by using two-way cross tabulations. The sensitivity, specificity, and overall predictive value of the model for predicting an increase in FEV1 of ≥10% averaged over the last 9 weeks of treatment were calculated to be 0.64, 0.78, and 0.72, respectively. The sensitivity, specificity, and overall predictive value for an FEV1 change of ≥0% were 0.88, 0.46, and 0.75. The sensitivity, specificity, and overall predictive value for a decrease in DSS of ≤−0.3 were 0.82, 0.67, and 0.74. The sensitivity, specificity, and overall predictive value for a decrease in DSS of ≤0 were 0.93, 0.46, and 0.80.
In addition, the authors studied a multivariate regression model that fitted (FEV1, DSS) over the other factors (data not shown); this analysis showed that the same set of covariates had similar contributions and yielded similar results to the model reported in this article.
Discussion
Variability and correlations of asthma assessment variables
The National Asthma Education and Prevention Program and the Global Initiative for Asthma guidelines 1, 2 utilise the magnitude of pulmonary function measurements and the frequency of β-agonist use, daily symptoms, and night-time awakening to form the basis for establishing the severity of asthma and the response to asthma therapy. In recommending several end-points to measure asthma severity and control, these guidelines have attempted to account for the complex physiological, genetic and environmental factors that underlie asthma.
While supporting the concept that asthma is a clinically complex syndrome, the results of this study suggest that the relationship among asthma end-points is equally intricate, preventing simple definitions of asthma control and individual responses. Large within- and between-patient variability of single time-point measurement of FEV1, PEFAM, DSS, and β-agonist use was observed. This variability was reduced when measurements at multiple time points were taken and averaged. Thus, changes in a single measurement at any one time point did not adequately describe the results of asthma therapy, and consequently cannot be used to accurately predict the outcomes of therapy.
Furthermore, patients who showed a robust improvement in pulmonary function did not necessarily show a similar change in daily symptom scores or β-agonist use. Measures of changes in pulmonary function, which may be thought of as objective, correlated poorly with patient-reported (subjective) measures of asthma. A substantial proportion of the patients who showed essentially no change in DSS had a clear improvement in FEV1. Similarly, a substantial proportion of the patients who showed essentially no change in FEV1 showed a clear reduction in DSS. Thus, the low correlation among FEV1, DSS, and other measurements indicates that no one variable adequately describes the state of the disease. Further, in addition to demonstrating that multiple response variables must be measured, these findings show that in order to capture a comprehensive patient profile, more than one measurement of the same variable needs to be made.
Predictive model
Because the data suggested that sufficiently accurate prediction would not be possible even if the initial response to these and other variables was used as a predictor of long-term response, the effect of these variables using a predictive response model was investigated. Using objective measures, this technique produced predictability of FEV1 with an r2 of 0.404. Using subjective variables, the r2 of predicting DSS was slightly greater (0.537). Although these predictors contributed positively to predicting late long-term responses, their precision and accuracy were not adequate, since the number of false positives and false negatives was still quite large. This model may be useful for predicting a group mean value, but falls short of serving as a useful tool for predicting individual patient responses, supporting the observation of the large between-patient and within-patient variabilities. Alternatively, there is a further need to study the distribution of responses to anti-asthma agents in many different but more restrictive asthmatic patient subgroups (defined differently from the patient population here) so a better understanding of how intrinsic differences in patient populations affect the response to various therapies is obtained.
Pharmacogenomics: responders and nonresponders
Identifying individuals or groups that meet or exceed a prespecified criterion, allowing them to be defined as “responders” to an asthma therapy based on a number of baseline characteristics or objective parameters measured early in therapy (that are predictive of the long-term response), would clearly be advantageous, both clinically and experimentally 13–15. Such “all-or-none” type of responses have also been reported in other nonasthma-related respiratory conditions 16. These responses are hypothesised to be due in part to distinct genotypes, like those reported for bronchial reactivity to inhaled methacholine in parents of asthmatic children 17. Consequently, there is a growing interest in studying and relating distinct patient genotypes to certain therapies in asthmatics, as with β-agonist 18 and leucotriene modifier therapies 19, 20.
An adequate definition clearly segregating responders from nonresponders is necessary to assess the influence of predictor variables (including genotype) as well as therapy. However, efficacy responses in asthma therapy for individual end-points have generally not shown a clear responder-nonresponder pattern (responses have been unimodal), with individual responses ranging from low to moderate to high 21. For example, Malmstrom et al. 8 recently showed that the pulmonary function response to beclomethasone and montelukast in adults with asthma followed a near normal and unimodal, not a bimodal, distribution. Similar response distributions have been reported in mild asthmatics treated with inhaled beclomethasone and a leucotriene receptor antagonist 22. Collectively, the available evidence does not appear to support the hypothesis that asthmatic patients can be readily separated into largely disjoint responder and nonresponder categories using one variable. This indicates that when building a response model with pharmacogenomic covariates (e.g. haplotypes), large variability would be expected (therefore significant overlap) among the different haplotype subgroups. The present data and other published reports therefore suggest that a simple cut-off point should not solely be relied upon, e.g. 5% for FEV1, as a definition of response; instead, multivariate continuous variables should be used to capture the response profile.
Conclusion
This study assessed the relationship and correlation among several end-points of asthma control to determine if a combination of markers measured before (baseline characteristics) or early in asthma therapy could serve as predictors of a long-term response to treatment. The large within-patient variability in the end-points measured, and no more than a moderate correlation between the predictor and response variables, resulted in inadequate predictive values for the forced expiratory volume in one second and the daily symptom score. The unclear relationships among end-points and the difficulty of reliably estimating long-term response using common, clinical markers of asthma control suggest that these variables measure dissimilar aspects of asthma, and lead one to question the clinical relevance of the changes measured in any one particular end-point and to its value in identifying important clinical outcomes in asthma. Clearly, further studies utilising multiple measurements over a length of time are needed to understand the complex relationship among asthma end-points and to establish a more complete profile of early response that is predictive of future response. While the model described in this paper was shown to have some limited predictive value, efforts are underway to refine it further so that it becomes of significant use to the physician trying to establish therapies that provide improvements of a predictable magnitude.
Acknowledgments
The authors would like to thank W.B. Gough and A.S. Swern for their critical comments and S. Balachandra Dass for writing and editorial assistance.
- Received November 29, 2001.
- Accepted June 20, 2002.
- © ERS Journals Ltd
References


