


Abstract
The purpose of this study was to develop new prediction equations for flow/volume spirometry parameters in asymptomatic, never-smoking adults in Norway, and to assess any differences of these parameters when applying the new and most commonly used equation sets.
Flow/volume spirometry was measured according to the American Thoracic Society criteria in 2,792 subjects aged ≥20 yrs, randomly selected from participants in the Nord-Trøndelag Health Study. Ever-smokers and subjects with respiratory symptoms and/or diseases reported in this questionnaire were excluded. A total of 546 females and 362 males met the inclusion criteria and were included in the analyses.
Most lung function variables were nonlinear by age and had to be transformed. After a plateau in younger adults, the variables declined by age. The reference values for forced expiratory volume in one second and forced vital capacity from the present study, were higher than those given by prediction equations from the European Community for Coal and Steel, but in closer agreement with later studies from Europe, Australia and the USA.
Healthcare providers should be encouraged to reconsider their choice of prediction equations of spirometry in order to improve management of obstructive lung diseases.
The Bronchial Obstruction in Nord-Trøndelag study was funded by AstraZeneca Norway and The Norwegian Research Council.
Studies on spirometric reference values have demonstrated substantial differences in both predicted forced vital capacity (FVC) and forced expiratory volume in one second (FEV1) 1. Even though prediction equations for FEV1 and FVC have previously been developed in Scandinavia 2–6, the prediction equations from the European Community for Coal and Steel (ECCS) 7 are more commonly used in Norway. Several studies have indicated that these equations significantly underestimate predicted FEV1 and FVC 8–11, which was confirmed by the European Community Respiratory Health Survey (ECRHS) 1. As general health status, lung function and measurement devices are subject to cohort effect, regular review of reference equations has been recommended 8. Previous Scandinavian prediction equations were linear 2, 6 and, therefore, did not reflect accelerating decline by age. They included smokers 2, or a limited number of never-smokers 4, 5, and presented limited data from the elderly 11–14. Literature on flow/volume area under curve (AUC) from population studies has not previously been found, and is therefore included in this study.
The aim of this study was to establish new Norwegian reference prediction equations for lung parameters, such as FVC, FEV1, peak expiratory flow (PEF), forced mid-expiratory flow, (FEF25%–75%) and AUC, in subjects aged 20–80 yrs. In addition, the authors have assessed differences in lung function parameters using the new prediction equations, those from the ECCS 7 and other equations from Caucasians in different parts of the world 9, 10, 15–18.
Method
Subjects
During 1995–1997, all residents of the Nord-Trøndelag County aged ≥20 yrs (n=92,434), were invited to participate in the adult part of The Nord-Trøndelag Health Study (HUNT) 19. The county is situated in a central area of Norway, and 97% of the residents are of Caucasian origin. Apart from not having a large city, the geographical and demographical structure of the Nord-Trøndelag County is fairly representative of Norway as a whole 20. The education and income level and the prevalence of current smokers are slightly lower than the average for Norway 21, but the sale of antiasthmatic drugs is close to the Norwegian average 22. From 65,225 subjects (71% of those invited) who attended the primary screening, a randomly selected sample of 5% (n=3,297) was invited to phase one of the Bronchial Obstruction in Nord-Trøndelag (BONT) study. This consisted of flow/volume spirometry and an interview with a nurse. In total, 2,792 subjects participated.
Spirometric measurements and quality control
Staff, consisting of 19 nurses and technicians organized into two teams, performed the flow/volume spirometry and the interview. Team I covered the five most densely inhabited municipalities (58,805 inhabitants) and team II covered the 18 smaller municipalities (33,629 inhabitants).
Flow/volume spirometry was recorded with three pneumotachographs (MasterScope spirometer, version 4.15, Erich Jaeger GmbH, Wuerzburg, Germany). The instruments were calibrated twice daily with a 1 L syringe. The staff also performed a daily biological control by assessing their own lung function. The participants were seated and wore a noseclip, and extension or flexion of the neck was avoided. Height and weight were measured barefoot and in light clothing with standardized equipment. Barometer pressure, temperature and relative humidity were registered every morning, and the integrated volumes were automatically converted from ambient temperature and pressure to body temperature and pressure, saturated conditions.
The staff initially went through formal training and were then continuously monitored during the entire study by the head of the project. In accordance with the 1994 American Thoracic Society (ATS) recommendations 23, they were taught to instruct the subjects to perform three acceptable and reproducible manoeuvres, ensuring that the subjects produced the highest possible peak flows and that the expiration continued for ≥6 s. If the subjects were unable to do this, up to five manoeuvres were performed. The flow/volume curve with the highest sum of FEV1 and FVC was retained. The computer provided the technicians with feedback as to whether the acceptability and reproducibility criteria were met. The error messages given were in accordance with the 1987 ATS recommendations, with a reproducibility criteria of <100 mL or 5% difference between FEV1 and FVC in the two best tests, and a lower limit back extrapolated volume of 100 mL 24. In the 1994 ATS recommendations, these limits were 200 mL and 150 mL, respectively 23.
Reference sample
The reference sample was selected from the 5% randomized sample (n=2,792), based on questionnaire results. The selection criteria followed ATS recommendations 8: 1) life-time never-smokers; 2) no respiratory disease (self-reported or medical doctor diagnosed asthma, emphysema or chronic bronchitis); and 3) no reported respiratory symptoms (wheezing or breathlessness during the last 12 months, persistent coughing or complaints of breathlessness for any reason).
Prediction equations and statistics
Sex-specific multiple linear regressions of lung function on height, age, weight, and body mass index (BMI) in various powers and interactions were performed. Statistical significance and fraction of explained variability were the main criteria for selecting independent variables and transforming lung function variables. Independent variables were centred (i.e. observed values minus variable mean) in the regressions for selection of the best model in order to reduce collinearity among higher order and cross-product terms. The assumptions of linearity and homoscedasticity were controlled.
The selection of prediction equations for comparison was based on common use 7, 15, 18, use of nonlinear equations 9, 10, 17 and inclusion of the elderly 12. The differences between predicted values based on the prediction equations from the present study and others are given as Bland Altman plots, whilst the differences between observed values and values predicted by the prediction equations are given as mean difference in per cent of mean observed values and mean squared difference.
Comparisons of lung function between the groups were performed by analysis of variance, adjusting for covariates. A p-;value of <0.05 was considered statistically significant.
Results
Participants
After the exclusion of previous and current smokers, and those reporting respiratory symptoms or disease 8, a total of 546 females and 362 males aged 20–80 yrs were included in the reference sample (tables 1 and 2⇓⇓). Subjects with adiposity or a low score for global health questions were not excluded, as this did not significantly influence the parameters (data not shown).
The reference sample selected according to American Thoracic Society criteria, included 1,282 males (M) and 1,510 females (F), and represented the 5% random sample of the total population
Sex and age distribution in the 20–80 yrs age group of the reference sample and the total population
Quality control
The staff
The nurses/technicians assessed their lung function on the days that they worked at the spirometry stations. A total of 975 such flow/volume assessments were recorded by 19 nurses/technicians. When three nurses with known asthma were excluded, the intra-individual coefficient of variation (=100×sd divided by the mean) of FEV1 during the 2-;yr survey period varied from 2.6–5.5%, with 4.0% as the mean.
The study population
When using the 1987 ATS recommendations, 12.7% of females and 7.7% of males failed to meet the FEV1 reproducibility criteria. In contrast, 6.8% of females and 7.1% of males failed to meet the criteria when the 1994 ATS recommendations were applied.
With the inclusion of the whole study sample (n=2,792), the comparison between the two test teams of the mean FEV1 and FVC showed only minor differences, 1.4% and 0.8% for FEV1 and FVC, respectively (adjusted for age, sex, height, and pack-yrs).
Prediction equations
Scrutinizing the plots, most lung function variables were nonlinear with age and showed a plateau in younger adults with a decline after the age of 35–40 yrs. Exploring the regression models, square age and ln(height) were found to contribute significantly to the explained variance of all lung function parameters, except FEV1/FVC.
The prediction equations for the means were developed by regressing the natural logarithms of lung function variables against ln(height), square age, and age, as performed in the Swiss Study on Air Pollution and Lung Diseases in Adults 10, 25. The use of natural logarithms and square age improved the explained variance by 1–2%, compared to linear models (table 3⇓). Separate equations were tested in males under and over the age of 25 yrs 7, 10, but polynomial regression equations provided a significantly better fit than linear regressions with breakpoints 17, 26.
Prediction equations from the Bronchial Obstruction in North Trøndelag (BONT) study for particular parameters with explained variance (adjusted R2) and residual standard deviation (RSD) based on 362 males and 546 females
No significant interaction between age and height was found. Weight, weight2 and BMI were significant parameters for FEV1 and FVC when included in the models, but they were not included in the final prediction equations as this increased the adjusted explained variance by <1%, and these measures are less reliable than height 25.
The distributions of FEV1, FVC, PEF and FEF25%–75% were similar to the Gaussian distribution, and the assumptions of homoscedasticity were met. Therefore, one-sided lower 95% prediction intervals were used to determine the lower limit of normal lung functions 7, 26 (table 3⇑).
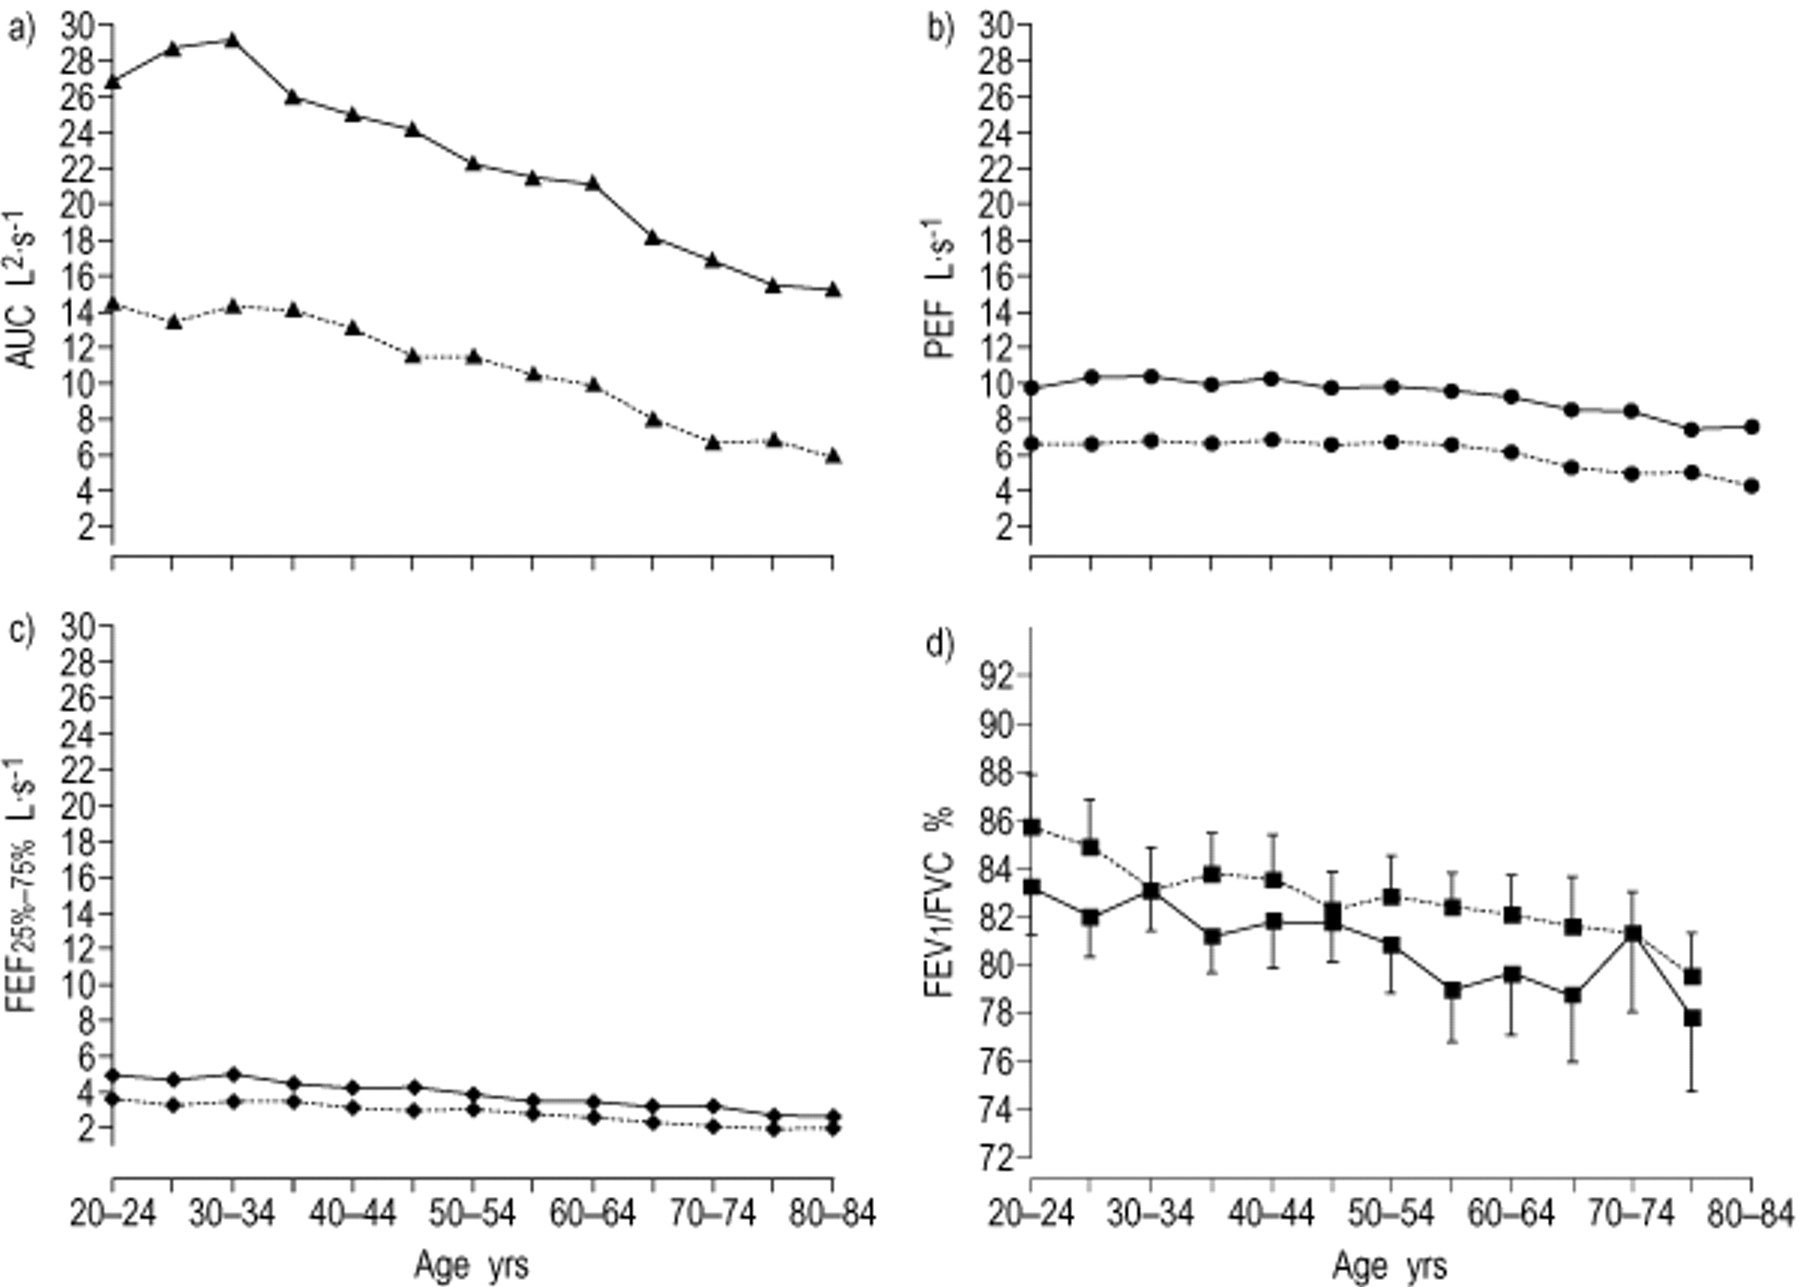
From the age of 35–39 yrs, FEV1, FVC, AUC and FEF25%–75% declined with age (figs. 1 and 2⇓⇓). For both FEV1 and FVC, regression coefficients for age decreased with increasing age, whereas, with regard to the regression coefficients for height, no significant change was found with age except for higher coefficients in the youngest female group (p<0.05) (table 4⇓). FEV1/FVC decreased with the age of the cohort in both sexes (0.12–0.14%·yr−1, p-;value for trend <0.05) (fig. 2⇓).

Mean observed forced expiratory volume in one second (FEV1) and forced vital capacity (FVC) in 5-;yr intervals with 95% confidence intervals (•) and FEV1 and FVC predicted by the Bronchial Obstruction in Nord-Trøndelag (BONT) study in males and females. BONT predicted is indicated by the following lines: ____: FVC males; -;-;-;-;-;-;-;: FEV1 males; – – – –: FVC females; —-;—-;: FEV1 females.

Mean observed a) area under curve (AUC), b) peak expiratory flow (PEF), c) forced mid-expiratory flow (FEF25%–75%), and d) forced expiratory volume in one second (FEV1)/forced vital capacity (FVC) % in 5-;yr intervals in males (____) and females (-;-;-;-;) by age. 95% confidence intervals are shown in d).
Regression coefficients for age and height in females and males in age-stratified multiple linear regression analysis with forced expiratory volume in one second (FEV1) and forced vital capacity (FVC) as dependent variables
Comparison with other prediction equations
When the prediction equations from the present study (table 4⇑) were compared with other prediction equations 7, 9, 10, 12, 15, 17, 18, the authors found that the closest agreement for FEV1, FVC, PEF and FEF25%–75% in females was with Hankinson et al. 17. In males, similar agreements were found for FVC and PEF, but for FEV1, the closest agreement was with the prediction equation of Roca et al. 18 (table 5⇓).
The per cent mean differences and mean square of differences between observed values in this study and predicted values according to different prediction equations
The difference by mean predicted value between the present study and the ECCS was fairly constant for FEV1 in both sexes (fig. 3⇓) and FVC in females (fig. 4⇓). For FVC in males, the relation increased proportionally when the present prediction values were compared with those from ECCS 7, Hankinson et al. 17 and Brändli et al. 10 (fig. 4⇓). Unlike the regression coefficient for age, the coefficient for height in the present study was significantly higher than that reported in other studies that used linear regression models without polynominal terms (∼0.080 versus 0.056–0.057) 7, 12, 15, 18 (table 4⇑). This is, however, in agreement with previous studies from Norway and Sweden 2, 5 (figs. 3 and 4⇓⇓).

Bland Altman plots showing the difference between forced expiratory volume in one second (FEV1) against mean FEV1 predicted by a) and b) Bronchial Obstruction in Nord-Trøndelag (BONT) versus European Community for Coal and Steel 7, c) and d) BONT versus Hankinson et al. 17 e) and f) BONT versus Brändli et al. 10, and g) and h) BONT versus Gulsvik 2 in females (a, c, e, g) and males (b, d, f, h).

Bland Altman plots showing the difference between forced vital capacity (FVC) against mean FVC predicted by a) and b) Bronchial Obstruction in Nord-Trøndelag (BONT) versus European Community for Coal and Steel 7, c) and d) BONT versus Hankinson et al. 17 e) and f), BONT versus Brändli et al. 10, and g) and h) BONT versus Gulsvik 3 in females (a, c, e, g) and males (b, d, f, h).
The Bland Altman plots confirm the underestimation of both FEV1 and FVC by prediction equations from the ECCS versus the present study (figs. 3 and 4⇑⇑). However, closer agreement is confirmed between the present study and other studies included in the comparisons (table 5⇑ and figs. 3 and 4⇑⇑).
Discussion
Based on a random sample that only included asymptomatic never-smokers, the authors have estimated prediction equations for lung function variables. The present study confirms that the ECCS prediction equations, which are the most commonly used in Norway, significantly underestimate FEV1 and FVC. According to the Global Initiative for Chronic Obstructive Lung Disease, the British Thoracic Society, and the European Respiratory Society guidelines, FEV1 level in per cent of predicted gives the severity of airflow limitation. The choice of reference values may, therefore, be of clinical importance.
As a cross-sectional population study, the data from the present study are subject to cohort bias due to a variety of host and environmental factors 8. Compared to longitudinal studies, cross-sectional studies are cheaper and more practical for developing prediction equations, but need to be repeated regularly in different regions. No reference values are available from northern Europe in the 1990s. The strengths of this study are the random selection of the reference group from a total adult population, surveillance of the technicians and equipment by the same person, and direct feedback to the technicians about the acceptability and reproducibility of the flow/volume curves.
Participation
Of the 5% random sample, 85% participated in the BONT study. A nonresponder study did not reveal differences in respiratory symptoms or diseases between the responder and the nonresponder groups 19. There were no indications of selection bias caused by the number of nonresponders, except in the elderly, where the healthiest and most mobile subjects might have been over-represented.
Technical factors
Failure to meet the acceptability criteria for spirometry has been reported in many studies 27–30. Using the 1987 ATS recommendation for FEV1 and FVC 7, the authors observed similar percentages of test failure as Humerfelt et al. 29. Many had problems with the end of plateau criterion based on the 1987 ATS recommendations 31. The curves were, therefore, visually controlled, and those with a plateau beginning at the volume/time curve were included in the present analyses. Lack of end of plateau could cause an underestimation of FVC and overestimation of FEV1/FVC 23. Subjects >80 yrs of age were excluded because of a low participation rate, few asymptomatic never-smokers, and problems with the reproducibility and acceptability criteria.
Automatically retaining the curve with the largest sum of FEV1 or FVC might have retained some curves with submaximal effort. Krowka et al. 32 found that FEV1 was inversely dependent on effort, but in accordance with the ATS, the present authors did not exclude curves with submaximal effort 23. Saving such curves and the lack of quality control criteria for PEF in the software might have caused underestimation of PEF. Only minor differences between the present study and the ECCS of this parameter compared to FEV1 and FVC could indicate such underestimation. A possible criterion for effort based on the PEF/FEF50% ratio could solve this problem in future studies.
Lung function by age
The associations between FEV1, FVC and age found in this population are similar to results from previous cross-sectional studies 7, 14, 33–36. The authors found that FEV1/FVC uniformly reduced with age, but the levels were higher and declined less through age groups than reported in other studies 13, 33, 34. Within the oldest group, “super-healthy” elderly survivors could lessen the slope of the regression curve, and spuriously increase the predicted values for the middle-aged 26. In the present study, the fitness of the prediction equations in the middle-aged was hardly affected by this.
Comparison with other prediction equations
The estimates from the prediction equations for FEV1 and FVC were in closer agreement with the results from other studies 9–11, 15, 17, 18 than those from the ECCS 7. Even if asymptomatic smokers were included in the previous set of equations from Norway 3, the present study is in greater agreement with this study than that of the ECCS.
Roca et al. 1 estimated prediction deviations (observed values minus values estimated by ECCS equations) for FEV1 and FVC from the ECRHS. Using the same inclusion criteria, the prediction deviations of FEV1 were nearly identical in the ECRHS and the present study, whilst an ∼10% higher deviation of FVC in both sexes was found in the present study compared to ECRHS (data not shown).
The ECCS prediction equations were summary equations compiled from a review of previously published equations, including different populations and using different spirometers and techniques. Comparisons with other studies do not indicate that the type of spirometer 9, 15, 17, 36 explains the difference compared to the prediction equations from the ECCS. The differences between the prediction equations from the ECCS and later studies may be the result of a significant increase in lung function parameters, as is seen in other anthropometric measures, such as height 37, 38, change of technique and different exclusion criteria for the reference sample, or use of qualitative controls, such as immediate feedback on acceptability and reproducibility of spirometric measurement 10. Increased awareness and better reporting of respiratory symptoms in the population could also result in the selection of healthier subjects in more recent reference samples. If the authors included subjects that had respiratory symptoms but had not been diagnosed as having a respiratory disease, this had little effect on the predicted values (data not shown). This, therefore, does not explain the differences compared to ECCS.
Higher levels of FEV1/FVC were found than has been predicted by other studies. The prediction equations of Roca et al. 18 and Enright et al. 16 showed a different pattern with a higher decrease by age than the present study. Including light exsmokers in the present analyses, as seen in the study of Enright et al. 16, resulted in a 0.4% reduction of FEV1/FVC, which does not explain the differences found. The differences could have been caused by a bias toward healthier subjects in the elderly group compared to other studies, or by a higher succession rate in getting optimal expiration from the elderly in the study of Enright et al. 16. Comparably low explained variance of regression models for this parameter have also been reported in other studies and are also dependent upon the number of subjects included 6, 10, 12.
Conclusion
The authors have developed prediction equations for lung function parameters from a random sample of never-smokers without reported symptoms or diseases. The present study confirms the results from recent studies from Europe, the USA and Australia, all of which indicate a higher level of predicted lung function parameters than those predicted by the equations from the European Community for Coal and Steel. The results have substantial clinical implications on the diagnosis and management of patients with symptoms of obstructive lung disease. Healthcare providers should be encouraged to reconsider their choice of prediction equations of spirometry; the authors recommend the use of the Norwegian prediction equations.
Acknowledgments
The Nord-Trøndelag Health Study (HUNT) is a collaboration between the HUNT Research Centre, Faculty of Medicine, Norwegian University of Science and Technology (NTNU), Verdal, The National Institute of Public Health, The National Health Screening Service of Norway, and Nord-Trøndelag County Council.
- Received January 30, 2001.
- Accepted July 3, 2001.
- © ERS Journals Ltd
References


